
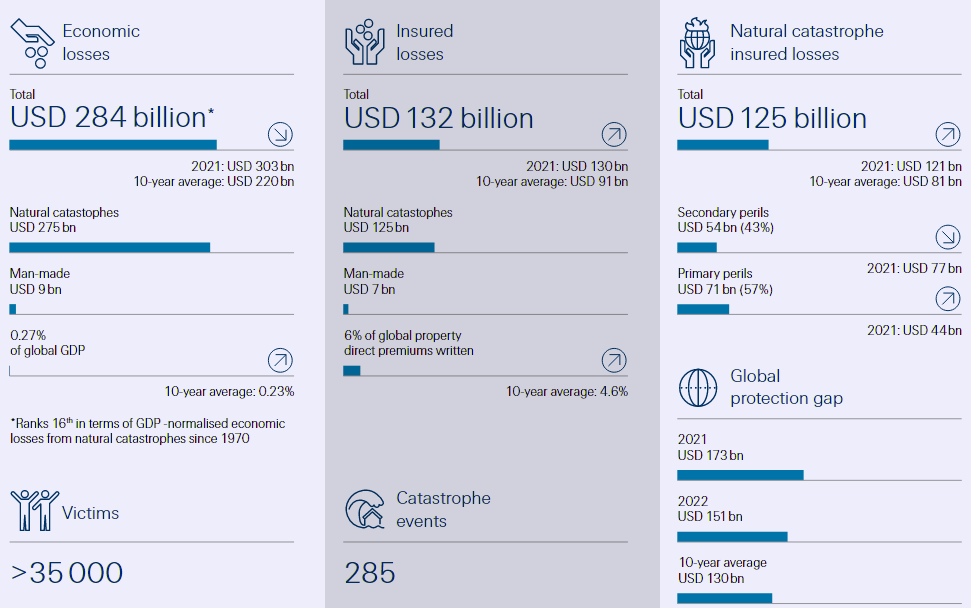
Natural disasters resulted in global economic losses of USD 275 billion in 2022, of which USD 125 billion were covered by insurance, the fourth highest one-year total on Swiss Re sigma records.
Property catastrophe reinsurance rates rose to 20-year highs in the January 2023 renewals, continuing a trajectory that began in 2018. Demand for covers has grown as natural disasters continue to wreak property damage across the world.
Beyond the natural catastrophes themselves, other factors such as the impacts of economic inflation and financial market losses have also fed into market hardening.
An additional contributing factor has been the need for more discipline in the modelling and underwriting of secondary perils in particular. This has led to mismatches of risk assessment and actual exposures and, in turn, insufficient market capacity.
Insured losses well above the 10-year average
Average annual growth trend of 5‒7% in insured losses from natural catastrophes affirmed
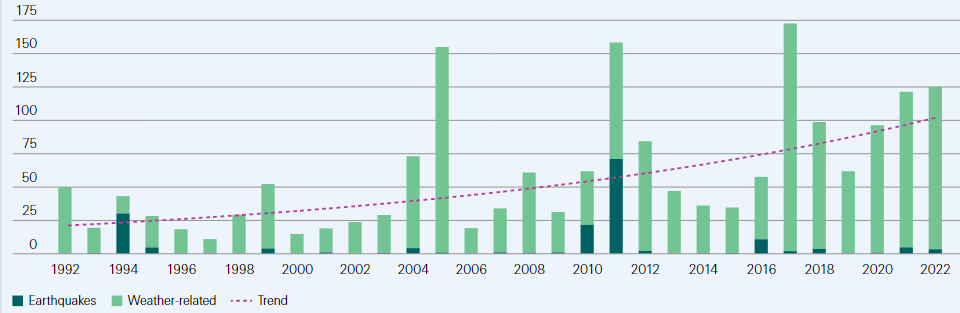
According to Climate & Global Natural Catastrophe Insight, since 1992, insured losses have grown by 5‒7% on an average annual basis. This includes the period 2012‒16 when losses were at a lower annual mean. Irrespective of yearly volatility, insured losses will likely continue to grow at trend, even when real-time amplifying factors such as current high levels of inflation recede.
Growth in global natural catastrophe insured losses in USD billion
Last year was “average” in terms of hurricane activity in the North Atlantic. Even so, the 2022 hurricane season is third most costliest on sigma records. The reason is Hurricane Ian, which resulted in estimated insured losses of USD 50‒65 billion.
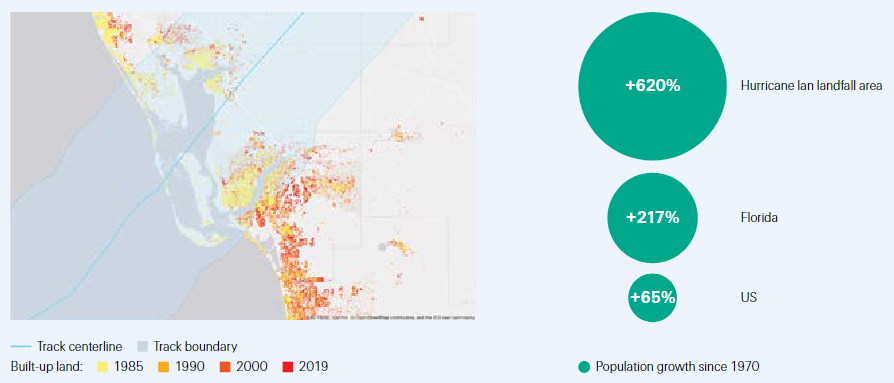
When Ian made landfall in western Florida as a category 4 storm, it hit an area that has seen rapid population growth, expansion of built areas and accumulation of physical assets.
Since 1970, the population where the storm made landfall has increased by 620%, exceeding both the population increase in the state of Florida (+217%) and the entire US (+65%).
Hurricane Ian demonstrates that location of landfall rather than number of storms, is the main driver of heavy loss burdens.
Changes in built-up land in the Ian landfall area (left) and population growth statistics (right)
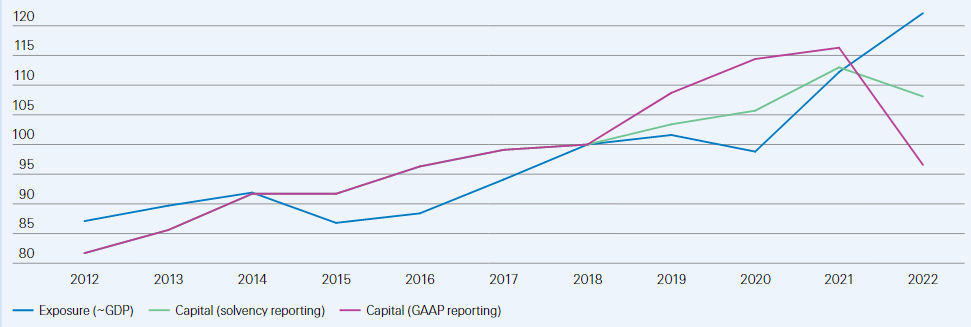
Global reinsurance capital vs exposure growth
Demand for coverage for natural disasters had risen on evidence of increased catastrophe activity, and because of higher insurable values of buildings and other fixed assets (see Worst Natural Disasters in 2022).
Сatastrophe claims pay outs have reduced the supply of re/insurance capital. Rising interest rates and lower financial asset values have also contributed to supply constraints.
Risk appetite has further decreased due to poor property re/insurance underwriting results in recent years, and widely held perceptions that risk assessments are underestimating actual loss experience. This is leading to hesitation on the part of capital providers to commit new funds to re/insurance risks and replenish the industry capacity.
Global reinsurance capital vs exposure growth
Insured losses from natural catastrophes: 2022 and longer-term trends
At USD 125 billion, global insured losses from natural catastrophes in 2022 are the fourth highest on sigma records. Each region of the world suffered a major event. Hurricane Ian was the year’s biggest loss event, and ranks as the second-costliest insurance natural catastrophe loss ever on sigma records.
Average annual industry losses from natural catastrophes of more than USD 100 billion are standard.
Last year’s outcome continued a run of seemingly elevated global insured losses since 2017 after a benign 2012‒2016 period, reaffirming an average annual growth rate of 5‒7% in losses in place since 1992. We expect this trend to continue, driven by growing loss severity on account of rising property and values-at-risk exposures, continued urban sprawl, economic growth and a backdrop of hazard intensification due to climate change effects.
Global insured losses from natural catastrophe events in 2022
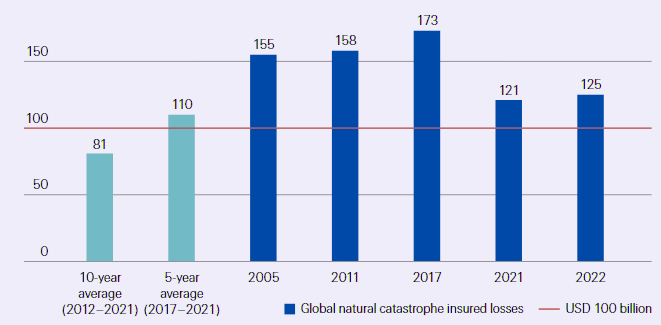
Last year’s natural catastrophe-related losses were, once again, high. Driven mostly by extreme weather events, global insured losses from natural disasters were USD 125 billion in 2022, well above the previous 5- and 10-year averages (USD 110 billion and USD 81 billion).
The losses were the fourth highest in any one year since 1970 and for first time ever, global insured losses exceeded USD 100 billion two years running.
The insured annual loss totals from natural catastrophes has surpassed the USD 100 billion-mark five times since 1970, and three times in the past six years (2017, 2021 and 2022). Economic losses of USD 275 billion point to a still large protection gap, with around 54% of the total losses uninsured.
Though still large, this is less than the 61% average protection gap of the previous 10 years. Last year’s main events hit areas of relatively higher insurance penetration, attesting to the fundamental value proposition of the industry to making households, businesses and institutions more resilient.
Global natural catastrophe insured losses, in USD billion
Hurricane Ian was the costliest event of 2022, resulting in estimated insured losses of USD 50 to 65 billion. The category 4 hurricane made landfall in western Florida in September, bringing strong winds, torrential rain and storm surge.
After Hurricane Katrina in 2005, Ian ranks as the second-costliest natural catastrophe insured loss event.
It pushed global insured losses from tropical cyclones above prior-period averages, making 2022 the third most expensive hurricane season on record after 2005 (Katrina, Wilma and Rita) and 2017 (Harvey, Irma and Maria).
Flood and hailstorm events across the world also resulted in significant losses
At over USD 33 billion, global insured losses from severe convective storms (SCS) were also above prior-period averages, driven by thunderstorms with hail and tornadoes in the US. Another contributor was the highest-ever annual loss (USD 5 billion) from hailstorms in France.
Global losses from floods were just above average, the main event being flooding in eastern Australia in February-March. The flooding resulted in insured losses of USD 4.3 billion, the biggest natural catastrophe claims event ever in Australia.
Another national “costliest ever” event was flooding in Durban in South Africa in April, leading to estimated insured losses of USD 1.5 billion.
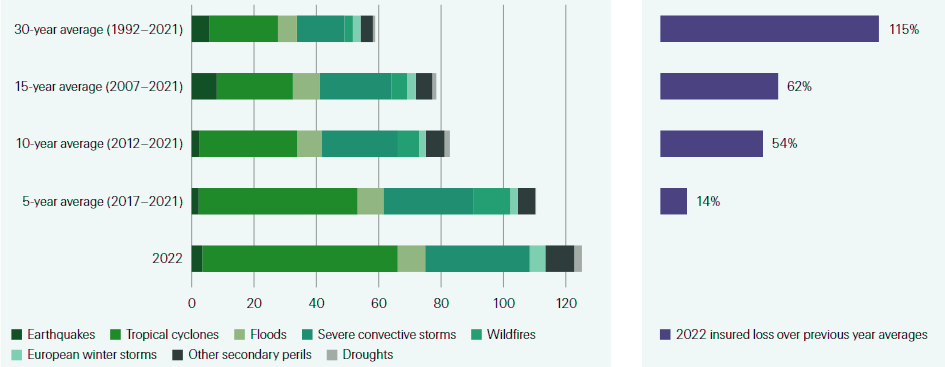
Global insured losses from natural catastrophes in 2022 by category, in USD billion
After a few years with low loss-severity winter storms, in February 2022 a cluster of storms (Eunice, Dudley, Franklin) in northwestern Europe triggered combined claims of an estimated USD 4.1 billion, bringing the total for this category to almost double the previous 10-year average.
Winds in winter storms are less severe than in tropical cyclones, but large parts of Europe can be impacted by a single storm, and damage in different locations can see combined losses accumulate to multi-billion levels.
At the opposite end of the temperature spectrum, weather variability and anomalous atmospheric circulation conditions caused severe drought and heatwaves across the world. Heat and drought impacted crop yields in many regions, adding to global food inflation pressures and elevated agriculture insurance losses.
In Europe, the summer of 2022 was the hottest on record. In Morocco, heat and dry conditions4 coincided with a North Atlantic Oscillation phase of rainfall deficit. In Brazil, monsoon rains were below average.
Crop yields, particularly for soybean and maize, suffered most. Total precipitation across contiguous US in 2022 made the year the third driest on record, and crops yield were lower than in 2021. And in China, extreme heat and dry conditions in the Yangtze River and weak monsoon rains impacted summer crops.
Insured crop losses due to drought in select markets, USD billion
| Country | Economic losses | Insured losses |
| Brazil | 13 | 1 |
| Europe | 6.2 | 0.6 |
| China | 4.7 | 0.8 |
| Morocco | 0.25 | 0.04 |
Longer-term insured loss trends
Losses from individual perils fluctuate year on year. That said, at on average 30% each, the contribution to global insured losses from the two biggest peril categories – tropical cyclones and SCS – have remained largely stable over the last 40 years.
On the east coast of the US, hurricanes (primary perils) originating in the North Atlantic are a main threat to residents and businesses.
Though rare, when a major hurricane strikes, the losses can be very severe. As in the case of Hurricane Ian, just one peak tropical cyclone event can wreak very large losses.
SCS are categorised as secondary perils, occur more frequently and happen all over the world. Given the frequency, aggregated their annual loss amounts are less volatile.
Typically, losses resulting from SCS are lower than for primary perils, but there have been instances when a single SCS has resulted in insured losses of similar size to those coming in the wake of medium-sized hurricane. Noteworthy too is a marked step up in the share of all SCS to insured losses in the last decade.
Share of insured losses by peril type by decade
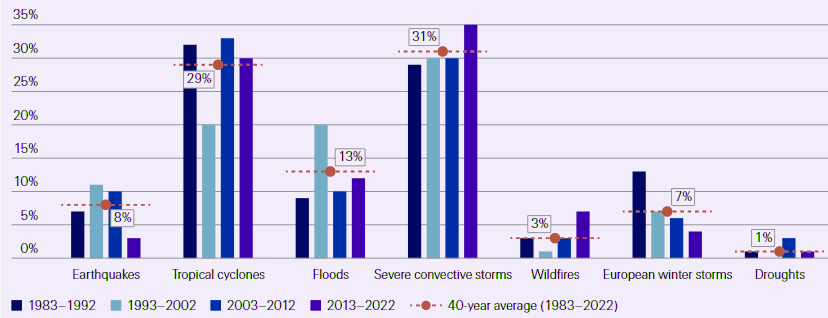
Another longer-term trend development has been a doubling of the share of natural catastrophe insured losses from wildfires over the last 30 years.
Fire-related losses were low in 2022 itself but in recent years, large wildfires have wreaked huge damage and unprecedented losses, notably in North America (in Canada in 2016, and in California in 2017, 2018 and 2020).
They reflect a rising risk due to ever-increasing populations in the wildland-urban interface, particularly in California. The trend may also signal hazard intensification as the planet warms, with extreme heat conditions adding fuel to wildfire formation. Projected changes in climate and prolonged periods of heatwaves in the next decades may well increase the frequency and loss severity of large wildfires and drought events.
Meanwhile, in the absence of major events, the share of European winter storms in annual natural catastrophe-related insured losses has been declining since the large storms of 1990 (winter storms Daria and Vivian) and 1999 (winter storms Lothar, Martin and Anatol).
Winter storms are an ever-present hazard in Europe and, as the 2022 experience shows, just one event or cluster of storms can result in significant property damage.
Equally, the comparably low level of earthquake losses over the last decade (ie, post the seismic events of 2010 and 2011 in Chile, Japan and New Zealand) should not lead to underestimation of this low frequency-high severity peril: earthquakes are rare but as with other primary perils, when a major quake strikes a heavily populated urban area, the resulting losses can be enormous.
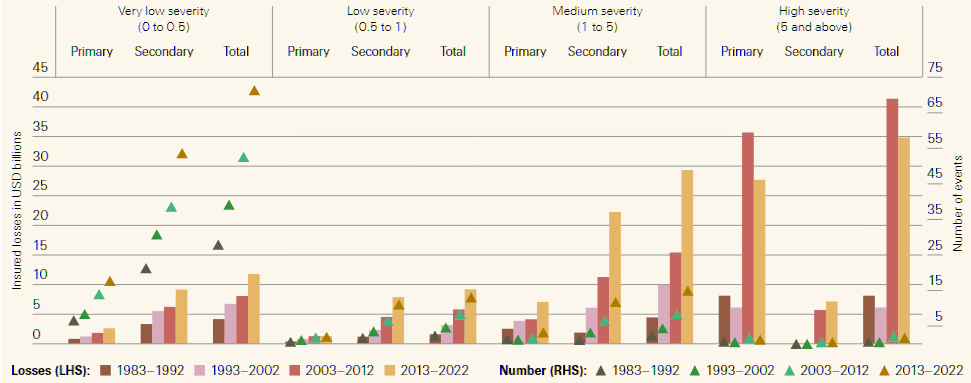
Loss severity of individual primary and secondary peril events on the rise

Across perils, there has been a shift in distributions to larger insurance loss amounts. Breaking down the losses by severity, medium (USD 1–5 billion of insured losses) and high severity (more than USD 5 billion) events contribute the majority of all insured losses.
The associated losses are rising faster than those from very low severity events (less than USD 0.5 billion), even though the latter occur more frequently. From 2013‒2022, there were on average 70 low severity events each year.
Their contribution to total insured losses, however, was justUSD 11.7 billion. Over the same decade, an average of just two high-severity events each year contributed USD 34.4 billon cumulatively to total losses.
Thus, over the last 40 years, growth in annual losses has been primarily driven by rising severity of losses, these resulting from medium- to high-loss secondary and high-severity primary peril events.
Tropical cyclones and SCS have consistently been the main contributors to global insured losses.
High severity secondary peril events of the magnitude of the floods in Thailand (2011) and Germany (2021), and wildfires in North America were unheard of before 2011.
The fact that these natural disasters have occurred more frequently in the last decade is indicative of the growing threat they present. Overall, this implies that the main physical driver of associated losses has been accumulation of value exposure as a result of economic development, urbanisation and rising population concentrations, often in regions susceptible to natural hazards (eg, coastal regions, river fronts, wildland urban interface).
10-year averages of insured losses (left) and number of events (right) by severity category in USD billion of insured loss per event
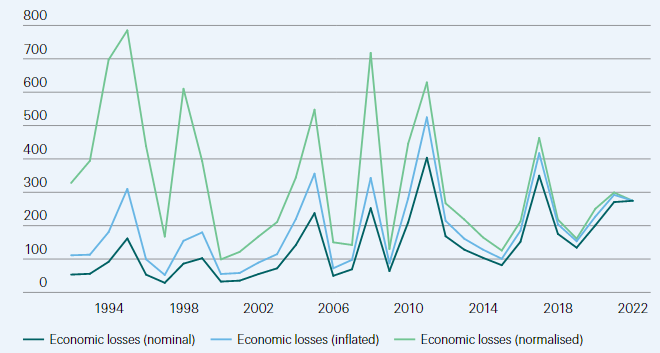
Another way to demonstrate the impact of socio-economic factors on loss history is to “normalise” the economic losses triggered by natural catastrophes for nominal GDP growth effects.
An event of the past, if it were to occur at equal magnitude today, would cause more economic damage than in the year of occurrence due to exposure value accumulation.
A common approach is to apply real GDP and inflation factors to past economic losses. We thereby estimate that the annual growth rate of global normalised (adjusted for inflation and real GDP growth) losses from natural catastrophes between 1992 and 2022 is around 1.2% on a 10-year moving average basis, still increasing but at much slower rate than shown by nominal losses (7%) and also real (adjusted for inflation) losses (4.5%) over the same time period.
Nominal, inflated (2022 prices) and normalised economic losses from natural catastrophes, USD billion
Up-trend reaffirmed, and set to continue
Insured losses from natural catastrophes have been on a long-term upward trajectory for much longer than the last six years. Since 1992, the average annual trend growth of losses has been 5‒7%.
In the period 2012‒2016, losses were at a lower annual mean, but there has been a return to said trend growth over the last six years and we expect this to continue.
We project that irrespective of year-on-year volatility, insured losses will continue to grow at trend, even when real-time amplifying factors such as high inflation subdue.
Growth in global natural catastrophe insured losses in USD billion
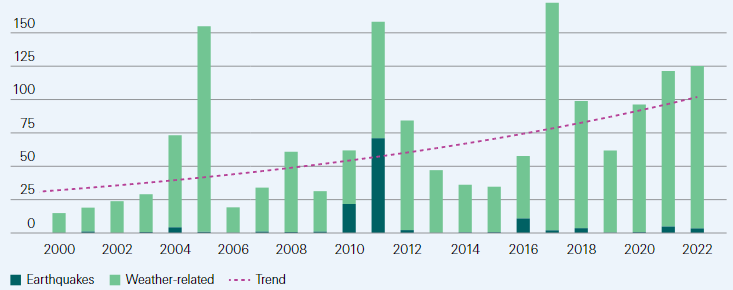
Starting from 2017, average annual insured losses from natural catastrophes have been above USD 110 billion, more than double the average of USD 52 billion over the previous 5-year period.
This marks a notable step-up in the scale of losses after the 2012‒2016 period of benign losses.
Asset value accumulation in an area struck by an extreme weather or other natural catastrophe can spark heavy financial losses. Another factor has been changes in construction costs.
Of late, aging infrastructure vulnerabilities and inflationary pressures have boosted repair costs. And, with demand-supply imbalances of materials and labour still in play in the post COVID-19 era, we expect construction costs to remain elevated into 2023, further inflating repair and reconstruction costs.
This will impact attritional losses and further augment property losses over the next two years at least. Hazard intensification will likely play a bigger contributory role to rising losses in the coming decade also. With the world getting warmer, findings from scientific research infer that climate change effects on loss frequency and severity will intensify.
Losses of more that $100 bn annually are here to stay
We also expect, irrespective of below-average loss years, that annual insured losses will average more than USD 100 billion from hereon. Our expectation is supported by other parties: for example, Verisk recently modeled the global insured average annual loss as USD 123 billion.
In any one year losses can be higher or lower depending on whether natural catastrophe events do or do not strike urban and more populated areas.
A case in point, had Hurricane Ian last year made landfall in the Tampa Bay area as many predictions were showing, the resulting losses would have been much higher.
There is no reason to anticipate that this, nor peak-loss disasters like Hurricane Katrina in 2005, will not happen again in the future. The takeaway is to not underestimate loss potential on account of a year or period of below trend growth.
…………………..
AUTHORS: Lucia Bevere – Senior Catastrophe Data Analyst Swiss Re Institute, Thierry Corti – Climate Change Lead Swiss Re Institute, James Finucane – Senior Economist Swiss Re Institute, Roman Lechner – P&C Economic Research Lead Swiss Re Institute