

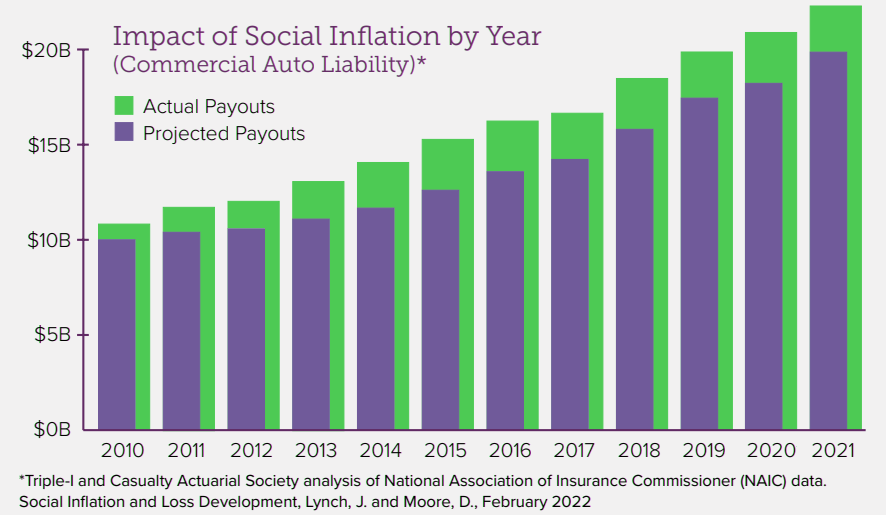
The phenomenon of social inflation has garnered a great deal of attention in the property and casualty P&C insurance industry. The term defies strict definition, though it is widely acknowledged to involve excessive growth in insurance settlements. Insurance Information Institute estimate that social inflation increased commercial auto liability claims by more than $20 billion. Evidence of a similar trend is also present in two other lines of business: other liability—occurrence and medical malpractice—claims made.
The Triple-I/CAS paper, Social Inflation and Loss Development confirms and quantifies one of the primary factors driving up the cost of commercial auto insurance.
A separate Insurance Research Council (IRC) paper illustrated how losses across several insurance lines have accelerated in recent years much faster than economic inflation alone can explain.
Claims-made insurance can provide coverage

In addition, while the Triple-I/CAS paper focused on commercial auto insurance, it also identified evidence of similar trends in other lines, such as “other liability occurrence” and claims-made medical malpractice.
An occurrence policy pays claims arising during the policy term, even if they are filed many years later. Claims-made insurance can provide coverage when a claim is made, even if it arises from an incident that occurred years ago.
The term social inflation isn’t new—Warren Buffett used it in the 1970s to describe “a broadening definition by society and juries of what is covered by insurance policies.”
The term has become increasingly common as insurance companies try to describe the contemporary societal forces that they believe are accelerating loss costs. Actuaries in some quarters, particularly outside the United States, have referred to similar phenomena as superimposed inflation.
For this paper, we define social inflation as excessive inflation in claims. The paper attempts to find evidence consistent with social inflation via standard actuarial analyses of aggregate industry data.
Specifically, we examine the loss development factors from standard accident year loss triangles. As such, we focus on evidence that the size of claims has increased.
Although many discussions of social inflation suggest the phenomenon increases claims frequency, such an exploration is beyond the scope of this study.
Basic actuarial techniques such as the chain-ladder method assume that losses move from unreported to reported in a consistent, predictable manner. Many factors drive that movement, one of which is inflation.
Embedded in the typical process of selecting a loss development factor—taking the average of several link ratios—is the assumption that development factors are values taken by a random process with a stable mean.
That implies that inflation over the period has been constant. In basic actuarial reserving text, analytics notes that the chain-ladder method assumes no changes within the insurance organization, such as the introduction of new claims processing systems, claims management philosophy, policyholder deductibles, or reinsurance limits. The method also assumes no environmental changes, such as tort reform.
One can infer that steadily increasing link ratios imply that the process no longer has a stable mean. The instability could, in theory, have many causes, but for the data we examine, we assert that the most likely reason is an increase in claims inflation, or, in modern parlance, social inflation.
Drivers of Social Inflation

Considered to be a growing cost of doing business in the insurance industry, social inflation is influenced by negative public sentiment about larger corporations, litigation funding, and tort reform rollbacks at the state legislative level, all of which have increased liability costs.
Shifting public perceptions and attitudes may lead jurors to sympathize with plaintiffs when awarding damages. Jurors may also believe the business, or the insurance company, has unlimited financial resources, leading to what’s commonly known as “shock” verdicts.
These monetary damage awards are much higher than expected based on the evidence presented at trial, often exceeding $10 million.
Emotional appeals to juries by plaintiff’s attorneys are nothing new. Neither are class action lawsuits. But the plaintiff’s bar has gone to a new level with tactics like third-party litigation funding and litigation lending, the report notes.
Funding of lawsuits by international hedge funds and other financial third parties – with no stake in the outcome other than a share of the settlement – has become a $17 billion global insurance industry, according to Swiss Re.
Law firm Brown Rudnick sees the industry as even larger, estimating it as a $39 billion global industry, according to Bloomberg.
P&C Insurance premium and ultimate loss
Some states have implemented rules requiring disclosure of third-party litigation funding in lawsuits, which would give defense attorneys and juries insight into the entities other than the plaintiff who are financing the legal fees of plaintiff’s attorneys (see Global Commercial Property & Casualty Insurance Market Review).
Such efforts predictably meet resistance from third-party litigation funders.
The 13 largest commercial litigation funders in the world formed the International Legal Finance Association (ILFA) to advocate for litigation funding and oppose blanket disclosure requirements.
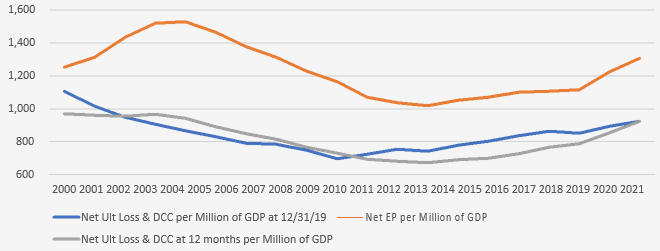
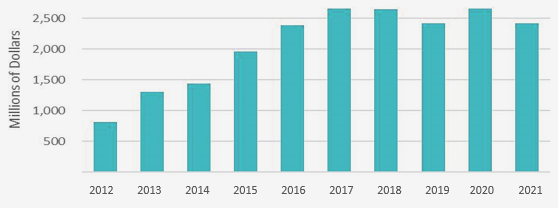
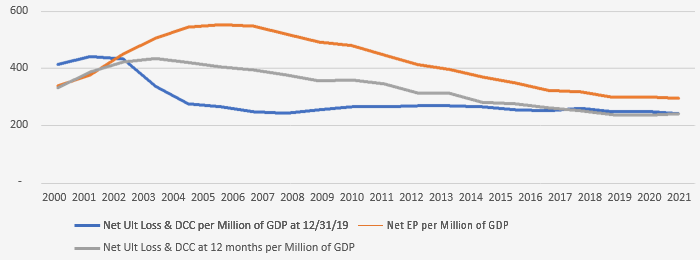
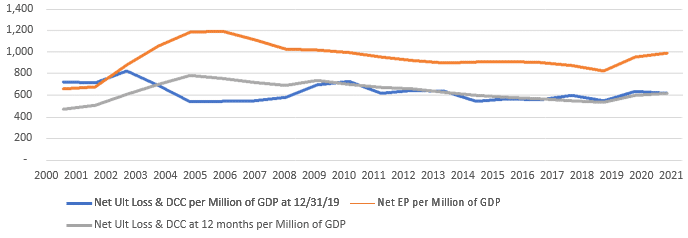
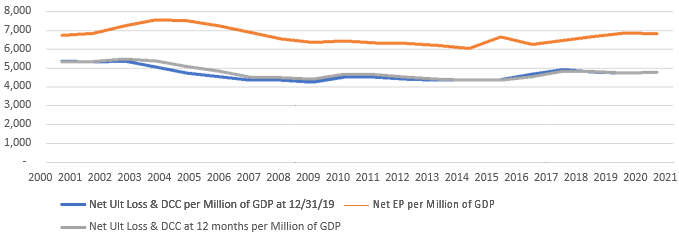
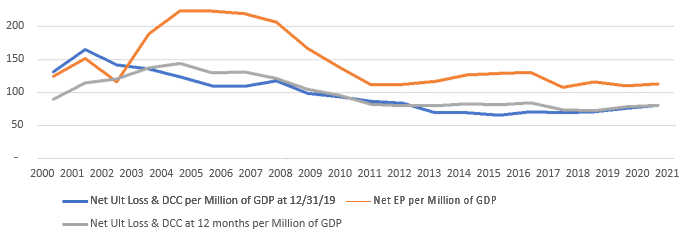
Net earned premium and ultimate loss and DCC to GDP in $ millions by accident year—P&C industry—commercial auto liability
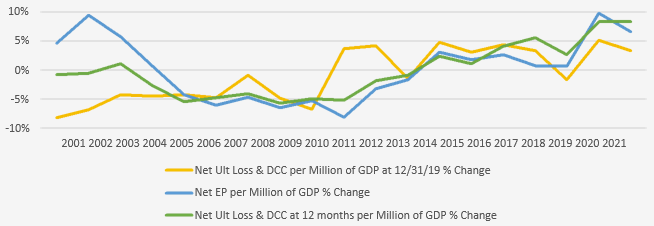
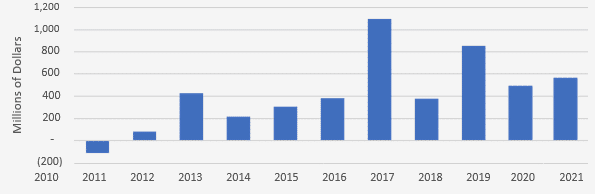
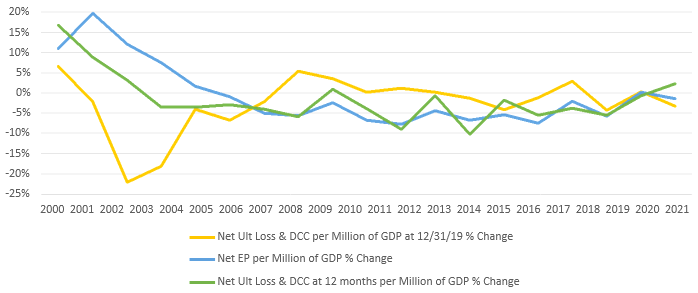
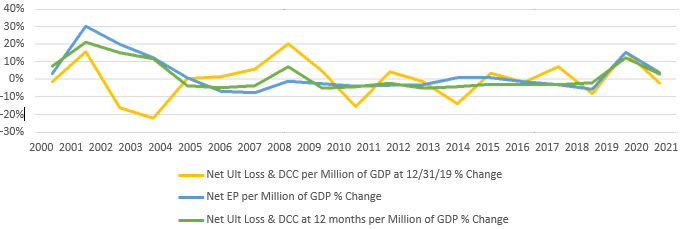
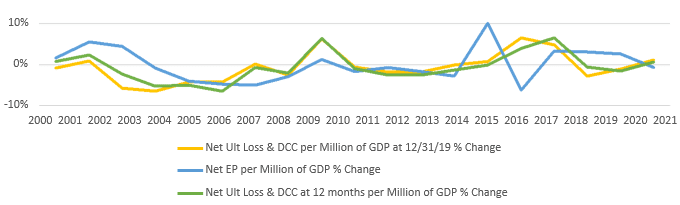
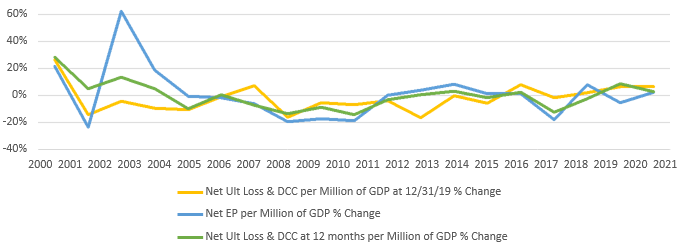
Change in net earned premium and ultimate loss and DCC to GDP in $ millions by accident year—P&C industry—commercial auto liability
Growth in ultimate losses could be a sign of social inflation. However, fast-rising costs by themselves could be caused by increases in exposures or claim frequency, instead of or in addition to rising claim severity. In the next section, we focus on analysis of accident year paid triangles—the actual amounts paid out by insurers, without any loss estimates, either by claims professionals or corporate executives. The actual payments would be subject to standard claim settlement patterns.
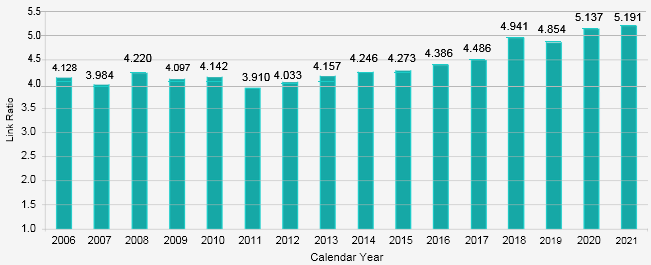
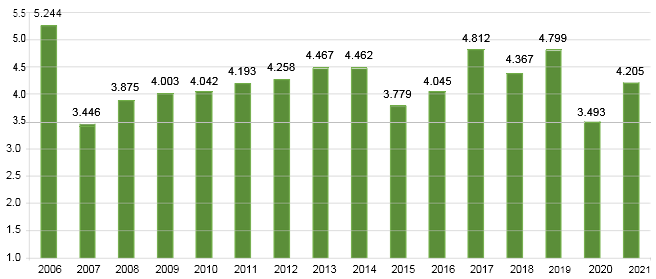
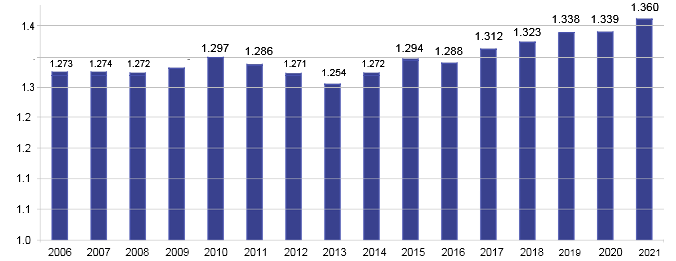
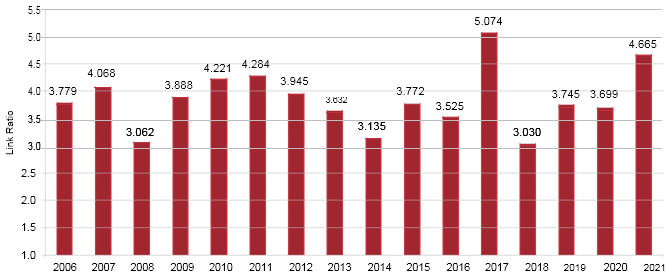
Net paid loss and DCC CYR 12–60 loss development factors—commercial auto liability
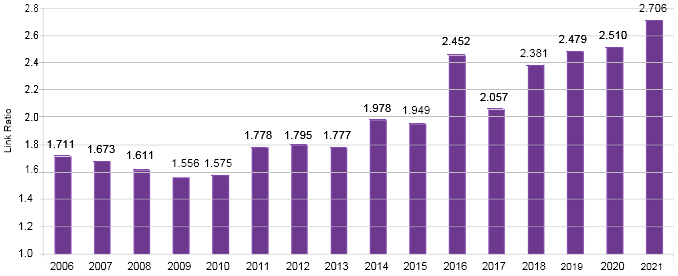
Net case incurred loss and DCC CYR 12–60 loss development factors— commercial auto liability
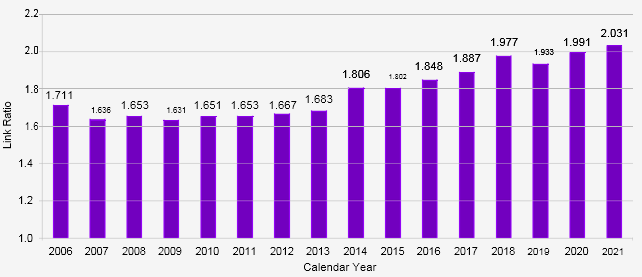
This suggests traditional actuarial methods such as the loss development method, without adjustment, would consistently underpredict ultimate losses. This, in turn, could have affected both reserving and pricing decisions.
This is consistent with the observation of increases in net earned premium per million dollars of GDP lagging increases in net ultimate losses per GDP by roughly three years
It is also consistent with unfavorable development in ultimate loss and DCC estimates, which has happened every year since 2012. The average development as a percentage of net earned premium was 4.6% over the entire period. Hence, on average, prior-year development added 4.6 percentage points to the net combined ratio over this time period.
Furthermore, the development as a percentage of net earned premium appears to be increasing.
We also note that on a percentage basis, the excess emergence on case incurred claims is greater than the excess emergence on paid claims.
This may reflect the challenge insurance personnel face in recognizing and adjusting their efforts in an inflationary environment. It suggests that actuaries consider placing greater emphasis on paid methods when they are working in such an environment, though more research may be needed to establish that.
Unexpected paid losses by year—P&C industry—commercial auto liability
Impact of social inflation by year—P&C industry—commercial auto liability
Social inflation & element of subjectivity
Because social inflation is ill defined, there is an element of subjectivity in quantifying its presence. Nevertheless, we found substantial evidence in industrywide loss triangles that three lines of business (commercial auto liability, other liability—occurrence, and medical malpractice—claims made) display characteristics consistent with what one would expect from most common discussions of social inflation—namely, that the inflation component of loss development factors has been rising.
LDFs in other lines reviewed are not definitively rising, although shortcomings in our data and methods preclude us from saying whether social inflation is affecting those lines.
We estimate that rising LDFs have increased losses in commercial auto liability by more than $20 billion, or approximately 14% of all losses in that line from 2011 to 2021.
Based upon this analysis, actuaries who believe they are encountering social inflation should take care when selecting link ratios and/or methods on which to rely.
If using the loss development method, actuaries should consider selecting link ratios from the most recent development year instead of any multiyear average or consider extrapolating link ratios. As noted previously, they should consider giving greater weight to the methods that are performing better in an actual versus expected analysis.
Other industry data sources—for example, statistical agents such as ISO or insurance companies with large market shares—have more robust loss triangles, containing direct losses and focusing on subsegments within a line of business with adjustments for limits and deductibles and other items.
Those would also have more precise data on claim counts, which would allow analysis into issues regarding claim frequency. Repeating our analysis on those would provide more specific insights. Standard actuarial trend analysis could also provide insights into how claim size has been changing over time.
Medical Professional Liability—Claims Made
Net earned premium and ultimate loss and DCC to GDP in $ millions by accident year
Change in net earned premium and ultimate loss and DCC to GDP in $ millions by accident year
Net case incurred loss and DCC CYR 12–60 loss development factors—P&C industry
Other Insurance Liability—Claims
Net earned premium and ultimate loss and DCC to GDP in $ millions by accident year
Change in net earned premium and ultimate loss and DCC to GDP in $ millions by accident year
Net case incurred loss and DCC CYR 12–60 loss development factors—P&C industry
Personal Auto Liability Insurance
Net earned premium and ultimate loss and DCC to GDP in $ millions by accident year
Change in net earned premium and ultimate loss and DCC to GDP in $ millions by accident year
Net case incurred loss and DCC CYR 12–60 loss development factors—P&C industry
Product Liability Insurance—Occurrence
Net earned premium and ultimate loss and DCC to GDP in $ millions by accident year
Change in net earned premium and ultimate loss and DCC to GDP in $ millions by accident year
Net case incurred loss and DCC CYR 12–60 loss development factors—P&C industry
Actuaries should also be sure to communicate with other stakeholders—claims and management—the nature of what they are seeing and how they are addressing it. Actuaries at larger companies should look for similar phenomena in their books of business.
Those at smaller companies, where lower volume results in greater variability in LDFs, should consider analyzing countrywide data to track the phenomenon.
While analysis appears to shed light on the phenomenon of social inflation, we recommend further research to better isolate the phenomenon.
……………………
AUTHORS: James Lynch – FCAS, MAAA – Chief Actuary, Senior Vice President of Research and Education Insurance Information Institute, Dave Moore – FCAS, CERA – President & Consulting Actuary at Moore Actuarial Consulting
Fact checked by Oleg Parashchak