Overview
US banks’ net interest margins are poised to expand, but higher-for-longer interest rates and uncertainty created by tariffs will push credit costs higher and limit earnings growth in 2025.
S&P Global Market Intelligence examined the largest US banks and thrifts by assets with a deposits-to-assets ratio of at least 25% or at least $30 bn in deposits as of quarter-end.
TOP 50 largest U.S. banks collectively saw a $128 bn drop in aggregate assets, with 28 institutions posting declines. These banks had reported a $637.3 bn increase.
The 50 largest U.S. banks held a combined $23.641 tn in assets, according to S&P Global data. Among the 39 banks with assets between $50 bn and $500 bn, 21 reported asset growth in the second quarter.
Banks’ earnings should remain healthy through the first half of the year, buoyed by continued margin expansion, steady loan growth and benign credit quality.
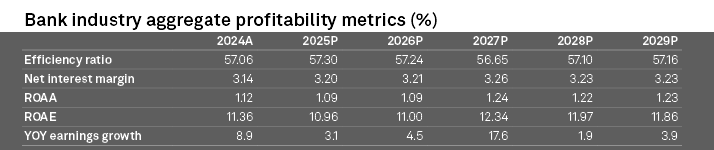
Earnings growth could prove more challenging in the second half of 2025 as the lagging impact of tariffs slows growth, weighs on the consumer and pushes delinquencies higher.
Those emerging earnings headwinds will be modest but could provide further support for stronger bank M&A activity as institutions seek ways to grow.
TOP Gainers and Losers Banks
The 4 largest U.S. banks experienced a $9.4 bn decrease in aggregate assets, or 0.1%, in the second quarter, compared to a $356.4 bn increase, or 3.1%, in the previous quarter.
- JPMorgan Chase, the largest U.S. bank by assets, was the only one among the Big Four to report a sequential increase. JPMorgan’s assets reached $4.143 tn as of June 30, up $52.28 bn, or 1.3%, from March 31.
- Bank of America’s assets declined by 0.5%, Citigroup Inc.’s by 1.1%, and Wells Fargo & Co.’s by 1.0%.
- UBS Americas Holding led with an 8.7% increase in assets.
- Old National Bancorp followed with a 7.2% increase, driven by a proactive approach to deposits for loan growth, resulting in a 5.9% annualized loan increase, excluding those from its acquisition of CapStar Financial Holdings.
- New York Community Bancorp saw a 5.5% asset growth, the third-largest in this group, despite recording its third consecutive quarterly loss due to continued credit loss provisions related to office and multifamily loans.
- HSBC North America Holdings experienced the largest sequential asset decrease of 6.8%.
- Charles Schwab posted the second-largest decline, with a 4.1% drop in total assets, as it plans to reduce the balance sheet of its bank unit, Charles Schwab Bank SSB, over the coming years to stabilize capital and liquidity levels.
TOP 50 banks by total assets, operating in US
| Rank | US Banks | Total assets, $ bn |
| 1 | JPMorgan Chase | 4 143,0 |
| 2 | Bank of America | 3 258,0 |
| 3 | Citigroup | 2 405,7 |
| 4 | Wells Fargo | 1 940,1 |
| 5 | Goldman Sachs | 1 653,3 |
| 6 | Morgan Stanley | 1 212,5 |
| 7 | U.S.Bancorp | 680,1 |
| 8 | CapitalOne Financial | 630,9 |
| 9 | PNC Financial Services | 556,5 |
| 10 | TDGroup US Holdings | 523,7 |
| 11 | Truist Financial | 519,9 |
| 12 | Charles Schwab | 449,7 |
| 13 | Bank of New York Mellon | 428,5 |
| 14 | State Street | 325,6 |
| 15 | BMO Financial | 293,5 |
| 16 | American Express | 272,2 |
| 17 | HSBC North America | 230,0 |
| 18 | Citizens Financial | 220,4 |
| 19 | First Citizens Bancshares | 219,8 |
| 20 | United Services Automobie Association | 218,1 |
| 21 | Fifth Third Bancorp | 213,3 |
| 22 | UBSAmericas Holding | 211,3 |
| 23 | M&T Bank | 208,9 |
| 24 | Huntington Bancshares | 196,3 |
| 25 | Barclays US | 196,1 |
| 26 | Ally Financial | 192,5 |
| Zl | KeyCorp | 187,5 |
| 28 | RBC US Group | 168,0 |
| 29 | Santander | 167,7 |
| 30 | Northern Trust | 156,8 |
| 31 | Regions Financial | 154,4 |
| 32 | Synchrony Financial | 120,5 |
| 33 | New York Community Bancorp | 119,1 |
| 34 | Zions Bancorp | 87,6 |
| 35 | First Horizon | 82,2 |
| 36 | Raymond James Financial | 80,6 |
| 37 | Western Alliance Bancorp | 80,6 |
| 38 | Comerica | 79,8 |
| 39 | Webster Financial | 76,8 |
| 40 | Popular | 72,9 |
| 41 | EastWest Bancorp | 72,5 |
| 42 | CIBC Bancorp USA | 70,1 |
| 43 | SouthState | 63,9 |
| 44 | UMB Financial | 63,3 |
| 45 | Valley National Bancorp | 62,1 |
| 46 | Wintrust Financial | 59,8 |
| 47 | Synovus Financial | 59,6 |
| 48 | Old National Bancorp | 53,1 |
| 49 | Columbia Banking System | 52,1 |
| 50 | BOK Financial | 50,5 |
| TOTAL | 23 641 |
According to S&P Global US Bank Outlook Survey, 39.5% of the respondents indicated that their institution was either “somewhat” or “very likely” to pursue acquiring another company over the next 12 months compared to 40.8% in the Q1.
Bank stock returns took a turn for the worse as a result of the lackluster jobs report from the Bureau of Labor Statistics that ignited recession fears among investors. This could further dampen M&A sentiment as buyers see their currencies depreciate and would-be sellers hold off for better prices.
On the brighter side, bankers remained confident on loan growth, with 75.2% of those surveyed expecting higher balances at their institution over the next 12 months, slightly down from 77.6% in the survey but up from 51.4% in the year-ago survey.
TOP 50 banks by total deposits, operating in US
| Rank | US Banks | Total deposits, $ bn |
| 1 | JPMorgan Chase | 2 396,5 |
| 2 | Bank of America | 1 910,5 |
| 3 | Wells Fargo | 1 278,1 |
| 4 | Citigroup | 1 366,0 |
| 5 | U.S.Bancorp | 431,2 |
| 6 | CapitalOne Financial | 348,9 |
| 7 | Goldman Sachs | 523,8 |
| 8 | PNC Financial Services | 460,0 |
| 9 | Truist Financial | 416,4 |
| 10 | Morgan Stanley | 312,7 |
| 11 | TDGroup US Holdings | 385,4 |
| 12 | Bank of New York Mellon | 252,4 |
| 13 | Charles Schwab | 304,4 |
| 14 | State Street | 239,2 |
| 15 | BMO Financial | 202,1 |
| 16 | Citizens Financial | 135,2 |
| 17 | Fifth Third Bancorp | 116,5 |
| 18 | M&T Bank | 176,9 |
| 19 | Huntington Bancshares | 151,1 |
| 20 | Ally Financial | 98,1 |
| 21 | First Citizens Bancshares | 166,8 |
| 22 | KeyCorp | 103,2 |
| 23 | American Express | 159,9 |
| 24 | Regions Financial | 154,6 |
| 25 | Northern Trust | 30,2 |
| 26 | HSBC North America | 152,2 |
| Zl | UBSAmericas Holding | 145,7 |
| 28 | United Services Automobie Association | 81,5 |
| 29 | Synchrony Financial | 76,9 |
| 30 | RBC US Group | 123,0 |
| 31 | New York Community Bancorp | 127,0 |
| 32 | Santander | 83,1 |
| 33 | Zions Bancorp | 79,0 |
| 34 | Western Alliance Bancorp | 74,2 |
| 35 | Popular | 64,8 |
| 36 | First Horizon | 54,4 |
| 37 | Comerica | 66,2 |
| 38 | Webster Financial | 62,7 |
| 39 | EastWest Bancorp | 62,3 |
| 40 | Raymond James Financial | 65,5 |
| 41 | SouthState | 60,1 |
| 42 | UMB Financial | 42,9 |
| 43 | Synovus Financial | 52,9 |
| 44 | Valley National Bancorp | 52,0 |
| 45 | Wintrust Financial | 50,1 |
| 46 | CIBC Bancorp USA | 48,8 |
| 47 | Columbia Banking System | 50,2 |
| 48 | Old National Bancorp | 40,0 |
| 49 | BOK Financial | 41,5 |
| 50 | Barclays US | 36,3 |
| TOTAL | 13 913 |
S&P Global calculates pro forma assets after accounting for pending M&A transactions as well as transactions that closed after quarter-end.
To be included in pro forma adjustments, the deal value must be over $1 bn or involve assets or deposits in excess of $5 bon. Loan portfolio deals are not included because of a general lack of data on both deal consideration and the impact on total assets.
Banks benefit from remixing balance sheets as time heals all wounds
Banks continue to benefit from the remixing of their balance sheets as higher-cost deposits roll off their books and are replaced with less costly forms of funding, while lower-yielding securities mature and are reinvested at higher yields.
That trend should continue this year, but the pace of improvement will slow in the coming quarters.
Deposit costs dropped substantially in the fourth quarter of 2024 and the first quarter of 2025, with the cost of deposits falling 20 basis points and 21 basis points, respectively, from the previous quarter.
We expect smaller declines in the second quarter, and early reports from JPMorgan Chase & Co. and Wells Fargo & Co. support that thesis. A key driver of deposit costs will be the maturity schedule of certificates of deposits (CDs).
Banks, particularly regional and community banks, increased their reliance on CDs for funding during the Fed’s tightening cycle.
Many CDs carry one-year terms, so institutions might not feel significant pricing relief until the maturation of CDs originated before the initial Fed rate cut in September 2024.
Loan growth
Loan growth should remain relatively weak as borrowers digest new trade policies that could change the cost of operating their businesses and households.
The true impact of tariffs arguably has not been felt yet, as businesses increased inventories ahead of the landmark announcements in early April.
The building of inventories has allowed some businesses to maintain prices at pre-tariff rates for now.
Notably, loans to nondepository financial institutions, including private credit firms that compete with banks, were by far the biggest driver of loan growth in the first quarter.
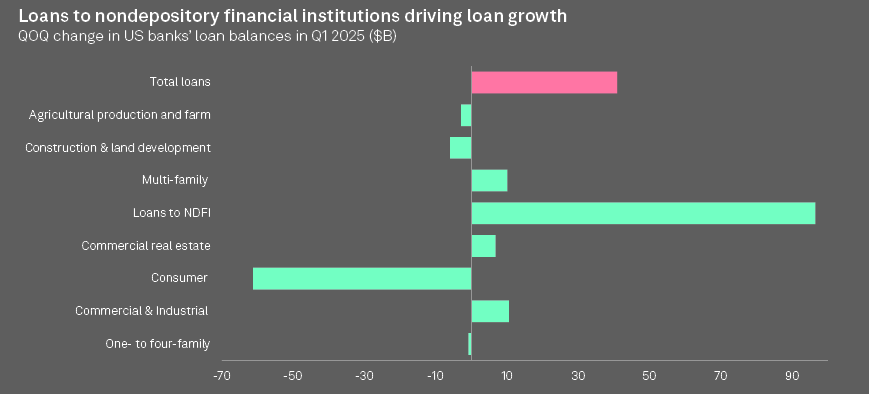
The Fed’s H.8 data captures loans to those institutions in an “other loan” bucket. Through the end of the second quarter, growth in that category remained stronger than other lending types, such as commercial and industrial, commercial real estate and consumer loans.
Credit quality just normalizing for now, but future looks murkier
Bankers maintain that their borrower base remains healthy, and the US economy has proven resilient in the face of uncertainty created by protectionist trade policies, with job gains in June exceeding economists’ forecasts. However, credit quality continues to normalize as criticized loans increase.
Criticized loans at US public banks rose again in the first quarter, with the median ratio of criticized loans to Tier 1 capital climbing to 20.04% from 18.52%.
Banks classify loans as criticized if some sign of weakness emerges, but that migration does not necessarily suggest a future loss.
Much of the weakness and concerns in the investment community have related to commercial real estate loans.
Some CRE borrowers face a double whammy of lower cash flows due to the rise of hybrid work and higher debt service stemming from increases in interest rates over the last few years.
CRE delinquencies have risen for 10 consecutive quarters, but losses have often been less than many feared, in part due to well-funded distressed investors and private credit firms targeting the asset class.
When banks have sold CRE loans — often in connection with an acquisition — sellers have recorded relatively modest discounts to par, ranging from 8% to 10%.
FAQ
S&P Global Market Intelligence examined U.S. banks and thrifts with a deposits-to-assets ratio of at least 25% or at least $30 bn in deposits as of quarter-end.
The top 50 U.S. banks collectively saw a $128 bn drop in aggregate assets, with 28 banks posting declines.
These banks held a combined $23.641 tn in assets, according to S&P Global data.
Among the Big Four, only JPMorgan Chase reported an increase, reaching $4.143 tn in assets, up 1.3% from the previous quarter.
UBS Americas Holding led with an 8.7% asset increase, while HSBC North America Holdings saw the largest decline with a 6.8% drop.
Around 39.5% of U.S. bank respondents indicated they are “somewhat” or “very likely” to pursue acquisitions in the next 12 months, slightly down from the previous quarter.
Bank stock returns fell after a weak jobs report, raising recession fears and potentially dampening M&A sentiment as currency values drop and sellers await better offers.
…………………….
AUTHORS: Gaby Villaluz, Zuhaib Gull – S&P Global Market Intelligence analysts
Fact-checked by Oleg Parashchak – Editor-in-Chief Beinsure Media, CEO Finance Media Holding