
Overview
Largest European Insurers – 2026 were ranked by gross premiums written and capital is based on global rating agency A.M. Best data and research, analized by Beinsure Media.
There were more than 9,000 insurance companies operating in Europe. In terms of domestic companies, only around 300 companies were operating inside Europe.
The European insurance industry is a significant contributor to the region’s economy, providing financial protection to individuals, businesses, and governments against various risks.
According to Insurance Europe, every year, European insurers pay out an impressive amount of over €1,000 bn in claims, which translates to approximately €2.8 bn per day. They also play a significant role in the job market, as they employ over 920,000 people.
The European insurance industry is dominated by a few large multinational companies, such as Allianz, AXA, Assicurazioni Generali, and Zurich Insurance Group, but there are also many smaller regional or niche insurers operating in the market. The largest insurance markets in Europe are Germany, the United Kingdom, France, Italy, and Switzerland.
TOP 30 European Insurance Companies by Gross Premiums Written
Ranking the largest insurance companies and groups by gross premiums written, along with their respective countries. Top 30 insurers’ premiums totaled $1.1 trillion.
| № | Insurance Company / Group | Countries | Gross Premiums, $mn |
| 1 | AXA | France | 106,147 |
| 2 | Allianz | Germany | 100,569 |
| 3 | Assicurazioni Generali | Italy | 85,169 |
| 4 | Munich Reins Co | Germany | 71,679 |
| 5 | Zurich Ins Group | Switzerland | 58,848 |
| 6 | Lloyd’s | United Kingdom | 56,334 |
| 7 | HDI | Germany | 56,053 |
| 8 | Chubb | Switzerland | 51,978 |
| 9 | Swiss Re | Switzerland | 47,889 |
| 10 | CNP Assurances | France | 38,491 |
| 11 | Crédit Agricole Assurances | France | 37,720 |
| 12 | BNP Paribas Cardif | France | 26,983 |
| 13 | MAPFRE | Spain | 26,202 |
| 14 | Société de Groupe d’Assur Mut Covéa | France | 23,511 |
| 15 | Prudential | United Kingdom | 23,344 |
| 16 | Aviva | United Kingdom | 22,819 |
| 17 | Achmea | Netherlands | 22,516 |
| 18 | SCOR SE | France | 21,068 |
| 19 | R+V Versicherung | Germany | 19,931 |
| 20 | Poste Italiane | Italy | 18,725 |
| 21 | Aéma Groupe | France | 17,223 |
| 22 | Groupama Assurances Mutuelles | France | 16,785 |
| 23 | Legal & Gen Group | United Kingdom | 16,514 |
| 24 | Sogécap | France | 15,778 |
| 25 | Swiss Life Hldg | Switzerland | 15,290 |
| 26 | BPCE Assurances | France | 14,990 |
| 27 | NN Group N.V. | Netherlands | 14,565 |
| 28 | Coöperatie VGZ U.A. | Netherlands | 14,200 |
| 29 | Groupe des Assurances du Crédit Mutuel | France | 14,182 |
| 30 | VIENNA INSURANCE GROUP | Austria | 13,410 |
| TOTAL | 1,068,913 |
This table ranks the top 30 insurersance companies/groups based on their gross premiums, providing a clear view of the market size and geographical distribution of these leading insurers.
Insurers in Europe by premiums
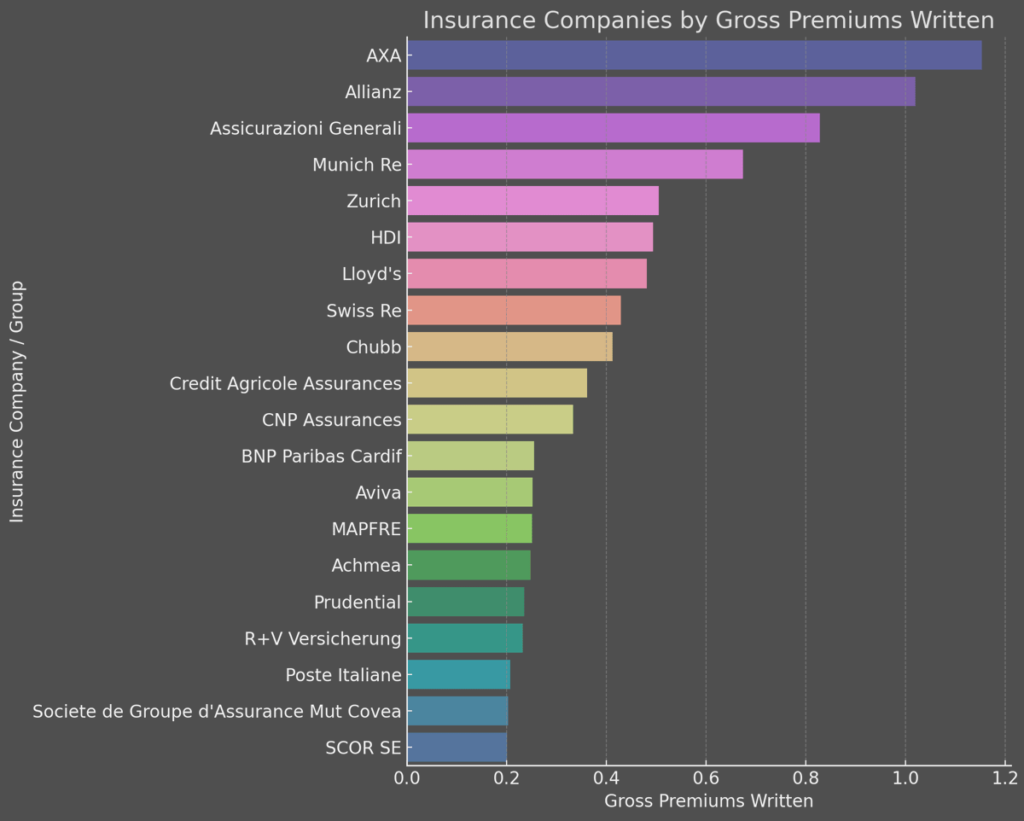
A bar chart illustrating the insurance companies by their gross premiums written. Each bar represents a different insurance company or group, with the length of the bar indicating the scale of their gross premiums.
Gross Premiums by Country
| Country | Gross Premiums ($mn) |
|---|---|
| France | 388,878 |
| Germany | 248,232 |
| Italy | 103,894 |
| Switzerland | 174,005 |
| United Kingdom | 119,011 |
| Spain | 26,202 |
| Netherlands | 51,281 |
| Austria | 13,410 |

Life insurance sectors that have significant holdings of traditional life policies supported by assets with shorter durations compared to their liabilities would benefit from rising interest rates. This is particularly true for the French and German life sectors.
At that time, Germany had the highest value of total motor claims expenditure paid on the insurance market in Europe, with claims paid amounting to about 25 bn euros.
TOP 30 European Insurance Companies by Capital
| № | Insurance Company / Group | Capital & Surplus, $ mn |
| 1 | Allianz | 54,960 |
| 2 | Chubb | 50,519 |
| 3 | Lloyd’s | 47,766 |
| 4 | AXA | 42,334 |
| 5 | Zurich Ins Group | 26,635 |
| 6 | Munich Reins Co | 22,489 |
| 7 | Société de Groupe d’Assur Mut Covéa | 19,599 |
| 8 | NN Group N.V. | 18,972 |
| 9 | CNP Assurances | 18,280 |
| 10 | Assicurazioni Generali | 17,298 |
| 11 | Prudential | 16,960 |
| 12 | Aviva | 15,180 |
| 13 | Legal & Gen Group | 14,677 |
| 14 | Swiss Re | 12,699 |
| 15 | Swiss Life Hldg | 11,007 |
| 16 | Achmea | 9,904 |
| 17 | Groupe des Assurances du Crédit Mutuel | 9,616 |
| 18 | Poste Italiane | 9,495 |
| 19 | HDI V.a.G. | 8,962 |
| 20 | Crédit Agricole Assurances | 8,653 |
| 21 | Groupama Assurances Mutuelles | 8,009 |
| 22 | MAPFRE | 7,783 |
| 23 | Aéma Groupe | 5,480 |
| 24 | SCOR SE | 5,444 |
| 25 | VIENNA INSURANCE GROUP | 4,510 |
| 26 | R+V Versicherung | 4,356 |
| 27 | BNP Paribas Cardif | 3,435 |
| 28 | Sogécap | 3,130 |
| 29 | Coöperatie VGZ U.A. | 2,620 |
| 30 | BPCE Assurances | 2,133 |
| TOTAL | 482,905 |
Insurers in Europe by capital & surplus

A bar chart showing the insurance companies ranked by capital & surplus. Each bar represents a different insurance company or group, with the length of the bar indicating the size of their capital & surplus.
This chart offers a visual comparison of the financial strength and stability of these insurance companies as indicated by their capital and surplus amounts.
Insurance companies in Europe are increasingly using digital technologies such as artificial intelligence (AI), blockchain, and the Internet of Things (IoT) to improve their products, services, and operations.
The European insurance industry is focused on integrating ESG factors into its operations and investment decisions aimed towards expansion.
Home to one of the world’s leading insurance markets, Europe’s motor insurance industry is also quite extensive. Total motor premiums written on the European insurance market amounted to a value of over 100 bn euros.
TOP 30 Insurers in Europe by profit
| № | Insurance Company / Group | Profit / Loss after tax, $ bn |
| 1 | Allianz | 7.668 |
| 2 | AXA | 7.320 |
| 3 | Chubb | 5.246 |
| 4 | Zurich Ins Group | 4.923 |
| 5 | Munich Reins | 3.651 |
| 6 | Assicurazioni Generali | 3.405 |
| 7 | Legal & Gen Group | 2.762 |
| 8 | HDI | 2.671 |
| 9 | CNP Assurances | 2.415 |
| 10 | Crédit Agricole Assurances | 1.878 |
| 11 | NN Group N.V. | 1.672 |
| 12 | Poste Italiane | 1.613 |
| 13 | Swiss Life Hldg | 1.576 |
| 14 | Aviva | -1.374 |
| 15 | MAPFRE | 1.157 |
| 16 | Lloyd’s | -0.928 |
| 17 | Groupe des Assurances du Crédit Mutuel | 0.900 |
| 18 | Société de Groupe d’Assur Mut Covéa | 0.719 |
| 19 | BNP Paribas Cardif | 0.713 |
| 20 | Sogécap | 0.628 |
| 21 | VIENNA INSURANCE GROUP | 0.496 |
| 22 | Groupama Assurances Mutuelles | 0.485 |
| 23 | Swiss Re | 0.480 |
| 24 | BPCE Assurances | 0.344 |
| 25 | SCOR SE | -0.322 |
| 26 | R+V Versicherung AG | -0.263 |
| 27 | Coöperatie VGZ U.A. | -0.209 |
| 28 | Achmea B.V. | 0.112 |
| 29 | Aéma Groupe | 0.055 |
| 30 | Prudential | -0.011 |
This table ranks the top 30 insurance companies/groups based on their profit or loss after tax, providing a clear view of the financial performance of these leading insurers in 2026.
TOP 20 Insurers in Europe by profit

According to Fitch, the non-life insurance sectors would be most vulnerable to the effects of high inflation, especially those with a significant portion of the long-tail business. The rising claims inflation could result in reserve shortfalls.
Additionally, in markets where there is an intense competition or societal pressure that restricts insurers’ ability to increase prices, high inflation could lead to margin constraints for short-tail businesses.
Total number of companies on the European insurance market
Market penetration refers to the ratio of insurance premiums to GDP. Penetration on the European domestic insurance market generally increased between 2005 and 2023 albeit with some fluctuation. The ratio is used as an indicator of insurance sector development, and it peaked at 9.5% after 6 years of annual growth. The premiums ratio to GDP on the European market fell to 6.8%.
Total premiums to GDP ratio as insurance penetration measure on the domestic market in Europe

According to the European Insurance and occupational Pensions Authority (EIOPA) “Insurance undertakings are required by the Solvency II regulation to hold a certain amount of capital of sufficient quality in addition to the assets they hold to cover the contractual obligations towards policyholders.
The amount of capital (called eligible own funds) required is defined by the Minimum Capital Requirement (MCR) and the Solvency Capital Requirement (SCR), which depend on the risks to which the undertaking is exposed.”
Solvency Capital Requirement (SCR) ratio of insurance markets in Europe

The German insurance industry had Solvency Capital Requirement (SCR) ratio of three. The United Kingdom (UK), which was the largest insurance market in Europe, had a SCR ratio of around half of that of the German insurance sector. In addition to the SCR ratio, insurers must also calculate minimum capital requirement (MCR).
The MRC is essentially a tipping point in which, if an insurer falls below, the authorization of an insurer could be withdrawn.
The combined ratio, which is the sum of claims and expenses incurred divided by premiums earned, is a measure of profitability used by insurance companies to see how efficiently they are running their business. The combined ratio can be displayed as a measure of 1 or as a percentage of 100.
Insurance markets with a ratio of over 1 means that companies are paying out more in claims than they are receiving through premiums earned. The expense ratio is another measure of profitability and is calculated as the sum of expenses divided by premiums earned.
FAQ
The ranking of the largest European insurers in 2026 is based on gross premiums written, using data from A.M. Best, as analyzed by Beinsure Media.
Europe has over 9,000 insurance companies, with only around 300 operating domestically within European borders.
The European insurance industry is a key economic contributor, offering financial protection across various sectors and employing over 920,000 people. European insurers pay out more than €1,000 bn annually in claims, roughly €3 bn per day.
The European insurance market is led by large multinational insurers such as Allianz, AXA, Assicurazioni Generali, and Zurich Insurance Group, alongside many regional and niche insurers.
The largest insurance markets in Europe by premium volume are Germany, the United Kingdom, France, Italy, and Switzerland.
European insurers increasingly adopt technologies like AI, blockchain, and IoT to enhance their products, services, and operational efficiency.
The Solvency Capital Requirement (SCR) is the capital level insurers must hold to meet obligations to policyholders, defined by Solvency II regulation. This requirement varies by market, with Germany showing a higher SCR ratio than the UK.
………………..
Edited & Fact-checked by Oleg Parashchak – CEO Finance Media & Editor-in-Chief at Beinsure Media and Insurance TOP Ratings (25+ years of professional experience in Rankings, Insurance & Media) by AM Best Data.