Overview
- U.S. home insurance trends reviews
- US home insurers face growing pressure from rising severity
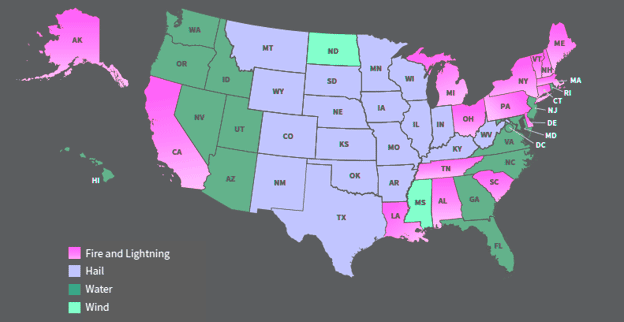
- Highest loss cost peril in each state
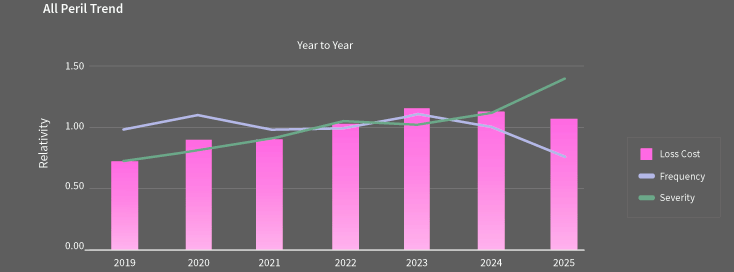
- All-Peril Severity by Year
- Fire and Lightning became the defining peril category
- Weather-related peril trends
- Non-weather perils and insurer response
- Insurance liability followed the same lower-frequency, higher-severity pattern
In 2025, 23 weather and climate disasters struck the U.S., costing $115 bn in damages. One event, the Los Angeles wildfires, was the costliest wildfire ever recorded in the U.S., with costs estimated at more than $61 bn.
All Peril severity reached a record high in 2025. It rose 25.9% from 2024 and 93.2% compared with 2019. All Peril loss cost fell 4.4% from 2024 to 2025, and frequency dropped 23.8%.
As climate change lengthens extreme weather seasons and expands at-risk areas, homeowners and insurers face increasing exposure. To prepare, home insurance carriers should understand long-term trends by peril.
Even after the decline, loss cost still ranked as the third highest in seven years and stood 50% above its 2019 level, according to LexisNexis Risk Solutions.
Key highlights
- All Peril severity in 2025, up 25.9% from 2024 and 93.2% from 2019. Lower claim frequency didn’t offset the size of losses.
- All Peril loss cost fell 4.4% year over year, and frequency dropped 23.8%. Still, loss cost ranked as the third highest in seven years and stayed 50% above 2019.
- The US recorded 23 climate disasters with at least $1 bn in damages in 2025. Total losses reached $115 bn, with the Los Angeles wildfires alone accounting for $61.2 bn.
- Fire and Lightning drove the sharpest pressure on home insurers. Loss cost rose 76.8%, severity increased 67.3%, and frequency climbed 6% from 2024.
- Non-weather claims showed the same insurer problem: fewer claims, larger payouts. Water loss frequency fell, but severity rose 63.16% between 2019 and 2025, while Liability severity increased 12.8% year over year.
U.S. home insurance trends reviews

The U.S. Home Trends Report reviews loss cost, claims frequency and severity, with state-level detail on seasonality, catastrophe claims and geographic loss patterns.
For carriers, the data points to a harder underwriting problem: fewer claims in some areas, larger losses when claims occur, and weather events that aren’t following old assumptions.
The US recorded 23 climate disasters with at least $1 bn in damages during 2025, according to the report. Those events produced $115 bn in total damages, making 2025 the third highest year on record for $1 bn climate events.
The Los Angeles wildfires represented more than half of the total, at $61.2 bn, showing how one catastrophe shifts annual loss trends across an entire insurance line.
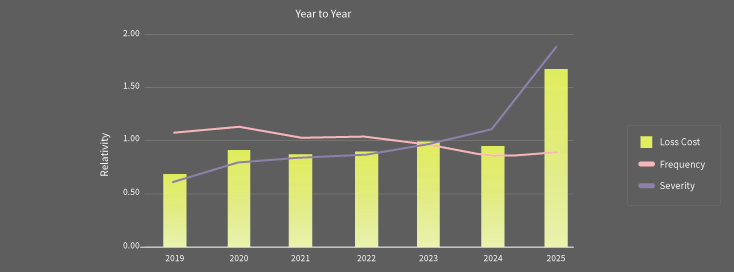
Fire and Lightning shaped the year. Loss cost for the peril rose 76.8% from 2024, and severity increased 67.3%. LexisNexis linked most of the increase to the January 2025 Los Angeles wildfires.
Insurers have paid more than $22.4 bn on wildfire claims tied to the LA wildfires that erupted on Jan. 7 last year, according to figures released by the California Department of Insurance.
The data shows 42,121 claims filed, with 94% fully or partially paid. Of those, 39,677 claims received advance partial payments under state rules designed to speed recovery.
January’s Los Angeles fires did most of the work. Add in severe convective storms across the US, and insured catastrophe losses in 2025 are set to push past $100 bn for the sixth year in a row, according to the Swiss Re Institute.
The fires forced a reckoning. Several insurers moved to restrict or stop writing homeowners cover in high-risk areas. Regulators responded.
California’s insurance department rolled out rule changes aimed at accelerating rate approvals and allowing broader use of catastrophe models, hoping carriers might reconsider their retreat.
US home insurers face growing pressure from rising severity

US home insurers face growing pressure from rising severity, inflation-driven replacement costs and climate-driven catastrophe patterns.
The data strengthens the case for carriers to use multi-source datasets and analytics when assessing risk, benchmarking performance and adjusting to volatile market conditions.
The All Peril trend still points upward over the long run. The home insurance industry saw lower loss cost in 2025, yet the year still ranked among the most expensive periods for loss cost across the past seven years.
Highest loss cost peril in each state
US private flood insurance market is expanding, addressing the nation’s substantial gap between economic and insured losses from flood events. In the US, flood insurance historically had low participation, with most policies purchased to meet mortgage requirements in high-risk areas, predominantly through the National Flood Insurance Program (NFIP).
Growth in the private flood insurance market has been driven by improved technology and analytics, changes in federal flood insurance policies, and new legislative measures, according to Fitch Rating.
The US private flood insurance market is gaining traction in 2025 as flood-related economic losses continue to far outpace insured losses.
Traditional reliance on FEMA’s NFIP has left many homeowners vulnerable, given that standard home policies exclude flood damage, Beinsure noted.
Recent improvements in flood risk analytics, mapping, and technology – combined with federal policy adjustments – have fueled private.
This growth assists homeowners who previously lacked adequate coverage despite living in risky areas. Insurance Information Institute data show that only around 20% of at-risk homes hold flood insurance, and a significant proportion of flood claims come from outside officially designated high-risk zones.
Severity moved in the opposite direction
It climbed to the highest level in the seven-year study period and rose 93.2% from 2019. That increase offset lower claims frequency, which has followed a broad downward trend since the start of the COVID-19 pandemic.
The full report examines how loss cost and seasonality shifts created volatility across state markets, including California’s position as the highest loss-cost state in 2025 and the effect of wind and hail activity across several central US states.
All-Peril Severity by Year
Though natural disasters cycle across seasons and regions in the U.S., it’s often a shocking discovery for property owners how expansive and expensive flood and water damage can be when a major storm devastates their homes, businesses and communities.
All peril and catastrophe trends
| Metric | 2025 | Comparison |
|---|---|---|
| All Peril severity | Record high | Up 25.9% from 2024 |
| All Peril severity vs. 2019 | 93.2% higher | Highest level in seven years |
| All Peril loss cost | Down 4.4% | Still third highest in seven years |
| All Peril frequency | Down 23.8% | Continued post-COVID downward trend |
| All Peril loss cost vs. 2019 | 50% higher | Shows long-term cost pressure |
| $1 bn climate disasters | 23 events | Third highest year on record |
| Total climate disaster damages | $115 bn | 2025 total |
| Los Angeles wildfires | $61.2 bn | More than half of 2025 climate disaster damages |
Among U.S. hurricanes since 2015, Hurricane Ian (2022) and Hurricane Harvey (2017) stand out for total economic destruction. Ian caused about $112 bn in overall losses, fueled by catastrophic storm surge, destroyed coastal towns, and widespread infrastructure damage across Florida, Beinsure noted.
- Hurricane Ian (2022) and Helene (2024) both exceeded $110 bn in economic losses, showing that $100 bn events are no longer rare outliers but recurring benchmarks.
- Harvey (2017) caused more than $80 bn in economic damage but only $19 bn was insured, underscoring the persistent underinsurance of flood risk in the U.S.
- Ian (2022) generated $42-63 bn in insured losses, destabilizing Florida’s property insurance system and forcing several carriers into insolvency.
Fire and Lightning became the defining peril category
Loss cost rose 76.8%, frequency increased 6.0%, and severity climbed 67.3% from 2024. The January 2025 Los Angeles wildfires, including the Palisades and Eaton fires, drove much of the increase.
Those fires caused an estimated $61.2 bn in losses. LexisNexis described them as the highest-cost US climate disaster of 2025 and the costliest recorded wildfire in US history. The timing of the fires also changed Fire and Lightning seasonality patterns, a point the full report examines in more detail.
Fire and Lightning
Over $1.2 bn in lightning-related homeowners insurance claims were paid to more than 70,000 policyholders in the U.S., with $194 mn attributed to Texas alone, according to the Triple-I.
$950 mn in lightning-caused U.S. homeowners insurance claims were paid out to 62,000-plus policyholders, with $125 mn of the total attributable to California alone
- The total value of lightning-related claims increased by over 30% in 2024, reaching $1.27 bn from $950 mn in 2023.
- The number of claims rose by 13.8%, from 62,189 in 2022 to 70,787 in 2024, with the top 19 states accounting for 57% of the total.
- The average cost per claim grew by 14.6%, from $15,280 in 2022 to $17,513 in 2024.
Wind losses moved lower
Wind loss cost fell 50.4% from 2024 to 2025, severity declined 12%, and frequency dropped 43.9%. LexisNexis said the declines likely came from fewer catastrophe Wind claims in 2025.
Wind risk still created large losses. A central tornado outbreak in mid-March became the second costliest $1 bn weather event of the year, with estimated damages of $11 bn.
Hail also eased after a recent peak
Hail loss cost declined 38.4% in 2025 from its seven-year high in 2023, and frequency fell 35.4% from 2023. Severity stayed flat compared with 2024. The full report adds more detail on catastrophe claims, $1 bn hail events and the central US states hit hardest by severe convective weather.
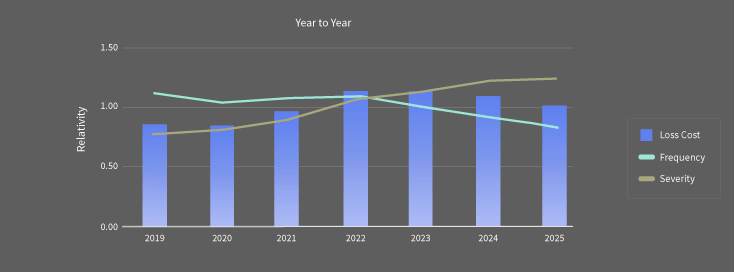
Non-weather water claims moved in a different direction. Non-Weather-Related Water loss cost decreased 6.4% from 2024 to 2025, and frequency fell 7.8%. Severity still rose 2.5%.
Severity for Non-Weather-Related Water increased 63.16% between 2019 and 2025. LexisNexis linked the rise to inflation and higher material and labor costs tied to water damage remediation.
Weather-related peril trends
| Peril | Loss cost | Frequency | Severity | Main driver |
|---|---|---|---|---|
| Fire and Lightning | Up 76.8% YoY | Up 6.0% YoY | Up 67.3% YoY | January 2025 Los Angeles wildfires |
| Wind | Down 50.4% YoY | Down 43.9% YoY | Down 12% YoY | Fewer catastrophe Wind claims |
| Hail | Down 38.4% from 2023 peak | Down 35.4% from 2023 | Flat vs. 2024 | Lower activity after seven-year high |
| Central tornado outbreak | $11 bn in damages | N/A | N/A | Second costliest $1 bn weather event of 2025 |
| Palisades and Eaton fires | $61.2 bn in damages | N/A | N/A | Costliest recorded wildfire in US history |
Non-weather perils and insurer response
| area | 2025 result | longer-term signal | underwriting use |
|---|---|---|---|
| Non-Weather-Related Water | Loss cost down 6.4%, frequency down 7.8%, severity up 2.5% | Severity up 63.2% from 2019 to 2025 | Review interior risk traits and repair-cost exposure |
| Liability | Loss cost down 4%, frequency down 14.6%, severity up 12.8% | Possible social inflation signal | Reassess litigation-sensitive segments |
| Theft and Other Perils | Lower frequency with higher severity | Loss mix keeps shifting | Compare peril trends by state and property profile |
| Wildfire exposure | Expanding into new areas | Property-level detail matters more | Assess fortification, condition and local exposure |
| Carrier strategy | National and state trends give the base view | Granular property data improves risk selection | Use analytics for underwriting, pricing and portfolio decisions |
Non-Weather Related Water Severity by Year
Insurance liability followed the same lower-frequency, higher-severity pattern
Liability loss cost decreased 4% from 2024 to 2025, and frequency declined 14.6%. Severity rose 12.8% year over year. The report said this trend offers anecdotal evidence of social inflation, where liability claims costs rise faster than general economic inflation because litigation costs increase.
The report also covers Theft and Other Perils. Across non-weather claims, falling frequency and rising severity continue to reshape loss trends.
Broad loss trends only provide the starting point for insurers. The stronger use case sits at the individual-property level, where carriers study wildfire exposure, home condition, fortification measures and interior risk characteristics.
If wildfire risk expands into new areas, property-level data gives underwriters a more precise way to assess exposure. If a state shows distinct water-loss patterns, interior risk details matter.
According to analysts, linking national, state and peril-level trends with granular property intelligence helps carriers make better underwriting, pricing and portfolio decisions.
What was the main trend in US home insurance claims in 2025?
Severity reached a record high. Claims happened less often in several categories, but insurers paid more when losses occurred. According to LexisNexis, this pattern creates pressure for underwriting, pricing and portfolio management.
Why did Fire and Lightning losses increase so much?
The January 2025 Los Angeles wildfires drove much of the increase. Fire and Lightning loss cost rose 76.8% from 2024, while severity increased 67.3%.
How large were US climate disaster losses in 2025?
The US recorded 23 climate disasters with damages of at least $1 bn each. Total damages reached $115 bn, the third highest annual total for $1 bn climate events on record.
What made the Los Angeles wildfires so important for insurers?
The fires caused an estimated $61.2 bn in losses. LexisNexis described them as the highest-cost US climate disaster of 2025 and the costliest recorded wildfire in US history.
Did Wind and Hail losses rise in 2025?
No. Wind loss cost fell 50.4% from 2024, and frequency dropped 43.9%. Hail loss cost decreased 38.4% from its seven-year high in 2023, with severity flat against 2024.
What does the report mean for home insurers?
The report points to a need for more granular property data. Insurers need to connect national, state and peril-level trends with property condition, wildfire exposure, fortification details and interior risk characteristics.
………………..
AUTHOR: Yana Keller – Insurance Editor at Beinsure Media