Overview
The US insurance sector continues to show stable fundamentals, supported by strong capital buffers, steady operating performance, healthy liquidity, and tighter underwriting discipline.
Balance sheets remain well supported. Performance trends hold broadly stable. Liquidity remains comfortable across most major carriers.
These factors continue to anchor ratings, even as liability dynamics grow more complex, according to analysts at Fitch Ratings.
Key Highlights
- US insurers maintain strong capital buffers, liquidity and underwriting discipline, supporting stable ratings despite rising liability complexity.
- P&C returns are expected to peak in 2025 as premium growth slows and combined ratios normalize into 2026.
- Social inflation and legal severity are viewed as structural risks, with 83% of market participants expecting elevated volatility to persist.
- Florida reforms demonstrate how tort changes can reduce litigation, improve reserves and restore private market capacity.
- Life insurers remain resilient with double-digit ROE and strong RBC ratios, while alternative capital reshapes reinsurance dynamics.
US Property and Casualty Insurance Lines
Property and casualty insurance lines reflect that tension. Tort reform in several states has brought stability, yet social inflation keeps pushing liability claim costs above general economic inflation. US P&C insurance returns peak in 2025 as growth slows into 2026.
Third-party litigation funding injects additional capital into plaintiff strategies. The combined effect drives higher severity and increased volatility.
When surveyed at the conference, 83% of participants said elevated legal severity and volatility now represent a structural feature of the insurance market. Only 17% described it as temporary.
According to Beinsure analysts, the consensus points toward recalibrated pricing and reserving assumptions rather than expectations of reversal.
Florida illustrates how reform can shift trajectory
After Hurricane Irma in 2017, Florida’s insurance market entered a prolonged hard cycle. Fraud and litigation abuse amplified losses, rates climbed sharply, and capacity tightened. Insurers faced rising reserve strain and volatile results.
Reforms enacted in 2023 altered that path. Lost cost trends moderated. Reserve risk declined. Risk-based capital ratios improved. The market steadied.
Citizens Property Insurance Corporation, Florida’s state-backed carrier, reported its first average personal lines rate decrease since 2015. More than 1 mn policies shifted from Citizens to private insurers over two years, signalling renewed private market confidence.
17 new companies have entered the market, and four Florida-based insurers launched IPOs last year.
Litigation activity also moved lower
Personal insurance lawsuits in Florida fell 26% year over year, following a 23% decline in 2024. According to our data, declining litigation frequency reduces reserve uncertainty and strengthens capital buffers over time.
Fitch’s message balances confidence with caution. Capital remains strong. Liquidity supports ratings. Underwriting discipline holds. At the same time, liability exposure shaped by social inflation and legal volatility continues to test pricing accuracy and reserve adequacy across US property and casualty markets.
North American P&C Insurance Sector Outlook

The P&C insurance industry outlook for 2026 suggests that the industry is transitioning from peak hard-market conditions toward a more normalized operating environment.
Net written premium growth is strong in 2024 at 8.8%, reflecting the benefit of prior rate increases and firm market conditions. However, growth slows considerably in 2025 to 3.9% and stabilizes at 4% in 2026.
This moderation indicates that pricing momentum is easing and that top-line expansion will rely less on aggressive rate actions and more on exposure growth and retention (see Property & Casualty Insurance Companies in the U.S.).
P&C Insurance Industry Forecast
| Metric | 2024 | 2025 | 2026 |
| Net Written Premium Growth (%) | 8.8 | 3.9 | 4.0 |
| Combined Ratio (%) | 96.6 | 93.7 | 96.5 |
| Return on Surplus (%) | 8.7 | 10.1 | 9.1 |
- Growth is strong in 2024 (8.8%), reflecting continued hard-market pricing momentum.
- Growth moderates significantly in 2025 (3.9%) and stabilizes in 2026 (4%).
- This suggests a transition from rapid rate-driven expansion toward a more normalized growth environment.
- Slowing premium growth may reflect easing rate increases, competitive pressures, or macroeconomic moderation.
The view rests on expectations that strong statutory performance in 2025 carries forward, helped by a quiet hurricane season, unusually large favorable reserve development, and robust personal auto results.
Those tailwinds did a lot of the work. The U.S. P&C insurance sector is projected to remain profitable through 2026, driven by strong performance in private auto underwriting.
Underwriting performance improves meaningfully in 2025, with the combined ratio declining to 93.7% from 96.6% in 2024.
This suggests that earned rate increases are catching up with elevated loss trends, resulting in stronger underwriting margins.
P&C insurance sector outlook and performance snapshot
| Category | 2025 | 2026 |
| Sector outlook | Strong statutory performance | Neutral |
| Industry combined ratio | 94% | 96-97% |
| Reserve releases | $18 bn | Lower, normalised |
| Return on surplus | 10.1% | 9.1% |
| Capital position | Resilient | Stable, sufficient |
| Pricing trend | Firm, moderating | Adequate, softening |
According to Beinsure analysts, by 2026, the combined ratio rises again to 96.5%, implying some normalization of results, potentially due to catastrophe volatility, competitive pressures, or persistent claims severity trends.
Return on surplus follows a similar pattern, improving from 8.7% in 2024 to 10.1% in 2025 before moderating to 9.1% in 2026. Overall, the forecast points to peak profitability in 2025 followed by stabilization rather than continued expansion.
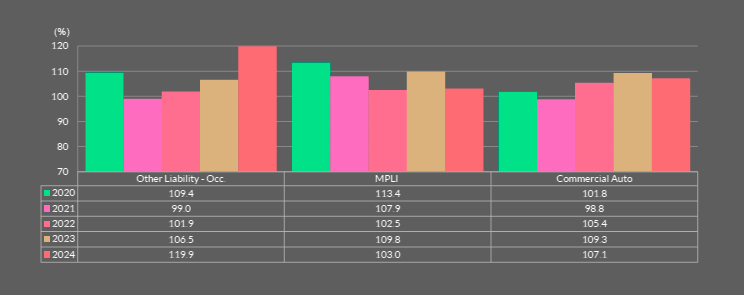
Calendar Year Combined Ratios by Segment
- Improves meaningfully in 2025 (93.7%) compared to 2024 (96.6%), indicating stronger underwriting profitability.
- Slight deterioration expected in 2026 (96.5%), though still near breakeven underwriting levels.
- The 2025 improvement likely reflects earned rate adequacy catching up to prior loss trends.
- The 2026 uptick could signal normalization of catastrophe losses or claims cost pressures.
Other Insurance Liability – Occurrence
The segment-level combined ratio data from 2020 through 2024 reveals more pronounced volatility and structural challenges. Other Liability – Occurrence shows the most significant deterioration.
| Year | Combined Ratio (%) |
| 2020 | 109.4 |
| 2021 | 99.0 |
| 2022 | 101.9 |
| 2023 | 106.5 |
| 2024 | 119.9 |
- Improved significantly in 2021 (99%), briefly returning to underwriting profitability.
- Deteriorated steadily through 2023 (106.5%).
- Sharp spike in 2024 (119.9%), indicating severe underwriting losses.
After briefly achieving underwriting profitability in 2021 with a combined ratio of 99.0%, results worsened steadily and surged to 119.9% in 2024.
According to Beinsure, this sharp increase indicates substantial underwriting losses and suggests the impact of social inflation, large verdicts, and possible reserve strengthening.
The 2024 result is particularly concerning and signals significant pricing or loss trend misalignment in this segment.
Medical Professional Liability (MPLI) Market
Medical Professional Liability exhibits a cyclical pattern. The combined ratio was elevated at 113.4% in 2020 but improved steadily through 2022 before deteriorating again in 2023 and then recovering somewhat in 2024 to 103%.
| Year | Combined Ratio (%) |
| 2020 | 113.4 |
| 2021 | 107.9 |
| 2022 | 102.5 |
| 2023 | 109.8 |
| 2024 | 103.0 |
- Very high ratio in 2020 (113.4%), indicating weak profitability.
- Gradual improvement through 2022 (102.5%).
- Deterioration again in 2023 (109.8%).
- Improvement in 2024 (103%).
Although still slightly above breakeven, the 2024 improvement suggests that corrective pricing and underwriting measures may be gaining traction.
Compared to Other Liability, MPLI appears more stable, though margins remain thin.
Commercial Auto Insurance Market
Commercial Auto demonstrates persistent structural pressure. While profitable in 2021 with a 98.8% combined ratio, results deteriorated significantly in 2022 and 2023, peaking at 109.3%, and improved only modestly to 107.1% in 2024, Beinsure noted.
| Year | Combined Ratio (%) |
| 2020 | 101.8 |
| 2021 | 98.8 |
| 2022 | 105.4 |
| 2023 | 109.3 |
| 2024 | 107.1 |
- Profitable in 2021 (98.8%).
- Deteriorated sharply in 2022-2023, peaking at 109.3% (2023).
- Slight improvement in 2024 (107.1%), but still loss-making.
Ongoing loss severity, inflation in repair and medical costs, and litigation trends continue to weigh on performance. Despite rate increases, underwriting profitability has not fully recovered, indicating that this line remains challenged.
Taken together, the industry-level forecast suggests improving profitability in the near term, particularly in 2025, but the segment data highlights underlying volatility and structural pressures in key lines.
Sustained profitability will depend on maintaining rate adequacy, managing severity trends, and exercising disciplined underwriting as the market environment gradually stabilizes.
US Life Insurance Market Forcast

Life insurers operate in a more complex macro backdrop. Declining policy rates, slower economic growth, macro volatility, and geopolitical risk create pressure. Still, strong capital positions, disciplined asset-liability management, and liquidity buffers provide resilience.
Funding agreement-backed note issuance reached a record in 2025, totaling nearly $80 bn, with seven new programs launched. Market participants expect momentum to continue.
According to analysts, only 2% of respondents forecast 2026 issuance below $60 bn. 7% expect $60 bn to $70 bn. 22% project $70 bn to $80 bn. 39% anticipate $80 bn to $90 bn. 31%expect issuance to exceed $90 bn.
Life insurers’ investment portfolio mix should remain broadly stable, with solid credit quality and core fixed income dominant amid a continued tilt toward private credit and alternative investments, driven by opportunistic repositioning and regulatory reclassifications, according to Fitch Ratings’ outlook.
The persistent search for yield will continue to drive expansion in private credit across multiple asset classes in 2026, often leveraging the origination platforms of affiliated alternative investment managers.
North American Life Insurance Sector Outlook
| Metric | 2024 | 2025 | 2026 |
| Return on Equity (%) | 13.8 | 13.5 | 13.0 |
| NAIC RBC (%) | 439 | 440 | 435 |
The projected return on equity remains strong across the forecast period, beginning at 13.8% in 2024 and moderating slightly to 13.5% in 2025 and 13% in 2026.
Although there is a gradual decline, returns remain at healthy double-digit levels, indicating that insurers are expected to maintain solid profitability even as underwriting conditions normalize.
The slight easing in ROE aligns with the broader forecast of moderating premium growth and a small uptick in the combined ratio after 2025, suggesting peak earnings momentum occurs around 2024-2025 before stabilizing, according to Beinsure.
NAIC Risk-Based Capital (RBC) ratios remain very strong and stable throughout the period, hovering around 435-440%.
These levels indicate substantial capital buffers well above regulatory minimum requirements, reflecting a well-capitalized industry. The stability of RBC ratios suggests that capital adequacy is not expected to be strained despite underwriting volatility in certain segments.
The minor dip projected in 2026 likely reflects normalization of earnings or capital deployment rather than financial stress.
Overall, the data portrays an industry with strong capital resilience and sustained profitability. While returns are expected to moderate slightly, capital strength remains robust, providing flexibility for growth, shareholder returns, and resilience against potential underwriting or catastrophe volatility.
Alternative asset managers continue expanding their footprint in insurance
Alternative capital is a primary driver of capital for the cat bond market, which has tripled over the past 10 years as the increasingly mainstream market has over 100 different sponsors.
When polled about what amount of global alternative capital will be deployed in reinsurance in three years, 24% of respondents projected $125 bn-$150 bn, 31% projected $150 bn-$180 bn, and 45% projected over $180 bn.
Private equity/asset managers also use sidecars to invest in higher-risk assets, including private credit for diversification.
Nearly every major Alt AM now operates an insurance platform or partnership, often through acquisitions, minority stakes, sidecars, or reinsurance vehicles.
Reinsurers have record capital with limited deployment options
They can grow business lines, return capital to shareholders via buybacks, or pursue M&A.
The panel noted that market conditions make excess capital harder to deploy, with competition shifting growth strategies from volume-based expansion to selective value-focused growth combined with capital management.
While interest in M&A exists, with more activity from private equity-backed companies, a gap between bid and ask persists as sellers are reluctant given strong relative returns.
Fitch views these arrangements as broadly neutral to ratings, though they increase investment complexity and require tighter governance to manage conflicts. Exposure to less liquid assets and spread-based products continues to rise.
Fitch’s assessment points to a sector that remains capitalized and liquid, even as liability pressures and shifting investment strategies reshape risk profiles across U.S. insurers.
FAQ
The sector benefits from strong capital buffers, solid liquidity and disciplined underwriting. Balance sheets remain well supported, and performance trends are broadly stable. Rating agencies highlight that these fundamentals continue to anchor credit profiles despite growing liability pressures.
Social inflation, rising litigation costs, expanding jury awards and third-party litigation funding are increasing claim severity and volatility. Most market participants now view elevated legal risk as structural rather than temporary, requiring recalibrated pricing and reserving assumptions.
Returns are projected to peak in 2025, supported by strong statutory performance, reserve releases and solid personal auto underwriting results. Growth moderates into 2026 as pricing momentum slows and combined ratios normalize.
The industry combined ratio improves meaningfully in 2025 to around 94%, reflecting stronger underwriting profitability. In 2026, it is expected to rise toward 96–97%, signaling normalization amid catastrophe exposure and persistent severity pressures.
Florida demonstrates how tort reform can shift market dynamics. Litigation frequency declined, reserve risk eased, capital strengthened and private insurers re-entered the market. Rate decreases and new company formation indicate restored confidence and improved stability.
Life insurers maintain strong profitability, with return on equity remaining above 13% through 2026. NAIC RBC ratios around 435–440% reflect substantial capital buffers, supporting resilience despite macroeconomic volatility and interest rate shifts.
Alternative asset managers and private equity firms continue expanding into insurance and reinsurance, particularly through cat bonds and sidecars. While this increases investment complexity, rating agencies generally view these structures as neutral to credit profiles when governance remains strong.
…………………
AUTHORS: Jamie Tucker – CPA, CFA, Senior Director, Life Insurance Fitch Ratings, Laura Kaster – CFA, Senior Director, Fitch Wire (North and South American Financial Institutions)
Edited by Nataly Kramer – Lead Insurance Editor at Beinsure