Fitch Ratings’ Prism scores for U.S. life insurers improved modestly in 2024-2025, with capital strength remaining resilient despite accelerating pressure from record annuity volumes and rising investment risk, according to Fitch‘s annual Prism Life compilation.
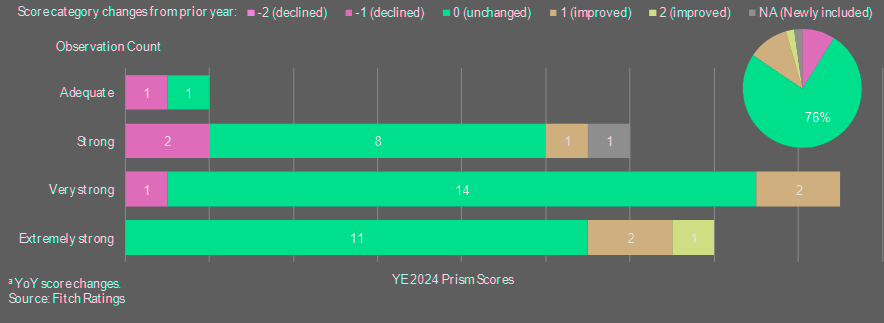
Among the 45-company cohort, 76% maintained stable Prism scores YoY, while six groups improved and four deteriorated. The distribution shifted slightly upward, with 96% of insurers now scoring ‘Strong’ or above, and ‘Very Strong’ remaining the most common score for the cohort.
The Prism U.S. Life Insurance Capital Model serves as an important measure of capital adequacy, which is one of the key rating drivers (KRDs) in Fitch Ratings’ Insurance Rating Criteria.
5 Key Highlights
- 96% of U.S. life insurers scored ‘Strong’ or higher in Fitch’s 2024 Prism assessment.
- Median Available Capital rose 5.2%, supported by reinvestment spreads and retained earnings.
- Target Capital increased 8.2%, driven by record annuity sales and institutional products.
- ‘Very Strong’ remains the largest Prism score category at 38% of the cohort.
- Fitch expects capital strength to remain resilient despite rising investment risk and moderating annuity growth.
Only one of the Prism score changes resulted in a corresponding rating action, as the score is one input to Fitch’s capitalization and leverage KRD, among other KRDs that may have a higher weighting in the overall rating.
Our annual study examines Prism model outcomes for 45 U.S. life insurance groups. Prism scores increased modestly: six groups improved, four deteriorated and 76% were unchanged from the prior year. Fitch added one group to the sample set this year.
Available Capital (AC) grew at a median of 5.2%, up from 2.9% in 2023, driven by favorable reinvestment spreads and retained earnings.
Target Capital (TC) growth outpaced AC by 1.6% at the median, reflecting robust exposure growth in annuities and institutional products such as funding agreement-backed notes and pension risk transfers. Portfolio scaling adjustments also increased modestly as insurers continued to allocate toward private credit and alternative investments.
Prism scores improved modestly for YE 2024 as insurers with strong available capital growth absorbed TC pressure from record annuity sales. Fitch expects the average Prism score to remain ‘Very Strong’ as AC growth from portfolio yields keeps pace with TC pressure from institutional volumes and rising investment risk.
Jamie Tucker, Fitch Ratings
Score movements occurred almost exclusively among companies with outlier available capital changes. TC will increase from robust institutional volumes and rising investment risk as private credit allocations continue to grow, partially offset by moderating growth in annuity sales.
AC will benefit from higher portfolio yields, as reinvestment rates marginally exceed roll-offs. However, the pace of increases will decline, reflecting lower policy rates and tight credit spreads.
Modest Score Improvements
Prism capital scores remained broadly stable between year-end 2023 and year-end 2024 across Fitch’s 45-company cohort.
‘Extremely Strong’ posted the largest net increase and now represents a larger share than ‘Strong’. Two entities advanced from ‘Very Strong’, and one moved up two categories from ‘Strong’. A single downgrade from ‘Extremely Strong’ to ‘Very Strong’ partially offset those gains.
‘Very Strong’ remains the largest segment at 38% of the cohort. Movements within this band were balanced. Two issuers upgraded to ‘Extremely Strong’ and two declined to ‘Strong’. At the same time, three groups entered the ‘Very Strong’ category, including two from ‘Strong’ and one from ‘Extremely Strong’.
Only one Prism score change coincided with a credit rating action. According to Beinsure analysts, Prism functions as one component within Fitch’s broader capitalization and leverage key rating drivers, and other factors may carry greater weight in determining final ratings.
Distribution of Prism Score
Capitalization & leverage typically weighs heavily in determining the overall Insurer Financial Strength (IFS) ratings, along with Company Profile and Financial Performance. Thus, insurers may need a very high Prism score to offset weaker performance in other KRDs for a particular IFS rating.
U.S. life insurers have used reinsurance to reduce exposure to long-term care (LTC) insurance. The transactions strengthen balance sheets, improve capital efficiency.
Prism Score Distribution
| Prism Score Category | Share of 45-Company Cohort | YoY Movement Trend |
| Extremely Strong | Increased (largest net gain) | Net upgrades from Very Strong |
| Very Strong | 38% (largest segment) | Balanced inflows/outflows |
| Strong | Smaller share than Extremely Strong | Limited downgrades/upgrades |
| Below Strong | 4% (combined) | Minimal presence |
| Strong or Above | 96% of cohort | Slight upward shift overall |
In addition to adopting alternative investment strategies and increasing the use of offshore reinsurers, the U.S. Financial Stability Oversight Council said there has been a shift in the composition of life insurers’ liabilities and an increase of private equity firms and other asset managers in the sector. Beinsure analyzed life insurers risk.
The U.S. Financial Stability Oversight Council said life insurers’ increasingly complex investment strategies and reliance on offshore reinsurers with more lax capital requirements could potentially undermine carriers’ financial stability.
FSOC was created through the Dodd-Frank Wall Street Reform and Consumer Protection Act and is composed of federal and state regulators, as well as insurance industry experts.
Available Capital Continues to Improve
Adjusted capital, or AC, represents a stress-ready measure of surplus built from statutory accounting surplus and refined through Fitch adjustments. The metric reflects cash-equivalent resources available under adverse insurance or economic conditions.
In year-end 2024, AC increased for 70% of companies within Fitch’s US life insurer universe. Over time, surplus movements remain the dominant force behind AC shifts.
The middle half of the cohort recorded AC changes ranging from negative 1.9% to positive 19.6%, with a median increase of 5.2%. That compares with a 2.9% median gain at year-end 2023. The improvement stemmed largely from favorable reinvestment spreads and retained earnings generated by stable operating performance.
Available Capital
| Metric | Capital | Commentary |
| Median AC Growth | 5.2% | Driven by reinvestment spreads & retained earnings |
| Companies with AC Increase | 70% | Majority posted gains |
| Middle 50% Range | -1.9% to +19.6% | Dispersion widened |
| Companies with >20% Growth | 25% | Some driven by one-time events |
| Outlook | Slower growth expected | Lower policy rates may temper gains |
While most companies posted moderate changes, dispersion widened at the extremes. Twenty-five percent of the cohort achieved AC growth above 20%. Three insurers exceeded 50% growth, resulting in score improvements for American National, Constellation Inc, and Investors Heritage Life.
YoY Available Capital Changes as Percent of YE 2023 Available Capital
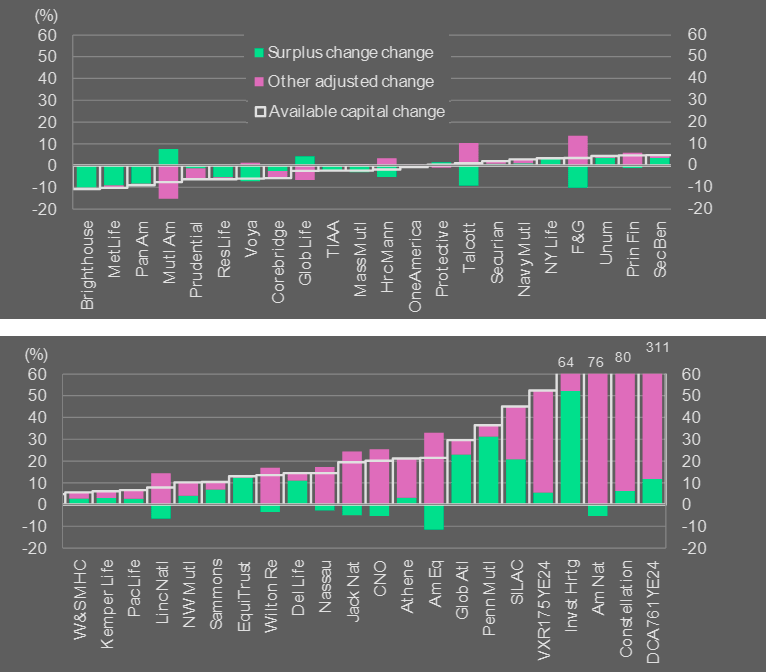
According to Beinsure analysts, these outsized gains reflected corporate actions and one-time events rather than recurring earnings strength.
Component-level contributions varied. In several cases, subcomponents offset each other, producing net changes that masked underlying volatility in surplus drivers.
Looking ahead, Fitch expects AC to continue expanding, though at a slower rate. Reinvestment yields are projected to marginally exceed roll-offs, supporting investment income. Spread widening should contribute positively, while declining policy rates may temper the overall effect.
Target Capital Growth Accelerates
Total capital, or TC, represents the capital an insurer needs to sustain operations and meet obligations under stress scenarios.
The measure incorporates four elements: product charges tied to insurance risk, a diversification benefit reflecting interaction across exposures, a portfolio scaling adjustment that captures asset mix differences, and a 10% operational risk add-on. Each company’s TC reflects its balance sheet profile and business mix.
Across Fitch’s US life cohort, 82% of companies recorded year-over-year TC increases. For the middle half of the sample, TC changes ranged from 3% to 19.5%, with a median increase of 8.2% at the ‘Strong’ level. That compares with a 6.6% median rise in year-end 2023 and just 1% in 2022.
The acceleration stemmed from expanding product exposure, particularly in annuities and institutional liabilities. Portfolio scaling adjustments also edged higher as companies shifted allocations toward private credit and less-liquid assets.
Target Capital
| Metric | Capital | Driver |
| Median TC Growth | 8.2% | Record annuity & institutional volumes |
| Companies with TC Increase | 82% | Broad-based growth |
| Middle 50% Range | 3% to 19.5% | Rising product exposure |
| Companies with >20% TC Growth | 23% | Private credit & asset mix shifts |
| Key Pressure | TC outpaced AC by 1.6% | Higher capital intensity |
According to Beinsure analysts, these asset moves increase capital intensity even when operating performance remains stable.
- A heat map comparing adjusted capital and total capital changes shows varying degrees of alignment. Roughly 47.7% of companies kept both AC and TC movements within a band of negative 4.5% to positive 18%. The remainder experienced larger swings.
- About 47.7% of companies align along an upward diagonal, indicating similar magnitude changes in AC and TC. Another 36.4% sit below the diagonal, where TC growth outpaced AC expansion. The remaining 15.9% appear above the line, reflecting stronger AC growth relative to TC.
- 23% of the cohort recorded TC increases above 20%. Outliers such as American National and Investors Heritage Life posted TC gains of 30% and 54%, respectively.
Those increases did not trigger score declines because substantial AC improvements offset the capital requirement expansion. Year-end 2024 score movements occurred almost entirely among companies with unusually large AC shifts rather than TC changes alone.
Product Exposures Rise with Annuity Growth
Statutory reserves, which form the exposure base for product charges in the Prism model, increased for most companies between year-end 2023 and year-end 2024.
The median total exposure growth across the cohort reached 4.7% year over year. For the middle half of companies, changes ranged from a 0.5% decline to an 11.7% increase.
Several outliers posted materially higher gains. Investors Heritage Life recorded a 41.5% rise in reserves, while EquiTrust reported a 27.2% increase.
Product Exposure Trends
| Product Line | Median Change | Middle 50% Range |
| Annuities | +9.4% | +1.7% to +17.1% |
| Institutional Products | Increase | Not disclosed |
| Variable Annuities | -4.4% | -9.2% to +1.6% |
| Total Exposure (All Products) | +4.7% | -0.5% to +11.7% |
| Outlook | Slower growth ahead | — |
According to Beinsure analysts, such expansions often reflect concentrated growth in capital-intensive product lines or block transactions rather than steady organic expansion alone.
At the product level, movements were more pronounced than the aggregate trend suggests. The annuity segment registered the largest median increase for the second consecutive year, rising 9.4%.
The middle half of issuers recorded changes between 1.7% and 17.1%, compared with a prior-year range of negative 1.8% to positive 16.7%.
Record fixed-rate annuity sales drove the expansion, supported by competitive crediting rates amid elevated interest rates. Institutional products, including funding agreement-backed notes and pension risk transfer transactions, also contributed meaningfully to reserve growth.
AC vs. TC Alignment (Heat Map Summary)
| Alignment Category | Share of Cohort | Interpretation |
| Similar AC & TC Growth (Diagonal) | 47.7% | Balanced capital expansion |
| TC Growth > AC Growth | 36.4% | Capital pressure from exposure growth |
| AC Growth > TC Growth | 15.9% | Strengthened capital buffer |
| Score Changes Driven by AC | Majority | Outlier capital shifts primary driver |
| Rating Actions from Score Changes | 1 Case | Prism is one input among several KRDs |
Variable annuities moved in the opposite direction
The category posted the largest median decline at negative 4.4%, with the middle half of companies reporting shifts between negative 9.2% and positive 1.6%.
Ongoing runoff of legacy guaranteed benefit blocks and restrained new sales contributed to the contraction, as insurers remain cautious about capital-intensive guarantees and regulatory reserve burdens.
Looking ahead, Fitch expects exposure growth to continue but at a slower pace. Lower policy rates are projected to temper annuity sales, particularly in multi-year guaranteed annuities.
Institutional activity, including funding agreement-backed notes and pension risk transfers, should remain stable to increasing year over year. Combined with continued variable annuity runoff, these dynamics point to modest overall exposure growth across the sector.
FAQ
Prism scores are generated by the Prism U.S. Life Insurance Capital Model developed by Fitch Ratings. They measure capital adequacy under stress scenarios and serve as a key input in Fitch’s Insurance Rating Criteria, particularly within the capitalization and leverage key rating driver (KRD). While Prism is not the sole determinant of ratings, it plays a critical role in assessing an insurer’s financial strength.
Prism scores improved modestly across Fitch’s 45-company cohort. Seventy-six percent of insurers maintained stable scores year over year, six groups improved, and four deteriorated. Notably, 96% of insurers now score ‘Strong’ or above, with ‘Very Strong’ remaining the most common category at 38% of the cohort. Only one score change resulted in a corresponding credit rating action.
Available Capital (AC) increased at a median rate of 5.2% in 2024, up from 2.9% in 2023. Growth was primarily supported by favorable reinvestment spreads and retained earnings. Higher portfolio yields, with reinvestment rates exceeding roll-offs, contributed positively. However, Fitch expects the pace of AC growth to moderate as policy rates decline and credit spreads tighten.
Target Capital (TC), which reflects required capital under stress, grew at a median of 8.2%, outpacing AC growth. This acceleration was driven by record annuity sales and expanding institutional products such as funding agreement-backed notes and pension risk transfers. Additionally, greater allocations to private credit and alternative investments increased portfolio scaling adjustments, raising capital intensity.
Record fixed-rate annuity sales led to a 9.4% median increase in annuity reserves, the largest rise among product lines. Elevated interest rates supported competitive crediting rates, fueling growth in multi-year guaranteed annuities. In contrast, variable annuity reserves declined due to runoff of legacy guaranteed blocks and cautious new sales. Strong annuity growth increases product exposure, which in turn lifts Target Capital requirements.
Most score movements were limited to one category and were largely concentrated among companies with unusually large changes in Available Capital. In several cases, substantial AC growth offset rising TC requirements, preventing score declines. Outlier capital increases often stemmed from corporate actions or one-time events rather than recurring earnings strength.
Fitch expects the average Prism score to remain ‘Very Strong.’ While Target Capital will likely continue rising due to institutional volumes and investment risk, Available Capital growth from portfolio yields is projected to keep pace. Exposure growth is expected to moderate as lower policy rates temper annuity sales, but institutional activity should remain steady, supporting overall sector resilience.
………………
AUTHORS: Jamie Tucker – CPA, CFA, Senior Director, Life Insurance Fitch Ratings, Jeffrey Mohrenweiser – Senior Director, Fitch Ratings, Olga Bronshtein – Director, Fitch Ratings
Edited by Yana Keller – Insurance Editor at Beinsure Media