Overview
Global markets have weathered trade tensions, but a new anxiety is creeping in – the risk of an AI bubble. Investors see tech valuations climbing so high that earnings might never meet expectations, according to S&P Global Market Intelligence. Beinsure analyzed the report and highlighted key medical cost trends.
With equity indexes increasingly dominated by a small cluster of mega-cap tech names, even a modest correction could spill into something large enough to shift economic trajectories.
Equity-related wealth effects are comparatively important for US households, and as US consumer spending accounts for not far short of 20% of global GDP, a major deterioration in the outlook would be a game- changer for economic prospects worldwide.
Part of the current nervousness comes from the numbers. In the first half of 2025, investment in information processing equipment and software made up an unusually large share of US GDP. That share climbed to levels last seen during the dot-com bubble in 2000.
The concentration is striking – it underscores how much of US growth is being powered by AI-related bets, and why any correction could turn from sector-specific to systemic in a hurry.
GDP Growth Predictions and Future Economic Trends

Our big picture assessment of growth prospects is broadly unchanged in October’s update, although considerable uncertainty continues to surround the base case.
We continue to forecast a near-term moderation in growth momentum in most major economies and regions, primarily due to a hangover from prior tariff front-loading.
This is not expected to turn into a slump in 2026 thanks to a few tailwinds for growth. These include further falls in crude oil prices, feeding into lower inflation rates and more accommodative monetary policies.
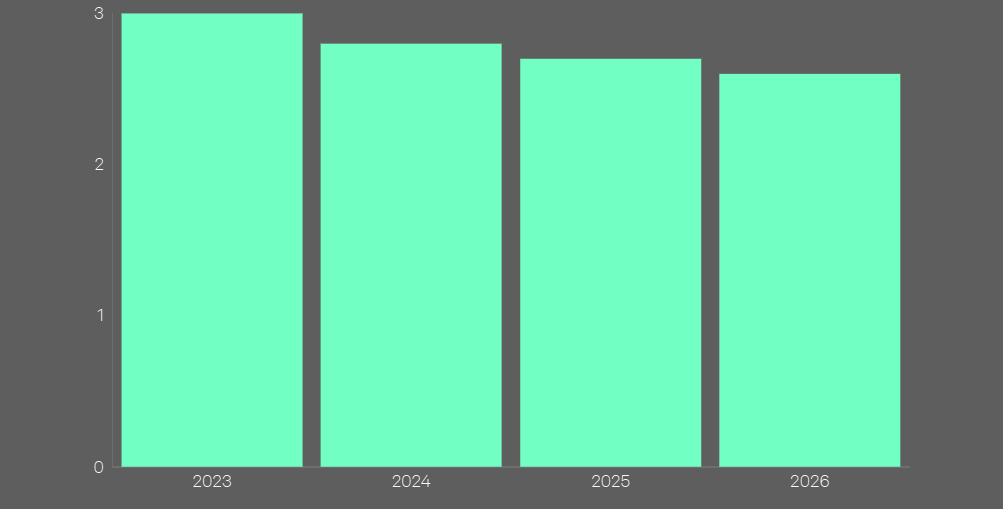
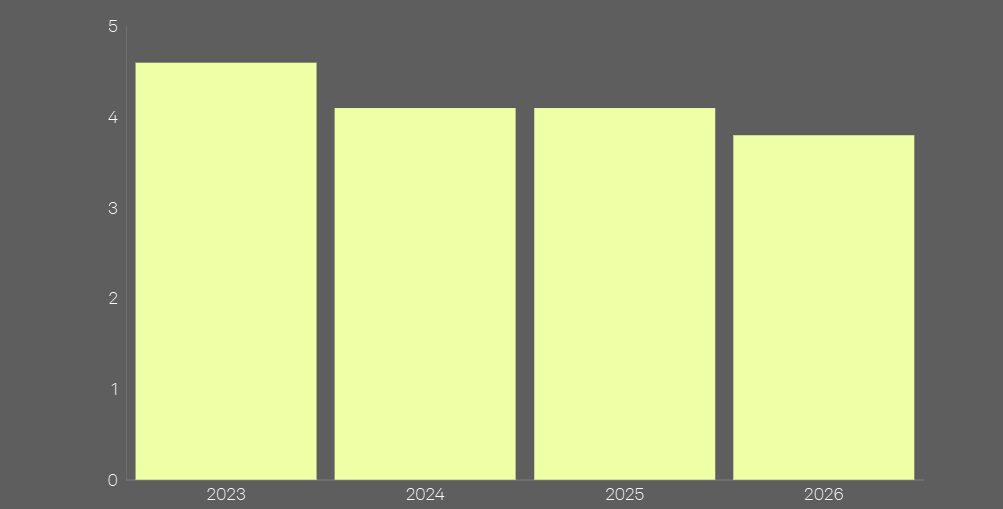
World: Change in real GDP growth, 2023-2026 (%)
Looser fiscal stances in the US and Germany are also growth-supportive, although the potential fragility of sovereign debt markets in many of the world’s largest economies remains a key source of risk.
The recent resurfacing of US-mainland China trade tensions, and the initial response of equity markets, is a reminder of another key risk.
Annual real GDP growth projections for 2026 for the US, the eurozone, India and Russia have been lowered in October’s forecast round. As the revisions were minor outside of Russia, our global growth forecast for 2026 was trimmed only slightly from 2.7% to 2.6%.
At the same time, our global growth estimate for 2025 was lifted a notch, from 2.6% to 2.7%, as upward revisions in the US and India offset downward adjustments in Brazil and Russia. The changes to the 2025 estimates were again modest and largely reflect the evolution of recent data.
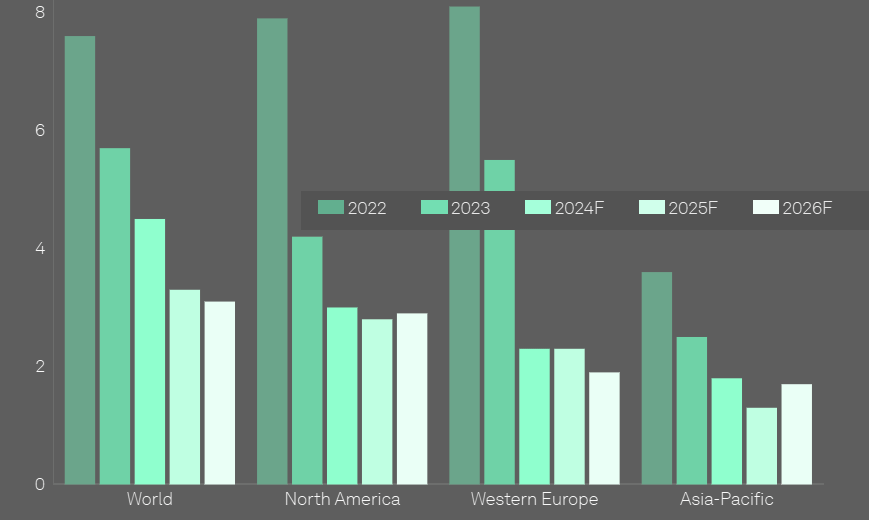
North America: Change in real GDP growth, 2023-2026 (%)
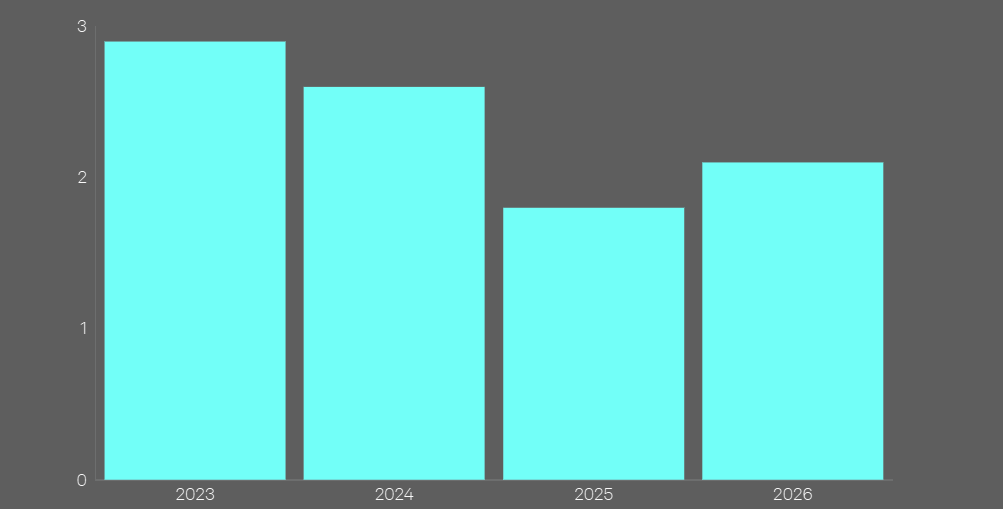
US trade policy uncertainty affects regional growth forecasts, with the US economy expected to outpace the Euro area. China faces weaker growth due to low business and consumer sentiment, while US tariffs may be mitigated by policy support, according to Economic Risks Outlook.
Disinflation trends are seen in the US and Euro area, with the UK experiencing a rebound. Central banks are on different paths, and the German election could influence fiscal policies.
Geopolitical and tariff uncertainties dominate as Trump hits the ground running. Swiss Re Institute forecast global real GDP growth at 2.8% in 2025 and 2.7% in 2026, roughly in line with 2024.
However, the distribution of risks is tilted to the downside, driven by geopolitical risk, the potential for disruptive policy changes, and financial market vulnerabilities.
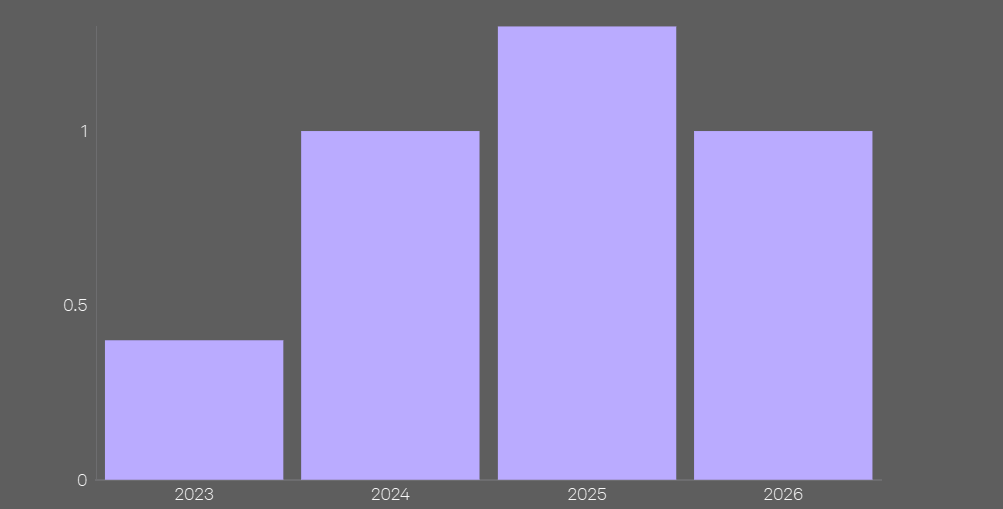
Western Europe: Change in real GDP growth, 2023-2026 (%)
Global infrastructure faces a $11.5 tn gap by 2035, driven by energy transition, AI demand, and urban growth, requiring $4.2 tn yearly investment.
- The U.S. will need to invest more than $1 trn in non-energy infrastructure over ten years, with roads accounting for the bulk.
- China’s target runs to $1.5 trn, India close to $1 trn, while France, Germany, the UK, and Spain together require about $500 mn.
- Altogether, global investment needs add up to $11.5 trn, two-thirds of it in emerging markets.
- Latin America captures this tension perfectly: rising trade diversification and rerouting drive demand, but elevated risks complicate delivery.
Emerging Europe: Change in real GDP growth, 2023-2026 (%)
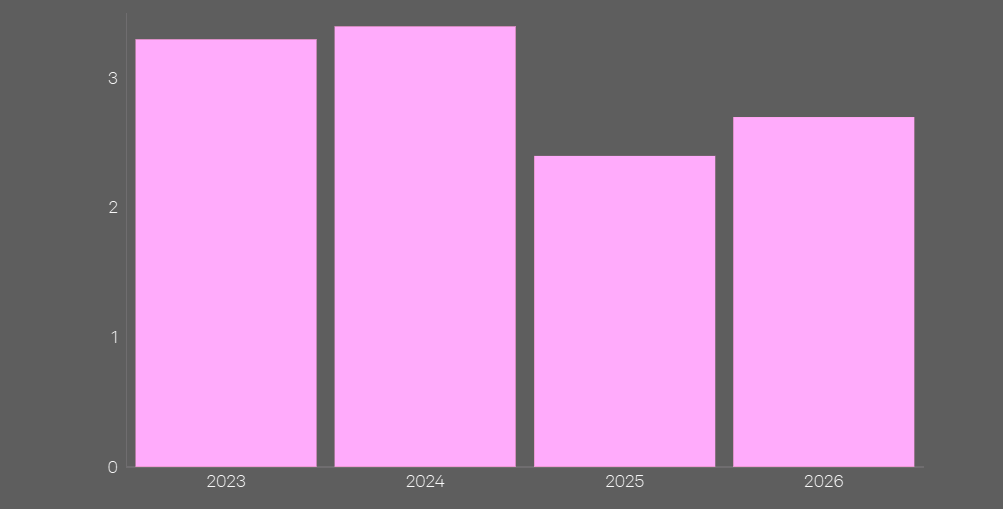
Asia-Pacific: Change in real GDP growth, 2023-2026 (%)
Over the next decade, the global economy must channel nearly 3.5% of GDP each year – around $4.2trn – into upgrading social, transport, energy, and digital infrastructure, according to Allianz’s Global Infrastructure Gap Report.
Urbanization and shifting demographics drive demand in emerging markets, while developed economies struggle with aging systems.
Pandemic shocks and geopolitical tensions exposed fragile supply chains, pushing the U.S. and Europe toward reshoring and friendshoring, which in turn fuels demand for manufacturing sites, logistics hubs, and transport links.
Predictions for Monetary Policy Changes in 2025 and 2026
Lower inflation forecasts for 2026 point toward more central bank easing. Yet the persistence of core inflation continues to complicate the story.
Our current outlook: the Fed delivers 25-basis-point cuts at its October and December 2025 meetings.
Futures markets already price those moves as a near certainty. We expect the Fed funds target range to slide toward a 3%-3.25% neutral level by mid-2026.
But the risks aren’t trivial. Tariff-driven pressures could push prices higher and delay the path back to neutral. In our view, markets understate the chance that the Fed pauses its easing cycle in early 2026 before resuming later.
Consumer price inflation (% annual change)
Decoding PMI Data: What It Reveals About the Economy
S&P Global’s global Purchasing Managers Indexes suffered a setback in September. Following four straight months of improvements, the global composite output index lost some ground.
A half-point fall in the still-outperforming services index contributed to the decline, while the tentatively positive signs for global manufacturing in August also faded.
On the positive side, output expectations for the year ahead improved. The PMIs also continued to show comparatively high goods price pressures in the US, although the manufacturing input and, particularly, the output price indexes for the US have come down from their mid-year peaks.
Fed expected to cut rates in late 2025
Energy offers some relief. Falling oil prices should drag headline inflation down. Core inflation tells a different story – still above 3% in the US and Japan, closer to 4% in the UK.
The eurozone stands out with softer numbers. For policymakers, that stickiness limits how far and how fast cuts can go.
Rate cuts on their own won’t light up growth. Even if inflation improves enough to allow faster easing, structural headwinds remain.
etween $26trn and $30.2trn is needed by 2035 to meet electrification and decarbonization goals, equal to nearly 70% of total infrastructure spend, according to Insurance in a Fragmenting World.
Despite doubling renewable generation investment over the last decade, grids and storage remain underbuilt, driving bottlenecks and higher system costs.
Europe alone must spend $110–150bn each year on distribution, transmission, and interconnection upgrades.
Globally, the energy investment gap sits at $1.5trn annually, with shortfalls most visible in the U.S. and emerging economies. Closing it is crucial for climate targets, power reliability, and energy security.
Trade frictions keep uncertainty elevated
Rising debt and deficits mean steeper yield curves, keeping financing costs from falling as much as policy rates suggest.
And the sectors most sensitive to borrowing costs – manufacturing, construction – now account for a smaller slice of advanced economies than in past cycles.
While mobilizing 3.5% of global GDP annually is necessary, it is not sufficient. Now, what matters is aligning capital, policy, and system design to overcome the real-world constraints that continue to slow delivery.
The barriers are increasingly structural, ranging from permitting delays and grid congestion to fragmented regulatory frameworks and institutional capacity gaps in EMDEs. Addressing these challenges will require a dual shift.
The focus on French and UK sovereign yield spreads is likely to persist
While the risk of an early 2010s-style crisis in Europe is still relatively low, a vicious cycle is playing out.
A combination of persistent uncertainty over the fiscal and political outlook, coupled with higher borrowing costs and tax increases, is damaging growth prospects in Europe’s second- and third-largest economies.
This, in turn, makes effective fiscal consolidation even more difficult to achieve.
Urbanization to push global infrastructure demand as cities face 2050 strain. Infrastructure sits at the base of economic activity, shaping growth and stability.
Building and maintaining transport corridors, ports, and airports are not just technical projects—they are catalysts for development. Strong infrastructure networks raise productivity, cut costs, and reduce risks for businesses, which often bear the brunt of weak systems.
Global demand for infrastructure is rising fast. Emerging and developing markets are expanding at more than twice the rate of advanced economies, creating urgent need for new projects. Population growth compounds the pressure.
By 2040, the world’s population is set to climb by 25%, with urban populations swelling by 46% as migration to cities accelerates.
This wave of urbanization is straining existing networks and forcing rapid expansion of transport, housing, water, and energy systems. By 2050, an estimated 70% of humanity will be city dwellers. That shift makes climate-resilient urban infrastructure not optional, but essential.
FAQ on Global Growth, Inflation, AI Bubble Risks, and Infrastructure
Tech valuations have risen sharply, driven by heavy AI-related investment. S&P Global data shows information processing and software spending reached levels not seen since the dot-com bubble, raising fears that earnings may never catch up to expectations.
A handful of mega-cap tech firms dominate major indexes. This clustering means even a modest correction in AI-related stocks could spill into the broader market and alter economic momentum.
Consumer spending in the US, closely tied to stock market wealth and confidence, represents nearly 20% of global GDP. A significant equity pullback would ripple well beyond Wall Street and affect global demand.
S&P Global and Swiss Re forecasts show global growth at 2.8% in 2025 and 2.6-2.7% in 2026, roughly steady with 2024. The US is expected to outpace the eurozone, while China faces weaker sentiment and growth headwinds.
Lower oil prices should push headline inflation down, but core rates remain sticky – above 3% in the US and Japan, closer to 4% in the UK. Markets expect Fed cuts in October and December 2025, with a neutral funds range of 3.0-3.25% by mid-2026. Risks include tariff-driven inflation that could slow the easing path
The global infrastructure gap runs to $11.5 tn by 2035, requiring about $4.2 tn annually. Urbanization, AI-driven demand, and the energy transition drive this surge. Two-thirds of the need lies in emerging markets, while advanced economies face the challenge of upgrading aging systems.
Meeting electrification and decarbonization goals requires $26-30 tn by 2035, nearly 70% of all infrastructure spend. Current investment lags by $1.5tn each year. Grid and storage shortfalls create bottlenecks, driving up system costs and jeopardizing climate and energy security targets.
………………….
AUTHOR: Ken Wattret – Vice-President, Global Economics
Edited by Nataly Kramer — Lead Editor of Beinsure Media