The insurance industry should prepare for average annual insured catastrophe losses of $171 bn, according to Verisk’s global estimate. The figure rose by $19 bn from last year’s benchmark and represents the highest level has reported.
The increase came despite the US recording no hurricane landfalls in 2025 for the first time in a decade. Verisk said rising property values and insured values worldwide continue to increase the financial exposure attached to catastrophe events.
A quiet hurricane season can lead markets to respond as if risk has eased: rates soften, insurers keep more risk on their own books, and more capital competes to write new business.
Rob Newbold, president of Verisk Catastrophe and Risk Solutions
But 2025 reminds us that the underlying risk landscape has changed and years without significant losses from U.S. hurricane activity no longer signal a quieter catastrophe environment.
Global insured catastrophe losses

For the sixth straight year, global insured catastrophe losses exceeded $100 bn – a result driven not by severity perils like earthquakes and hurricanes, but by record-setting wildfires and significant severe thunderstorm activity, which produces widespread hail, wind and tornado damage across many communities rather than a single catastrophic event.
“A more dynamic risk environment underscores how catastrophe models help insurers maintain underwriting discipline and make informed pricing, capital allocation and risk transfer decisions based on the full range of risk, not just the outcome of a single season,” Newbold added.
Global insured catastrophe loss benchmark
| Metric | Verisk estimate |
| Global insured AAL | $171 bn |
| Increase from prior year | $19 bn |
| Global insured AAL in 2012 | $59 bn |
| US share of global insured AAL | 68% |
| US modeled insured AAL | $117 bn |
| Years above $100 bn insured losses | 6 consecutive years |
| Global economic AAL | More than $450 bn |
| Share of economic losses insured | 38% |
Verisk warned that years without US hurricane landfalls sometimes encourage weaker pricing or less restrictive underwriting terms. The firm’s $171 bn estimate instead measures potential insured losses across a much wider set of regions and perils.
The $171 bn figure is not determined by the outcome of one hurricane season or one year of catastrophe losses. The benchmark uses current exposure data and a near-present climate view across a broad distribution of possible events.
Global insured catastrophe losses exceeded $100 bn for a sixth consecutive year in 2025. Losses were driven less by major earthquakes or hurricanes and more by wildfires and severe thunderstorm activity.
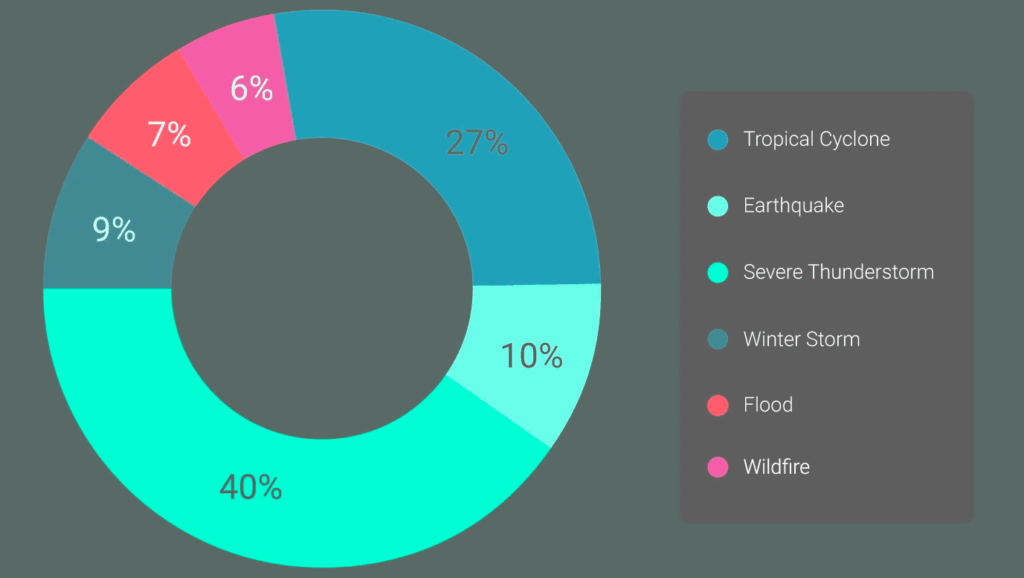
Global insured catastrophe risk by peril
| Peril | Share of modeled insured risk |
| Severe thunderstorms | 40% |
| Tropical cyclones | 27% |
| Earthquakes | 10% |
| Winter storms | 9% |
| Floods | 7% |
| Wildfires | 6% |
Hail, damaging winds and tornadoes generated losses across many communities rather than concentrating them in one event. These frequency-driven events, often described as secondary perils, have become a larger part of annual insured catastrophe losses.
- The US accounts for 68% of Verisk’s modeled global catastrophe exposure. That represents approximately $117 bn of the $171 bn annual loss benchmark.
- Severe thunderstorms contribute the largest share of modeled insured catastrophe risk at 40%. Tropical cyclones follow at 27%, while earthquakes account for 10%.
- Winter storms represent another 9% of modeled loss exposure, followed by floods at 7% and wildfires at 6%. Severe convective storms therefore contribute more to Verisk’s global insured average annual loss than any other modeled peril.
A quiet Atlantic hurricane season
The distribution also explains why a quiet Atlantic hurricane season doesn’t remove broader catastrophe pressure. Frequency perils continued producing substantial insured losses throughout 2025 even without a US hurricane landfall.
Verisk’s model also examines less frequent but substantially more expensive catastrophe years. At a 100-year return period, corresponding to a 1% annual probability, modeled aggregate insured losses reach $477 bn.
At the 250-year return period, modeled losses rise to $606 bn. That amount is more than three times the $171 bn average annual loss benchmark.
Modeled catastrophe losses by return period
| Scenario | Annual probability | Modeled insured losses |
| Average annual loss | Benchmark | $171 bn |
| 100-year return period | 1% | $477 bn |
| 250-year return period | 0.4% | $606 bn |
Verisk stressed that $171 bn isn’t a forecast for 2026 or any other individual year. The figure serves as a long-term benchmark for insurers assessing potential losses across multiple regions and catastrophe types.
Multiple perils contribute to global insured losses
Since Verisk began publishing its global benchmark in 2012, modeled insured average annual losses have nearly tripled. The estimate has increased from $59 bn in the original report to $171 bn today.
Part of that change comes from wider model coverage. Verisk has added more than 20 countries and regions while updating scientific assumptions, data inputs and modeling methods.
Growth in insured exposure accounts for another large portion of the increase
Property exposure across countries modeled by Verisk has expanded by roughly 7% annually since 2021, supported by new construction and rising asset values.
US residential reconstruction costs have increased about 5% annually over the same period. Those costs have risen faster than consumer inflation, increasing insured losses even when physical hazard conditions remain unchanged.
Population growth also continues in areas exposed to hurricanes, floods and wildfires. New construction in those regions adds insured property to locations where catastrophe losses already occur frequently.
England provides one example of the trend. About 7.1% of single-family homes are already located within the 100-year floodplain, according to Verisk.
One in nine new homes built between 2022 and 2024 was constructed in a flood-risk area. Verisk estimates the share could rise to one in seven new homes by 2050.
Higher asset values, rebuilding costs and development in hazard-prone areas are therefore increasing catastrophe loss potential independently of annual weather variation. For insurers and reinsurers, those exposure trends remain central to pricing, capital planning and catastrophe risk transfer decisions.
Natural catastrophe protection gap leaves most losses uninsured
| Market | Economic losses | Insured losses | Insured share |
| Global | More than $450 bn AAL | Approx. $171 bn AAL | 38% |
| Europe | $110 bn AAL | $24 bn AAL | 22% |
| Myanmar earthquake, 2025 | Approx. $12 bn | Less than $100 mn | Below 1% |
Only about 38% of global economic losses from natural catastrophes are insured, according to Verisk, leaving most disaster costs outside the insurance market. The firm’s modeled global economic average annual loss exceeds $450 bn.
The protection gap varies sharply by region. Europe faces roughly $110 bn in expected annual economic catastrophe losses, yet insurance covers only about $24 bn, equal to 22%.
Recent disasters show how low insurance penetration increases the financial burden on households and governments. Flash floods in Central Texas during July 2025 struck an area where national flood insurance take-up stands at roughly 3%.
Coverage was even lower in the county hit hardest by the flooding, at about 2.5%. The event became the deadliest flood in the region in nearly five decades.
Myanmar recorded an even larger insurance gap after its March 2025 earthquake. Economic losses reached approximately $12 bn, while insured losses amounted to less than $100 mn.
The figures mean insurers covered below 1% of the earthquake’s estimated economic damage. Most reconstruction costs therefore remained with households, businesses or public authorities rather than transferring into insurance markets.
Exposure trends increasing catastrophe losses
| Exposure driver | Verisk data |
| Property exposure growth | Approx. 7% annually since 2021 |
| US residential reconstruction costs | Approx. 5% annual growth since 2021 |
| England homes in 100-year floodplain | 7.1% |
| New England homes built in flood-risk areas, 2022–2024 | 1 in 9 |
| Projected share by 2050 | 1 in 7 |
Narrowing the protection gap requires broader access to insurance and a clear understanding of the risk.
Wider catastrophe model coverage gives insurers more information when assessing markets with low insurance penetration. Verisk is also making its own models and third-party models available through its platforms.
The company argues that more detailed risk information could help insurers identify markets where additional catastrophe coverage is commercially feasible. Such expansion would increase the share of natural disaster losses transferred away from households and businesses.
The global figures still show a substantial mismatch between economic exposure and insured protection. With modeled economic catastrophe losses above $450 bn annually, roughly three-fifths of expected losses remain uninsured.
What is Verisk’s global insured catastrophe loss estimate?
Verisk estimates global insured average annual catastrophe losses at $171 bn. The benchmark increased by $19 bn from the previous year and has nearly tripled from $59 bn when Verisk began publishing the estimate in 2012.
Does the $171 bn figure mean insurers will lose $171 bn in 2026?
No. The $171 bn figure is an average annual loss benchmark rather than a forecast for one specific year. It models potential insured losses across different catastrophe events, regions and perils using current exposure data.
Which catastrophe peril creates the largest insured loss exposure?
Severe thunderstorms account for 40% of Verisk’s modeled global insured catastrophe risk, the largest share of any peril. Tropical cyclones represent 27%, followed by earthquakes at 10%, winter storms at 9%, floods at 7% and wildfires at 6%.
How much of global catastrophe risk comes from the US?
The US accounts for approximately 68% of Verisk’s modeled global insured catastrophe losses, equal to around $117 bn of the $171 bn annual benchmark.
How large could insured catastrophe losses become in an extreme year?
Verisk estimates aggregate insured losses of $477 bn at the 100-year return period, which carries a 1% annual probability. At the 250-year return period, modeled losses reach $606 bn.
Why are global insured catastrophe losses increasing?
Higher insured property values and reconstruction costs are increasing loss potential. Property exposure in Verisk-modeled countries has grown roughly 7% annually since 2021, while US residential rebuilding costs have risen about 5% annually.
How large is the global natural catastrophe insurance protection gap?
Only about 38% of global natural catastrophe economic losses are insured. Verisk estimates global economic average annual losses above $450 bn, while Europe has roughly $110 bn of annual economic catastrophe exposure and only about $24 bn, or 22%, insured.
………………
AUTHORS: Rob Newbold, president of Verisk Catastrophe and Risk Solutions, Dr. Jay Guin – executive vice president and chief research officer of Verisk Catastrophe and Risk Solutions
Edited by Yana Keller – Re/Insurance Editor at Beinsure Media