Overview
The first half of 2025 has reinforced Insurance-Linked Securities as one of the most resilient corners of the capital markets. Even against macroeconomic turbulence and shifting risk landscapes, catastrophe bonds continue to show what investors crave: strong yields, minimal volatility, and almost no correlation to mainstream assets, according to Swiss Re’s ILS Report.
Notional issuance has already topped $17bn, setting 2025 on track to become one of the busiest years the ILS market has ever seen.
Beinsure analyzed the ILS data. Appetite from investors remains heavy, buoyed by higher collateral yields, a steady roll of maturities recycling capital back into the sector, and a willingness to test new structures. That means more participation in higher-frequency risks, multi-event coverage, and transactions backed by first-time sponsors or less familiar perils.
Key Highlights
- Third straight year of record H1 issuance, with ~$17bn placed across ~60 deals; already the second-largest year on record.
- Outstanding cat bond market surpassed $56bn, up more than 75% since end-2020.
- Strong inflows, elevated collateral yields, and maturities recycling capital kept demand bid-heavy; over 60% of tranches upsized.
- Two deals each exceeded $1.5bn, the largest in market history; average deal size up ~24% YoY.
- Rising use of multi-event, cascading, second-event, and nationwide aggregate covers, expanding beyond per-occurrence.
- Global Catastrophe Losses: US: $40bn LA wildfires (record insured wildfire loss), $7bn Midwest storms, $16bn tornado damage in May. Global: €0.7bn Windstorm Eowyn (Europe), A$1.7–2.6bn Cyclone Alfred + floods (Australia), $11bn economic loss Myanmar quake (low insured).
Market watchers point to a healthy balance: sponsors gain access to deep pools of capital, while investors lock into returns that stand apart from equity swings and rate volatility, Beinsure noted. The demand pipeline signals momentum into the back half of the year, even as cat activity and pricing remain under scrutiny, according to Catastrophe Bond Market Dynamics.
The mid-year review also digs into performance trends and the movement of the Swiss Re Cat Bond Indices, giving both sponsors and buyers a read on how the space is adjusting to 2025’s mix of opportunity and risk.
For anyone betting on non-traditional diversifiers, the ILS market once again proves it’s more than just a niche play.
Primary ILS Market Performance

Following an elevated year of issuance in 2024, the catastrophe bond market has continued to grow at a remarkable pace.
Catastrophe bond notional issuance has surpassed $17 bn across nearly 60 transactions, making 2025 already the second-largest year of issuance since market inception, with six months still to go.
Notably, substantial placements (greater than $750 mn) have been made for sponsors including State Farm, Florida Citizens, Allstate, Everest Re, California Earthquake Authority, and SageSure carrier partners, who continue to secure significant capacity from the ILS market.
ILS New Issuance: Historical Cumulative Notional Issued
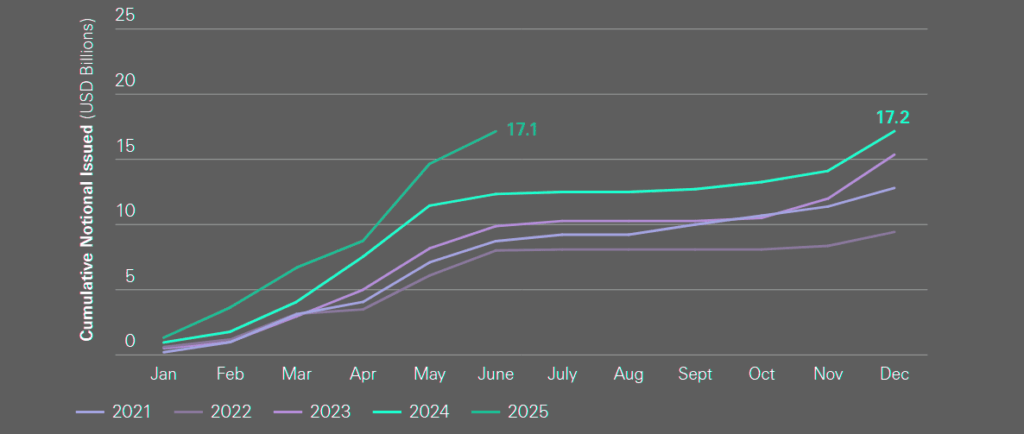
ILS issuance surges past records as demand outpaces supply
Looking ahead, and barring any major disruptive events, we anticipate continued momentum into Q4 which positions the market for another exceptional year of issuance, Beinsure noted.
Q1 2025 saw $6.5 bn in new catastrophe bond issuance, setting a first-quarter record and surpassing the previous high by over $2.6bn. Q2 2025 is on pace to reach $10.35 bn in new issuance across 32 transactions, according to Aon.
Issuers accelerated their transactions to take advantage of favorable pricing and abundant capital, pulling spring deals into the early part of the year.
Investor appetite remained strong. Over 60% of issued tranches were upsized, driven by robust demand in a market where spreads continued to tighten.
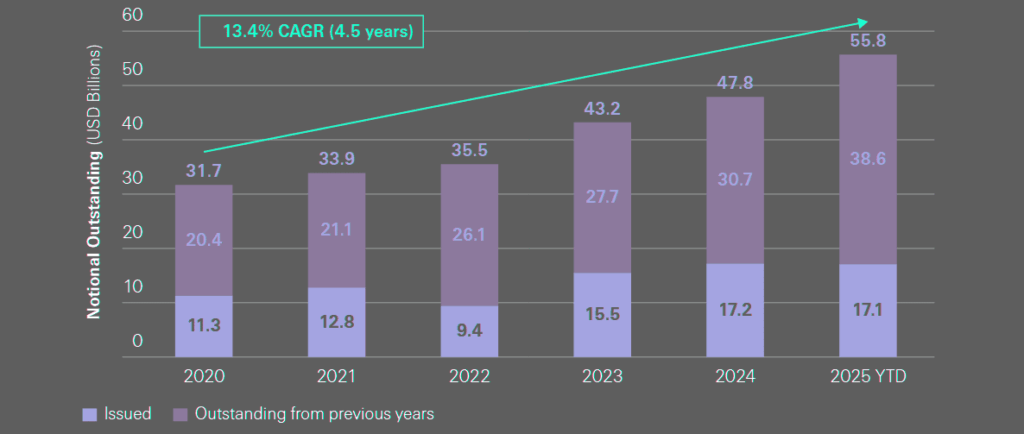
Issued vs Outstanding Notional
Issuers who moved early secured better terms and capacity ahead of expected seasonal pressure. Average deal sizes have grown nearly 24% compared to Q2 2024, reflecting continued demand from insurers and other risk-transfer buyers.
Cat Bond Issuance
| Metric | H1 2025 | H1 2024 | Notes |
|---|---|---|---|
| Notional issued | $17bn+ | ~$12bn | Second-largest year on record already |
| Transactions | ~60 | ~45 | Broad mix across perils and structures |
| Market size (outstanding) | $56bn | $50bn YE 2024 | Market up 75% since 2020 |
| Avg. deal size | +24% vs Q2 2024 | — | Upsizing driven by investor demand |
| Tranches upsized | 60%+ | 45% | Reflects heavy oversubscription |
The quarter included two landmark transactions, each exceeding $1.5bn—the largest ever seen in the catastrophe bond market.
In H1 2025, the cat bond market size surpassed the $50 bn benchmark and quickly climbed to nearly $56 bn, reflecting robust growth and investor confidence.
Since year-end 2020, the market has expanded by over 75%, underscoring its increasing relevance and resilience. Importantly, investors continue to show strong appetite, with capital available to support ongoing and future issuances even after a record half.
Cat bond Market Sets New Straight Issuance Record
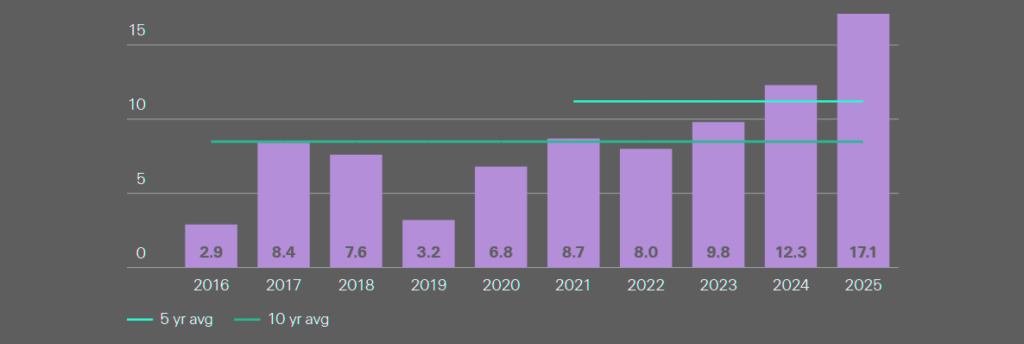
2025 delivered the third consecutive record-breaking first half for catastrophe bond issuance. Four of the last five years now sit at new highs, and the streak shows little sign of slowing.
- On one side, sponsors continue to chase protection.
- On the other, investors arrive with cash in hand, supported by fat collateral yields and strong maturity schedules that keep liquidity flowing back into the sector, Beinsure noted.
Nine fresh sponsors tapped the cat bond market in H1, repeating last year’s tally. The mix was broad: residual pool participants, the first Canadian entrant, and a group of fast-scaling MGA-linked carriers.
Each blended collateralized multi-year cat protection with their existing reinsurance programs, using the market to diversify coverage.
Historical Notional Issued
Beyond the standard first-event per-occurrence trades, 2025 also marked a push into higher-frequency structures.
Four nationwide indemnity annual aggregate deals went live in the first half. Multi-event placements also gained traction, from second and subsequent event transactions to more complex cascading covers.
First Time Cat Bond Sponsors in 2025
| First Time Sponsor | Deal | Notional ($mn) | Covered Peril |
| TD Insurance | MMIFS Re 2025-1 | 105 | Canada EQ & SCS |
| Auros | Gateway Re 2025-2 | 150 | US WS |
| Flood Re | Vision 2039 2025-1 | 182 | UK FL |
| Sutton National | Greengrove Re 2025-1 | 100 | California WF |
| US Coastal | Chartwell Re 2025-1 | 330 | US WS |
| Ocean Harbor | Oceanside Re 2025-1 | 75 | NY WS, ST |
| Texas FAIR Plan | Bluebonnet Re 2025-2 | 200 | TX NS, ST, WF |
| Kingstone | 1886 Re 2025-1 | 125 | NE WS |
| Sparkassen | Liongate Re 2025-1 | 100 | JP, GER EQ |
Florida personal lines carrier Security First closed a $150mn cascading deal in Q1, layering protection step by step.
MGA affiliates SURE and SafeChoice, both tied to SageSure, locked in multi-year and one-year zero-coupon formats for second-event cover. Investors showed they’re willing to back these higher-frequency risks at scale, spreading capacity across a wide range of sponsors, Beinsure noted.
Weighted Average Issuance Spread, Expected Loss and Multiple
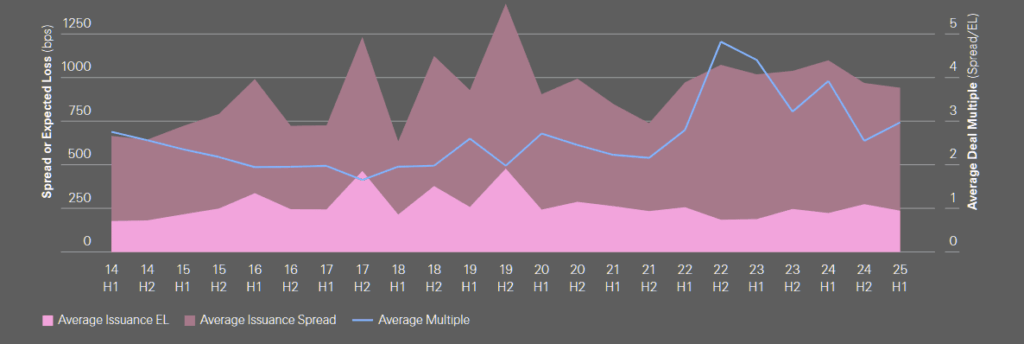
The signal is clear: cat bonds aren’t just breaking issuance records, they’re expanding in scope and complexity, with sponsors and investors both leaning in.
Secondary Market Conditions
| Factor | 2025 | Trend vs 2024 |
|---|---|---|
| TRACE volumes | ↓ Lower | Fewer natural sellers |
| Pricing | ↑ Higher | Bid-heavy environment |
| Spreads | ↓ Compressed | Tightened after late-2024 hurricane spike |
| Investor activity | Active bidders | Cash deploying pre-wind season |
| Market tone | Bid heavy | Contrast with widening seen in June 2024 |
Secondary ILS Market Performance

The first half of 2025 underscored the strength of the cat bond primary market, with capital inflows and a wave of maturities driving heavy investor activity. Secondary trading, by contrast, has been muted.
TRACE data shows volumes slipping against H1 2024, leaving the market short of natural sellers and dominated by buyers.
That imbalance pushed prices higher and forced spreads tighter. The contrast with June 2024 is sharp: last year investors were fully allocated and spreads edged wider.
This June, bids stayed active into the close of the half-year as investors put unspent capital to work and fine-tuned portfolios before the core wind season.
TRACE Trade Summary
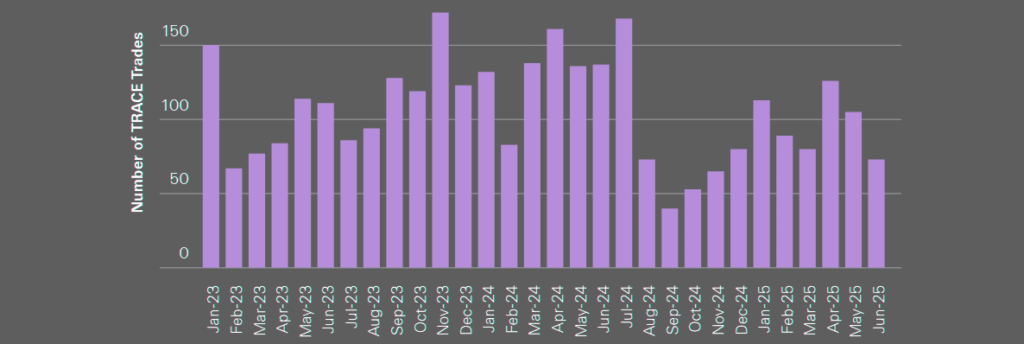
Cat Bond Secondary Market
Spread dynamics tell the same story. After widening in late 2024 when Hurricanes Helene and Milton hit, cat bond spreads ground steadily tighter through H1 2025.
April and May saw a pause, but cash on the sidelines and persistent bid pressure drove another leg down in late June.
Figures in the mid-year report capture both the volume slowdown and the spread compression in lower-risk cat baskets.
US Windstorm and Multiperil Spread Progression
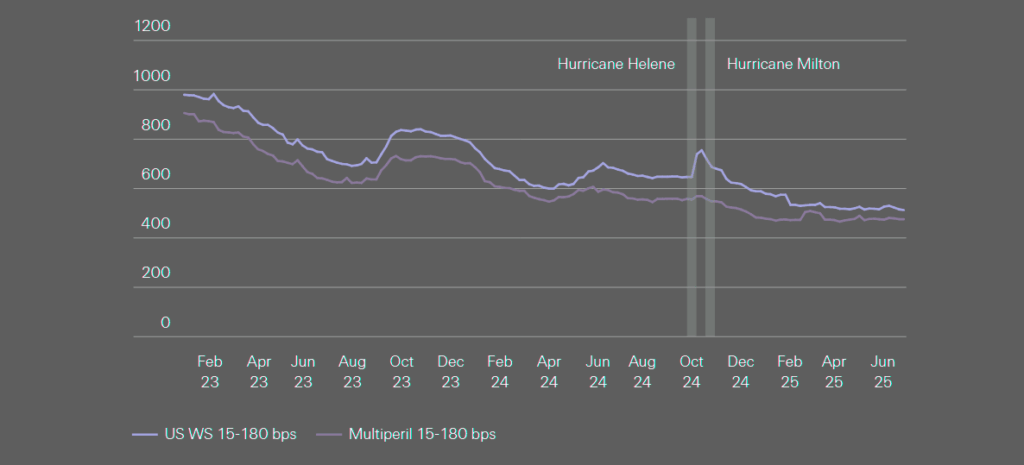
The setup heading into the second half: a market with fresh capital, fewer sellers, and spreads that remain under pressure in a bid-heavy environment.
Global Catastrophe Losses
The year opened with a shock: wildfires ripping through the Los Angeles area in January and generating insured losses of around $40bn. Swiss Re Institute flagged the figure as a new record for wildfire claims. Roughly two-thirds of payouts will land on primary insurers, with reinsurers taking the balance.
The cat bond market felt only a limited direct hit given its light wildfire exposure, but aggregate structures saw erosion, and worldwide index covers as well as junior indemnity layers have already paid out. That activity dented both new issue pricing and secondary levels.
Even so, two fresh wildfire-related transactions cleared the market in H1 — both with combined wildfire and fire-following earthquake protection. One priced in Q1, another was still in marketing at the June cutoff.
Together with the Palisades and Eaton fires, those deals kept investor focus trained on so-called secondary perils, aggregate protection, and wildfire modeling.
Major Catastrophe Events – H1 2025
| Event | Region | Date | Estimated Insured Loss |
|---|---|---|---|
| Los Angeles wildfires (Palisades, Eaton) | US | Jan | $40bn (record wildfire claims) |
| Midwest storms | US | Mar | $7bn (PCS) |
| Tornadoes (May 16–18) | US | May | $16bn (Cotality est.) |
| Windstorm Eowyn | Europe | Jan | €0.7bn (PERILS) |
| Cyclone Alfred | Australia | Feb–Mar | A$1.4–2.3bn (ICA vs PERILS) |
| N. Queensland floods | Australia | Mar | A$0.3bn (ICA) |
| Earthquake (Mandalay, 7.7M) | Myanmar | Mar | $11bn damage; negligible insured |
US Severe convective storms
Severe convective storms remained another weight on US losses. The Storm Prediction Center counted 1,298 preliminary tornado reports by 30 June, the second-highest mid-year tally on record and just shy of 2024’s pace.
PCS pegged insured losses from March’s Midwest outbreak at $7bn. Tornadoes from 16–18 May potentially damaged close to 63,000 properties, with reconstruction costs near $16bn, according to Cotality.
Elevated SCS claims combined with the LA fires chewed into annual aggregate cat bonds, and with the US wind season still ahead, erosion risks remain a key concern.
Beyond the US, Europe and Asia-Pacific also took hits
Windstorm Eowyn swept through in late January, generating insured losses of €0.7bn per PERILS.
In Australia, Cyclone Alfred and the North Queensland floods combined to leave an insured bill of A$1.7–2.6bn, depending on source.
The Insurance Council of Australia set Alfred’s losses at A$1.4bn, while PERILS put the figure higher at A$2.3bn, with an extra A$0.3bn from floods.
March brought a magnitude-7.7 quake near Mandalay, Myanmar. The World Bank estimated $11bn in direct asset damage, but low insurance penetration kept insured losses negligible. Atlas Reinsurance pegged losses in neighboring Thailand at about $29mn.
Mid-2025 closes with investors parsing aggregate erosion, reinsurers recalibrating wildfire risk, and the industry bracing for what the second half may deliver.
FAQ – ILS & Cat Bonds
Because H1 2025 marked the third consecutive first half with record issuance. Nearly $17bn was placed across close to 60 transactions, already making it the second-largest year in the market’s history with six months left to go.
Capital inflows, high collateral yields, and a steady wave of maturities recycling cash back into the sector. Investors are also open to new structures, including multi-event and higher-frequency covers, which broaden diversification.
9 first-time entrants came to market in H1. They included Canada’s TD Insurance, the UK’s Flood Re, residual pools, MGA-linked carriers, and a spread of US regional players like Sutton National and Texas FAIR Plan.
Issuance is scaling up. Average deal sizes rose nearly 24% versus Q2 2024. Q1 alone set a record with $6.5bn placed. Two separate H1 transactions exceeded $1.5bn each, unprecedented in the cat bond space. Beyond per-occurrence covers, 2025 featured cascading deals, second-event protection, and nationwide indemnity annual aggregates.
Trading has been muted. TRACE volumes dropped versus 2024, with few natural sellers and a bid-heavy backdrop. Prices pushed up and spreads compressed. Investors held excess cash in June and kept bidding through half-year close, unlike 2024 when allocations were maxed and spreads widened.
The $40bn Los Angeles wildfires set a new record for insured wildfire claims. Severe convective storms drove another round of heavy US losses, including $7bn from March Midwest storms and up to $16bn in damage estimates from May tornadoes. Globally, Windstorm Eowyn (€0.7bn), Cyclone Alfred and floods in North Queensland (A$1.7–2.6bn), and a 7.7 quake in Myanmar ($11bn direct damage but minimal insured loss) added to the tally.
Annual aggregate cat bonds already show erosion from US wildfires and SCS. With wind season ahead, more stress is possible. Still, capital supply is strong, spreads remain tight, and investor appetite is intact. Sponsors see deep liquidity; investors see a diversifier largely uncorrelated with equities and rates. Momentum points to another exceptional year.
…………………..
AUTHORS: Jean-Louis Monnier – Swiss Re Capital Markets Corp (New York), Len Zaccagnino – Head of Global ILS Sales Swiss Re Capital Markets Corp (New York), Andy Palmer – Head of ILS Structuring EMEA & APAC Swiss Re Capital Markets (London)
Edited by Nataly Kramer — Lead Insurance Editor of Beinsure Media