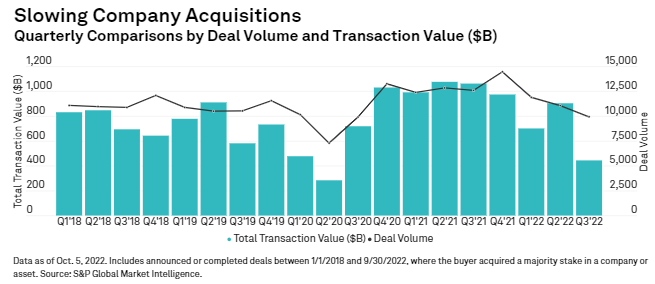
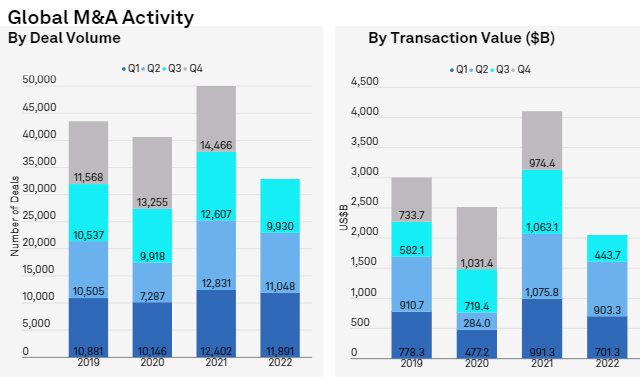
Global M&A activity experienced the slowest quarter in 2022 since the onset of the pandemic in 2020, according to S&P Global Research. The aggregate deal value for the quarter was $443B, a -50% decline compared to Q2 and a -58% decline compared to Q3 2021.
- Average deal size sunk to $44.6M (-45%)
- In Q3, the global deal landscape experienced a sharp reduction in transactions
- Top 10 global deals in Q2’22 and 8 in Q1’22 were above the $10B mark
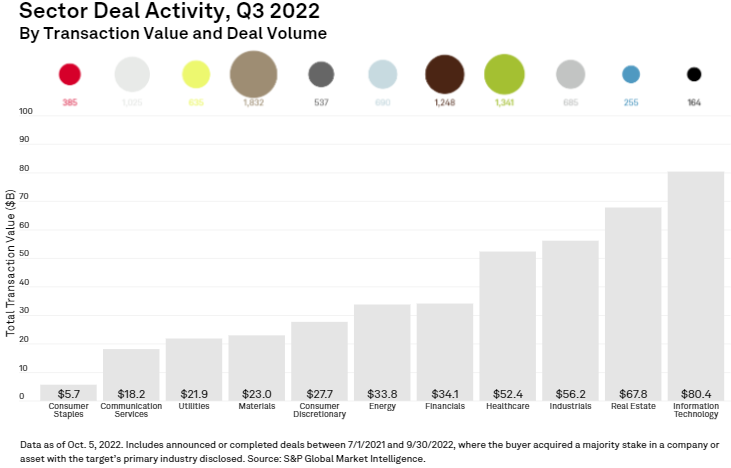
- Large Q3’22 Information Technology and Real Estate deals buoyed aggregate sector deal values
- Most noticeable in Financials with an 82% drop in M&A
Despite year-over-year declines, M&A activity showed resilience in the face of macro challenges, including rising inflation, liquidity tightening across central banks, supply chain disruptions, and the war. Each sector saw a modest Q2-Q3 dip in deal volume compared to 2021. However, some sectors and regions are seeing new areas of opportunity arise.
Corporates, investors, and advisors are still grappling with a multitude of challenges: global inflation and the knock-on effects of tighter financial conditions impacting deal financing, market volatility, and the ongoing war in Ukraine.
However, Information Technology and Industrials led the way by total deal values (+42% and +70% YoY respectively), accounting for nearly one-third of all M&A activity year-to-date. Communication Services saw the largest decline in aggregate deal value, even with the contested acquisition of Twitter by Elon Musk.
Average deal size sunk to $44.6M, a -45% decline from Q2 and uncertainty remains heading into Q4.
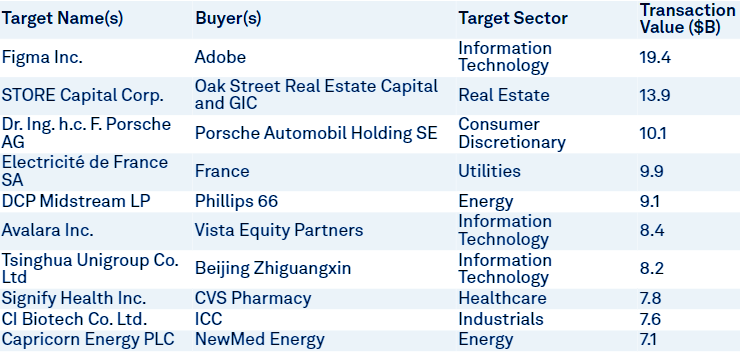
In Q3, the global deal landscape experienced a sharp reduction in transactions, but caution amongst dealmakers was most visible in the transaction values of the top ten deals of the quarter; only three reached the double-digit category. For comparison, all Top 10 global deals in Q2’22 and 8 in Q1’22 were above the $10B mark.
Top 10 Global Announced Deals
Global H1 2022 deal values and deal volumes declined (-23% and -12% respectively) compared to 2021’s blistering first-half pace, however, aggregate deal values and volumes are on pace with pre-pandemic levels last seen in H1 2019. Q2 deal value also bounced back from Q1, increasing 24% to $869B, with an average deal size of $88M.
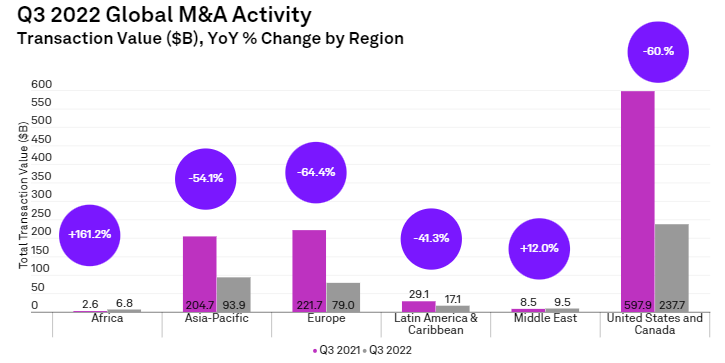
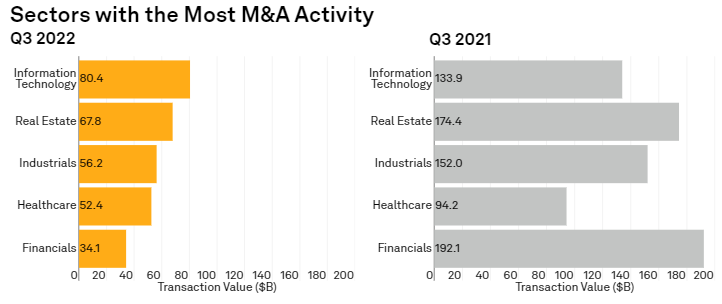
Large Q3’22 Information Technology and Real Estate deals buoyed aggregate sector deal values. However, the slowdown was evident across all sectors. The chart above shows stark year-over-year decreases in quarterly deal values, most noticeable in Financials with an 82% drop in M&A.
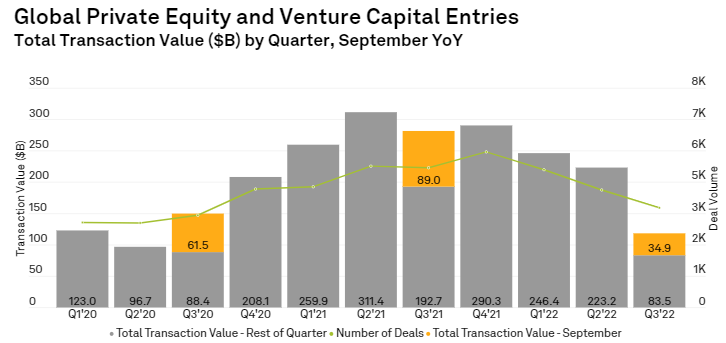
A Q3 slump in global private equity and venture capital entries was consistent with the global M&A trend, especially during the month of September when they plunged 61% to $34.9B from $89.0B in the same month in 2021.
The first half of 2022 was one of the busiest half years for M&A deals worth at least $10 billion in the past five years, despite a dearth of such deals in June. The 23 worldwide M&A deals worth $10 billion or more in the half had a total transaction value of $560.59 billion. This rivaled the second half of 2020, when there were 25 such deals worth a total of $521.48 billion, and the first half of 2019, with 24 such deals worth a total of $760.19 billion.
Three-quarters of private equity exits only generated $66.8B globally, just 40% of the $166.3B total compared to the same period a year ago.
Global private equity and venture capital exit transactions waned further in the third quarter as macroeconomic headwinds continue to hit financial markets and concerns of a prolonged recession loom.
Private equity exit routes including IPOs, secondary and trade sales totaled $12.78 billion during the third quarter of 2022, down from $22.70 billion quarter over quarter and $63.95 billion year over year, data from S&P Global Market Intelligence showed.
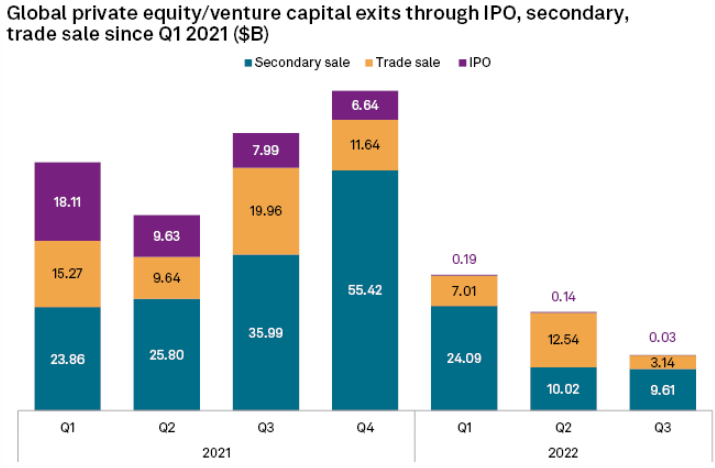
As of Sept. 30, total private equity exits came to $66.77 billion for the year, or about 27.8% of the $239.94 billion of total exit deals in 2021.
Secondary sales dominated the exit route during the three months to Sept. 30, amounting to $9.61 billion in deals, maintaining the pace from the second quarter. In comparison, trade sales and IPOs dwindled to $3.14 billion and $30 million, respectively, from $12.54 billion and $140 million in the previous quarter.
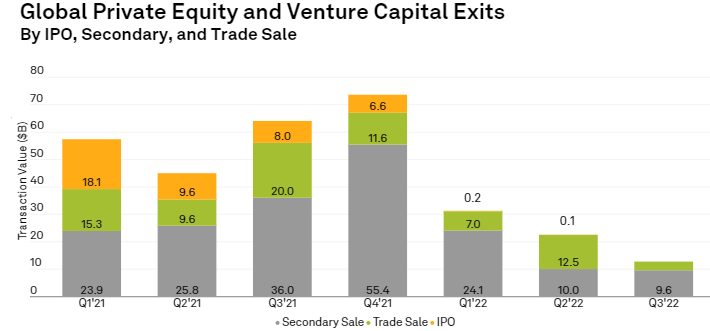
As the current market conditions render an IPO exit nearly impossible, fund managers and allocators have turned to the secondary market for liquidity.
The slowdown in the rate of exit transactions is expected to continue due to economic uncertainty, decreased leverage/increased cost of debt and overall market volatility, which have put pressure on exit multiples.
Exit multiples came back quickly after the 2020 pandemic shutdown, but there is more caution a quick bounce back may not repeat, considering concerns of a deeper, more prolonged recession.
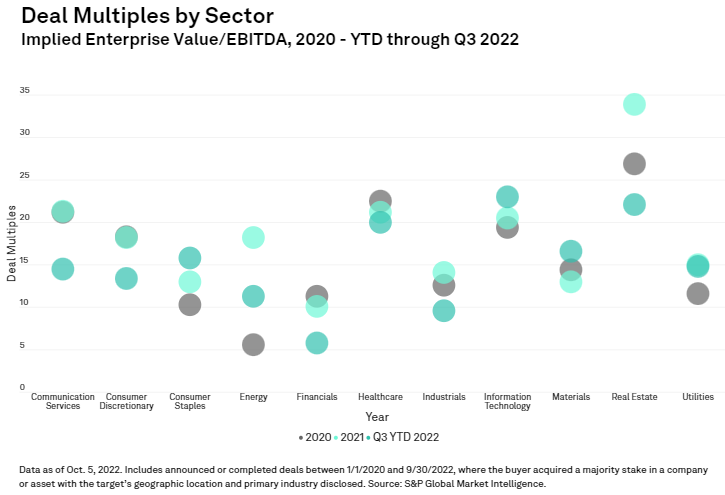
While U.S. TMT M&A activity dropped off in Q3, compared with historic highs a year prior, valuations remained elevated; European TMT M&A saw slightly less year-over-year declines. While the number of deals across global oil and gas and the U.S. power sector shrank during the quarter, both experienced a bump in aggregate transaction value, compared with Q2, indicating a level of resilience in the energy industry deal landscape.
Boosted by the proposed acquisition of Yamana by Gold Fields, mining M&A activity in Q2 surged to its third-highest quarterly total since the beginning of 2018, with deals totaling $14.8 billion. Despite the decline in the number of deals in the oil and gas industry, the combined value of deals increased to $12.39 billion from $8.49 billion, driven by the largest deal (Harold Hamm acquisition of Continental Resources) in the year so far.
………………………..
Edited by Tetiana Mykhailova — CFO Beinsure / Commercial Director Finance Media