Global economic losses from natural disasters in the 9 months of 2026 were estimated at approximately $204 bn, which was 31% below the long-term average since 2000 ($296 bn) and 25% below the median of the same period ($271 bn). It was also the lowest Q1-Q3 economic loss since 2015. These loss totals will likely evolve in future weeks and months as new data becomes available, according to Aon’s Global Catastrophe Recap.
The third quarter thus extended the period of moderate global economic losses since the start of the year without any extraordinary global loss events. Long-term statistics show that the fourth quarter typically generates another $50 bn in economic losses on average, with outliers in 2004 ($102 bn) and 2012 ($126 bn).
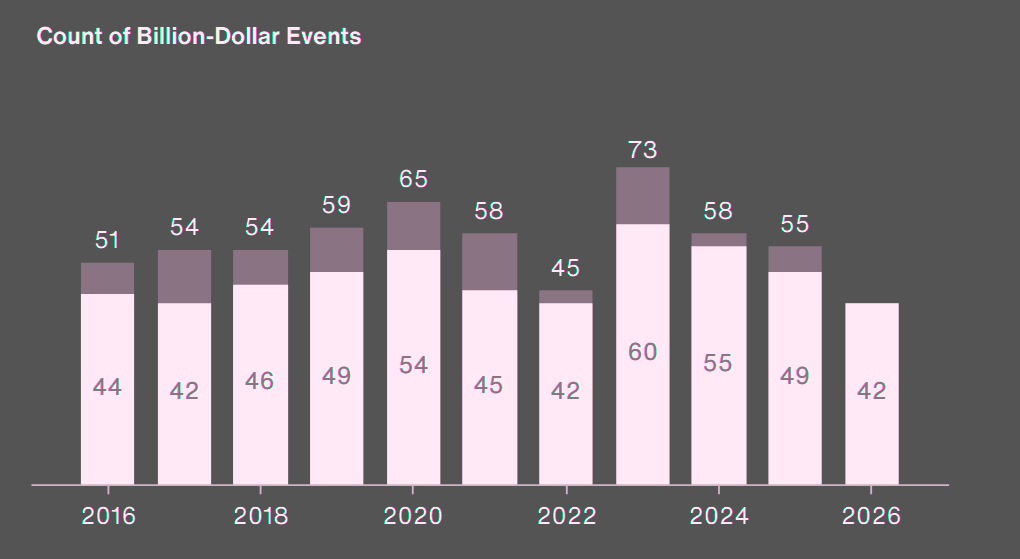
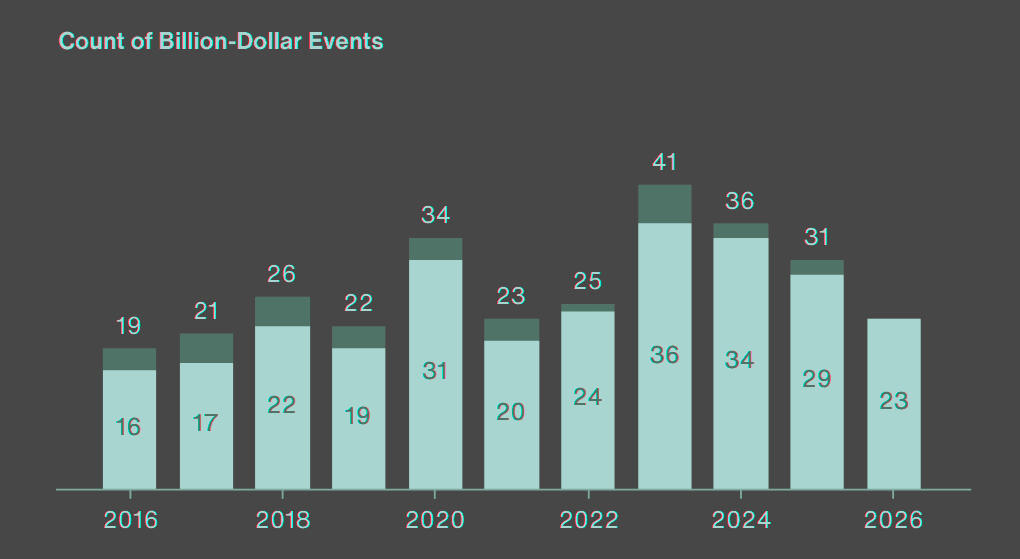
There were at least 42 events that resulted in losses above $1 bn in 2026 so far, of which at least 16 occurred in Q3. Five such events occurred in the United States and Asia, four in Europe and at least two occurred in South America, including the Colombia Earthquake of August 10, the costliest global event of the quarter.
Key highlights
- Global economic losses from natural disasters reached $204 bn in the 9M 2026, 31% below the long-term average of $296 bn and the lowest Q1-Q3 total since 2015.
- Global insured catastrophe losses totaled $91 bn, slightly exceeding the 21st-century average of $88 bn but remaining well below the five-year average of $135 bn.
- Severe convective storms were the costliest natural disaster peril, generating approximately $73 bn in global economic losses. US storms alone accounted for more than $43 bn in insured losses.
- European drought caused more than $8.5 bn in insured losses, with agricultural damage and property subsidence in France accounting for a significant share. At least 42 billion-dollar catastrophe events occurred globally through September.
- The global insurance protection gap stood at approximately 55%, compared with a historical average of 71%. Aon expects additional fourth-quarter catastrophe activity to push annual insured losses above $100 bn.
From the regional perspective, Q1-Q3 losses in the United States and in APAC were below their long-term means since 2000, while losses in EMEA and Americas were above average.
Global economic and insured natural catastrophe losses in 2026
| Key indicator | Q1-Q3 2026 | Historical benchmark |
|---|---|---|
| Global economic losses | $204 bn | $296 bn long-term average |
| Economic losses vs. long-term average | 31% below | 2000-2025 |
| Economic losses vs. historical median | 25% below | $271 bn median |
| Global insured losses | $91 bn | $88 bn 21st-century average |
| Insured losses vs. five-year average | $91 bn | $135 bn |
| Global insurance protection gap | 55% | 71% historical average |
| Billion-dollar catastrophe events | 42 | – |
| Billion-dollar events in Q3 | 16 | – |
Global economic losses raises but remain moderate
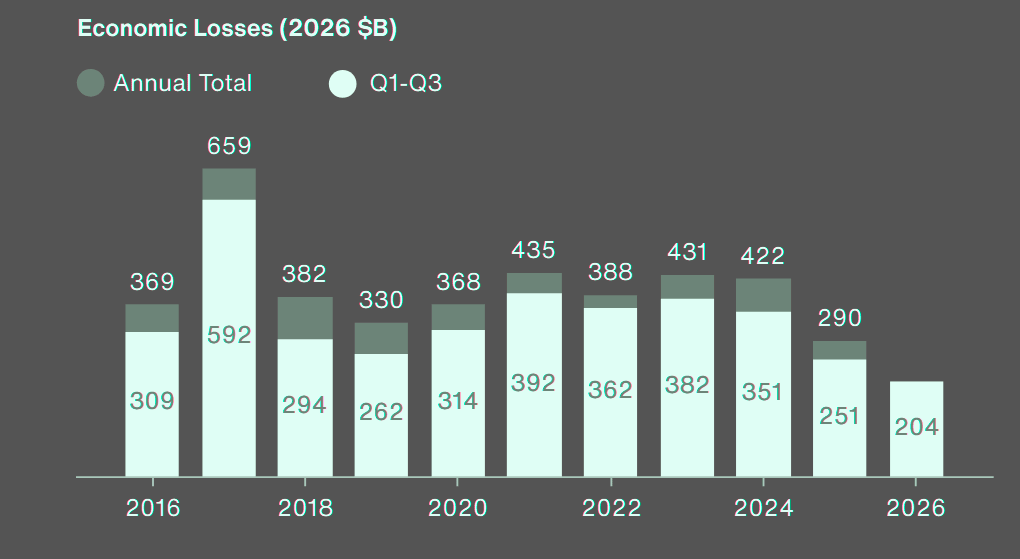
Severe Convective Storms (SCS) remained the costliest peril overall with approximately $73 bn in global losses, elevated further in Q3 by multiple significant outbreaks in the United States and Europe. 2026 already ranks among the five costliest years for SCS globally.
Economic losses by region and peril
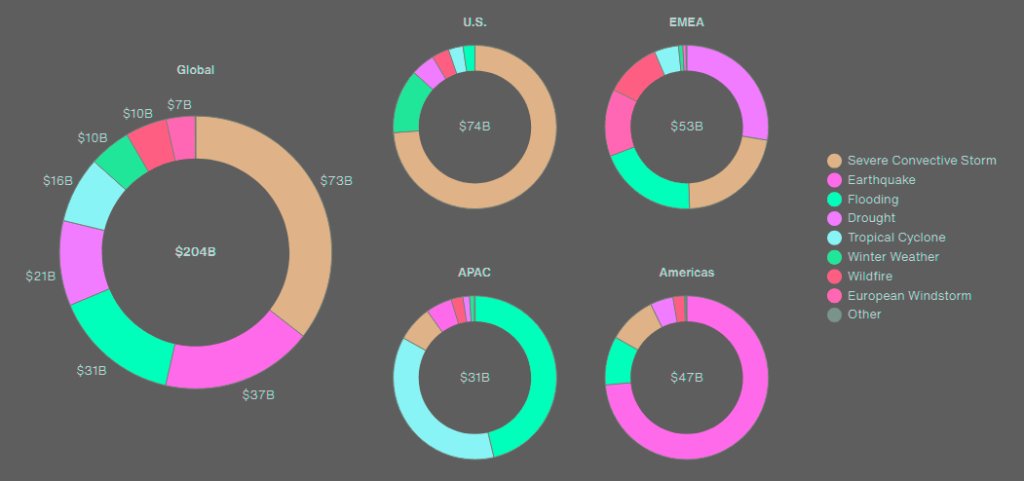
The composition of losses in the United States has not changed dramatically compared to the first half of the year due to the lack of significant hurricane activity. Losses in EMEA show a broad mixture of perils contributing to the overall total, with drought taking the lead as new assessment of impacts emerge.
This includes major agricultural losses across multiple European countries, as well as impacts of subsidence in France and the United Kingdom.
Natural catastrophe losses by region and major peril
| Region | Major natural catastrophe drivers | Loss assessment |
|---|---|---|
| United States | Severe convective storms, summer and winter storms | $56 bn in insured losses, including more than $43 bn from SCS |
| Europe | Drought, severe storms, flooding, windstorms and wildfires | European drought generated more than $8.5 bn in insured losses |
| South America | Earthquakes in Colombia and Venezuela, flooding in Colombia and Chile | Major earthquakes dominated regional losses |
| Asia-Pacific | Seasonal flooding in China, Typhoon Sinlaku and Australian bushfires | Economic losses below the long-term average |
| EMEA | Drought, severe convective storms and other weather-related events | Economic losses above the long-term average |
Economic losses by region
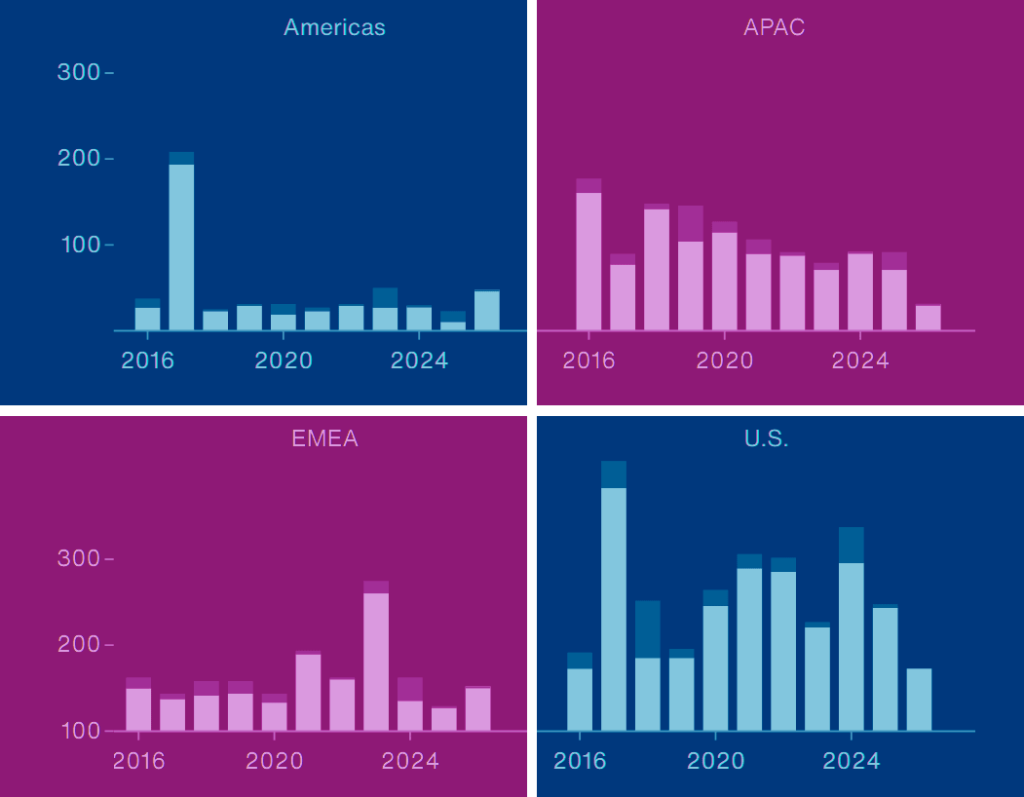
In the Americas, majority of losses were caused by the earthquakes in Venezuela and Colombia. A notable share of the losses was also caused by significant flooding events in Colombia and in Chile.
Disaster activity in APAC was relatively benign compared to previous years and the costliest events were the seasonal flooding in China, Typhoon Sinlaku in the Northern Mariana Islands and Victoria Bushfires in Australia.
Global insured catastrophe losses
Global insured losses from natural disasters reached an estimated $91 bn during the first nine months of 2026, according to preliminary figures from Aon. The total was slightly above the 21st-century average of $88 bn for the comparable period, but substantially below the $135 bn average recorded over the past five years.
- Global insured catastrophe losses totaled at least $91 bn in the first nine months of 2026, slightly above the 21st-century average of $88 bn but below the five-year average of $135 bn.
- The global insurance protection gap stood at approximately 55%, compared with a historical average of 71%, reflecting changes in the composition of catastrophe losses.
- European drought was the largest aggregated loss event of 2026 through September, generating more than $8.5 bn in insured property and agricultural losses, particularly from subsidence in France.
The estimates remain subject to revision as additional claims information and catastrophe loss data become available.
Global natural catastrophe loss outlook for 2026
| Indicator | Historical average or 2026 outlook |
|---|---|
| Q4 global economic losses | $50 bn historical average |
| Q4 global insured losses | $16 bn historical average |
| Full-year 2026 insured loss outlook | Likely to exceed $100 bn |
| Major Q4 2026 event | Hurricane Isaias |
| Q4 2004 economic losses | $102 bn |
| Q4 2012 economic losses | $126 bn |
Further natural catastrophe activity in the fourth quarter, including Hurricane Isaias, is expected to push annual insured losses above $100 bn. Historically, fourth-quarter catastrophe events generate an average of $16 bn in insured losses.
Global insured losses
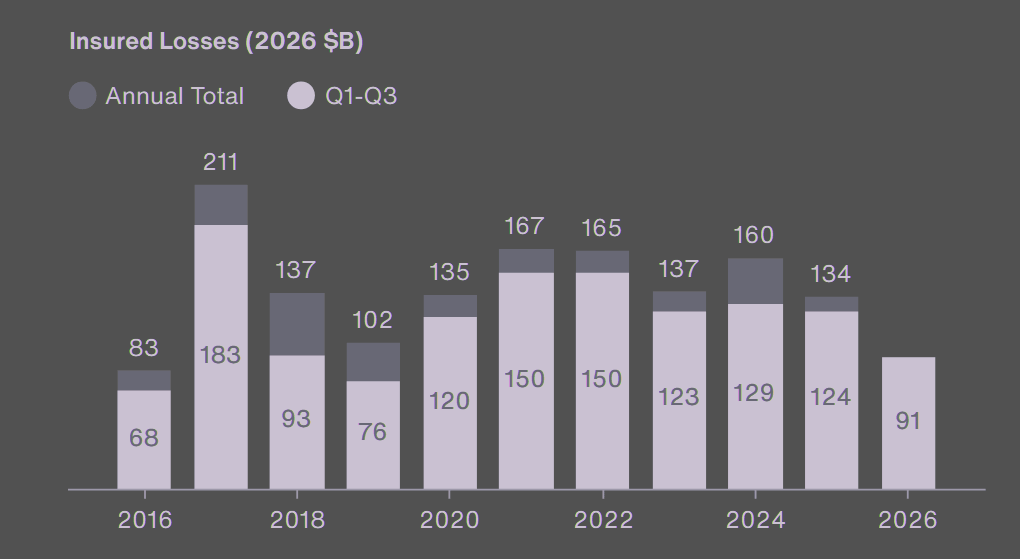
The global insurance protection gap, representing the proportion of economic losses not covered by insurance, remained relatively low at approximately 55%. This compares with a historical average of 71% and is consistent with a longer-term decline driven primarily by changes in the composition of natural catastrophe loss drivers.
Prolonged drought across several European countries was the largest aggregated insured loss event recorded through September 2026. Extended periods of insufficient rainfall caused substantial damage to property and agriculture, with insured losses estimated at more than $8.5 bn.
France accounted for the largest share of these losses, primarily due to soil subsidence affecting buildings and other insured properties.
Insured losses by region and peril
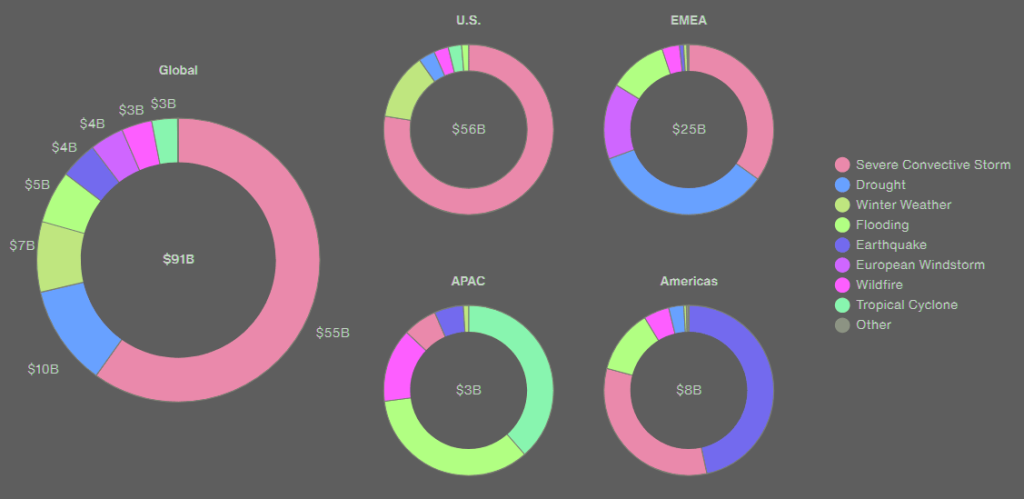
The majority of global insured losses from January through September 2026 were caused by severe convective storms, primarily in North America and in Europe.
The United States experienced average insured losses through the end of September in 2026. The national total reached $56 bn, dominated by summer and winter storms, with little contribution from tropical cyclones. The current SCS annual total is estimated at more than $43 bn, below the elevated losses in the last three years but still well above average.
European insurers experienced a very active SCS season with major outbreaks in mid-July and late August. Significant losses also emerged from the prolonged drought conditions across the continent in agriculture, as well as on property due to the subsidence phenomenon.
In the Americas, the costliest peril was earthquake due to two major events in Colombia and Venezuela.
Insured losses by region
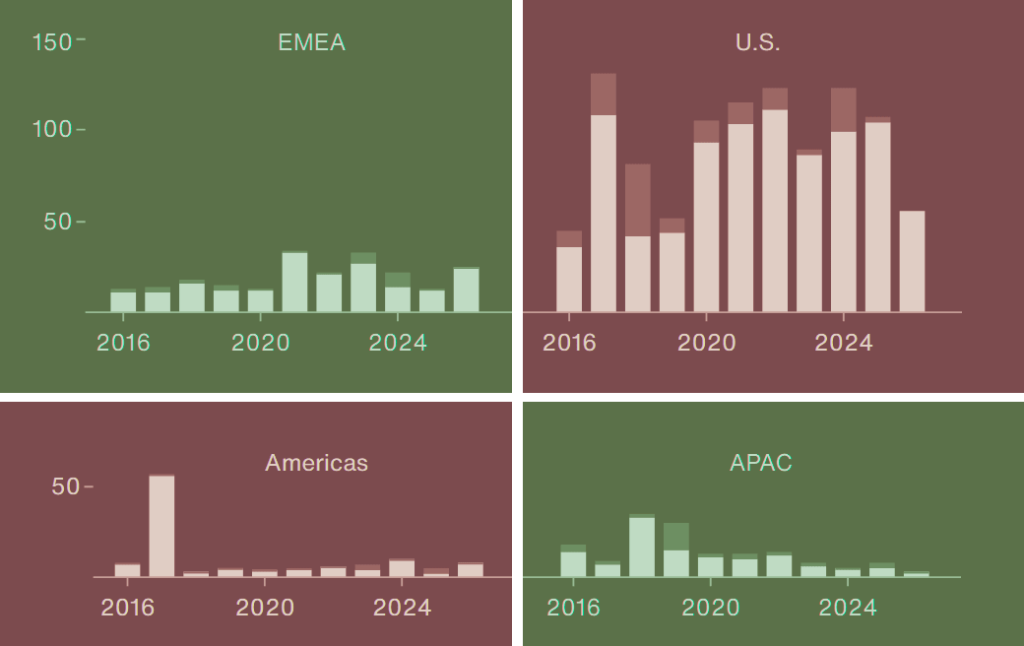
As is typically the case, notable loss events were concentrated in North America, Europe and East Asia where economic exposure is highest.
However, regional differences are visible due to specific mix of peril activity in those regions. While the United States losses are dominated by high-frequency SCS outbreaks, majority of losses in Asia is caused by tropical cyclones and flooding. South America experienced the largest loss events due to major earthquakes in Venezuela and Colombia.
Economic and insured losses from notable Q3 2026 events
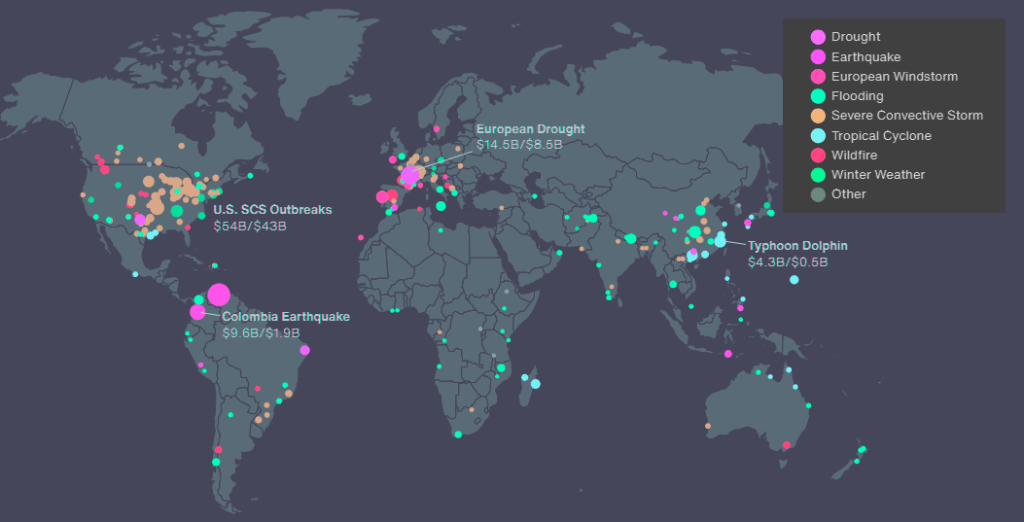
On the other hand, Europe experienced a wide range of disasters related to different perils with significant contributions from drought, SCS, flooding, windstorm, as well as wildfire.
How much did natural disasters cost globally in 2026?
Global economic losses from natural disasters reached approximately $204 bn between January and September 2026, according to Aon. This was 31% below the long-term average of $296 bn and 25% below the historical median of $271 bn. The first nine months recorded the lowest economic catastrophe losses since 2015.
What were global insured catastrophe losses in 2026?
Global insured natural catastrophe losses reached an estimated $91 bn through September 2026. This exceeded the 21st-century average of $88 bn but remained significantly below the five-year average of $135 bn. The United States accounted for $56 bn of the global insured total.
Which natural disasters caused the largest losses in 2026?
Severe convective storms were the costliest peril globally, generating approximately $73 bn in economic losses. US storms accounted for more than $43 bn in insured losses. European drought was the largest aggregated insured loss event through September, causing more than $8.5 bn in agricultural and property losses.
How many billion-dollar natural disasters occurred in 2026?
At least 42 natural catastrophe events caused economic losses exceeding $1 bn during the first nine months of 2026, including 16 events in the third quarter. The August 10 earthquake in Colombia was the costliest global catastrophe of Q3.
What is the global insurance protection gap in 2026?
The global insurance protection gap stood at approximately 55% through September 2026, meaning that around 55% of natural catastrophe economic losses were not covered by insurance. This was below the historical average of 71%, reflecting a longer-term decline primarily associated with changes in the composition of catastrophe loss drivers.
Which regions experienced the highest insured natural disaster losses?
The United States recorded the largest share of global insured catastrophe losses, reaching $56 bn through September 2026. Severe convective storms accounted for more than $43 bn of that amount. Europe experienced significant storm and drought losses, while South America was affected by major earthquakes in Colombia and Venezuela. Insured losses across Asia-Pacific remained comparatively moderate.
Will global insured catastrophe losses exceed $100 bn in 2026?
Aon expects global insured catastrophe losses to exceed $100 bn by the end of 2026. Losses had already reached $91 bn through September, and additional fourth-quarter activity, including Hurricane Isaias, was expected to increase the annual total. Historically, fourth-quarter natural disasters generate approximately $16 bn in insured losses, although individual years can vary substantially.
……………..
AUTHORS: Michal Lörinc – Aon’s Head of Catastrophe Insight, Ondřej Hotový – Catastrophe Analyst, Antonio Elizondo – Aon’s Senior Scientist, Tomas Cejka – Aon’s Catastrophe Analyst
Edited by Yana Keller – Re/Insurance Editor at Beinsure