
Overview
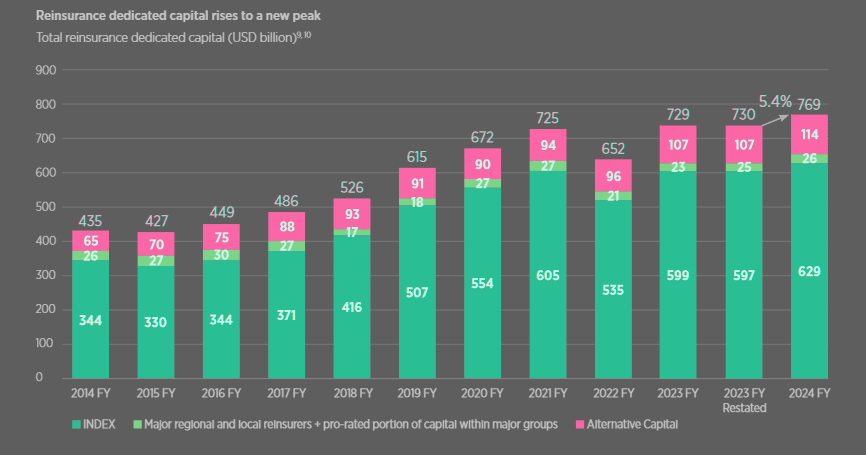
Global reinsurance dedicated capital totaled $769 bn at full-year 2025, a rise of 5.4%. Growth was driven by both the INDEX3 companies and non-life alternative capital.
The capital position of the global reinsurance industry remains strong on an economic basis. Gallagher Re considers this measure most relevant for management decisions. Beinsure analyzed the Global Reinsurance Market Report and highlighted the key points.
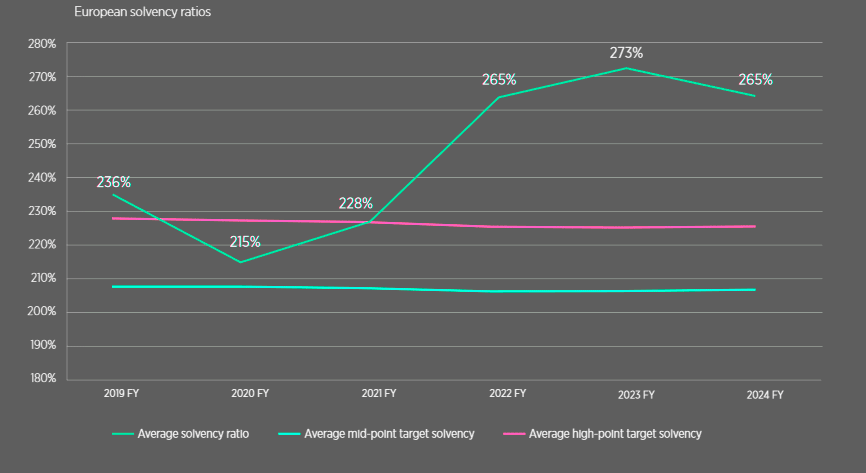
Among the top four European reinsurers, the average solvency ratio (or SST coverage in Swiss Re’s case) stood at 265% at the end of 2025, down from 273% a year earlier, yet still above the upper end of the target range.
In 2025, INDEX capital supply outpaced INDEX premium demand.
Reinsurance dedicated capital rises to a new peak
Within the subset of INDEX companies that disclose detailed figures, revenue rose 8.1% in 2025. This was due to higher rates in property and casualty reinsurance, while exposure growth remained limited as companies scaled back from the US casualty market (see TOP Global Reinsurance Companies Ranking by Country).
INDEX capital increased by $31.4bn to $629bn, driven by $59bn in retained earnings. This figure reflects net income of $117bn, of which $58bn was returned to shareholders.
Unrealized investment depreciation of $23bn, nearly all attributable to National Indemnity, partially offset this growth.
Global Reinsurers by Capital
| Rank | Reinsurer | Capital ($mn) |
| 1 | Munich Re | 40,446 |
| 2 | Swiss Re | 29,319 |
| 3 | Fairfax | 28,508 |
| 4 | Great-West Lifeco | 22,764 |
| 5 | Arch Capital | 20,820 |
| 6 | Markel | 16,929 |
| 7 | Hannover Re | 16,483 |
| 8 | General Re | 15,851 |
| 9 | Everest Re | 14,093 |
| 10 | China Re | 13,999 |
| 11 | QBE | 13,395 |
| 12 | AXA XL | 12,651 |
| 13 | RGA | 12,325 |
| 14 | MAPFRE | 12,026 |
| 15 | Pacific LifeCorp | 11,203 |
| 16 | RenaissanceRe | 10,574 |
| 17 | GIC India | 10,013 |
| 18 | Partner Re | 9,959 |
| 19 | WR Berkley | 9,417 |
| 20 | SCOR | 7,735 |
| 21 | Axis Capital | 6,511 |
| 22 | WMIG Ark | 5,286 |
| 23 | Transatlantic Re | 5,041 |
| 24 | Hiscox | 3,864 |
| 25 | Aspen | 3,372 |
| 26 | Arundo Re (formerly CCR Re) | 2,763 |
| 27 | DEVK Re | 2,659 |
| 28 | Fidelis | 2,630 |
| 29 | Convex | 2,619 |
| 30 | R&V Versicherung | 2,482 |
| 31 | QIC | 2,473 |
| 32 | Korean Re | 2,234 |
| 33 | SiriusPoint Re | 2,183 |
| 34 | RSUI Indemnity | 2,054 |
| 35 | Lancashire | 1,940 |
| 36 | Hamilton Re | 1,918 |
| 37 | Ascot | 1,869 |
| 38 | Toa Re | 1,842 |
| 39 | Somers Re | 1,346 |
| 40 | Peak Re | 1,282 |
| 41 | African Re | 1,066 |
| 42 | Conduit Re | 1,051 |
| 43 | PICC Re | 847 |
| 44 | Deutsche Re | 467 |
| Index aggregate | 628,916 | |
| National Indemnity | 240,606 | |
| Subset aggregate | 226,270 |
Economic capital adequacy remains strong
Net income of $117 bn was supported by realized investment gains of $63.4bn at National Indemnity, up from $49.9bn.
Improved underwriting and stronger investment performance also contributed, with reinsurers benefiting from a 0.6 percentage point increase in running yield and positive gains yield.
INDEX companies distributed nearly half of their net income through dividends and share buybacks, which together totaled $58bn. There were no significant new entrants to the market despite favorable conditions (see TOP 50 Largest Global Reinsurance Groups in the World).
The net effect of capital increases and debt reductions was limited to $0.2bn, down from $2bn at 2025 due to net debt reduction in the second half of the year.
Considering the projected profitability for 2025 and ongoing high levels of capital return, traditional reinsurance capital is expected to grow by more than 6%, or over $40bn, in 2025. This estimate assumes stable financial market conditions, with no material impact from unrealized investment gains or losses.
………………
Edited by Yana Keller – Lead Insurance Editor of Beinsure Media
Fact-checked by Oleg Parashchak – CEO Finance Media & Editor-in-Chief at Beinsure Media and Insurance TOP Ratings (25+ years of professional experience in Rankings, Insurance & Media)