Overview
Global reinsurers reported strong 2024 results with a continued capital build driven by strong retained earnings. The reinsurance industry’s reported and underlying ROE remained well above the cost of capital, supported by further improvement in the underlying combined ratio and increased recurring investment income, Beinsure noted.
The industry is well positioned to deliver strong results in 2025, and further meaningful capital growth.
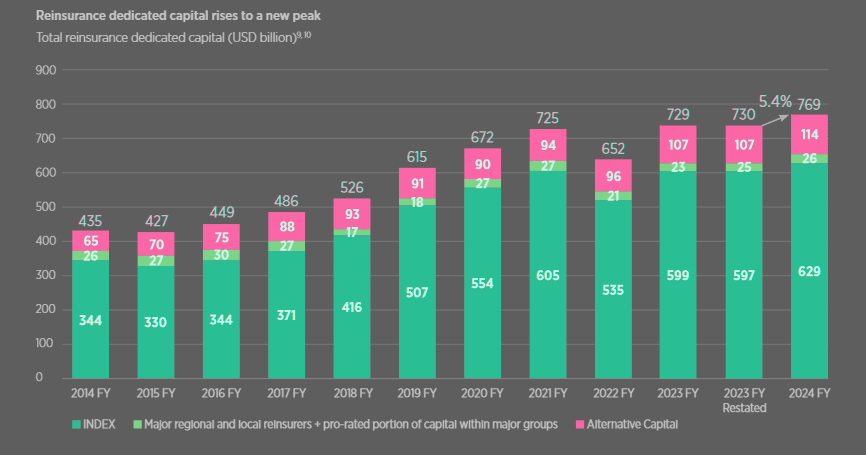
Global reinsurance dedicated capital totaled $769 bn at full-year 2024, a rise of 5.4% versus the restated full-year 2023 base. Growth was driven by both the INDEX3 companies and non-life alternative capital.
The full-year 2024 Reinsurance Market Report provides in-depth analysis of the capital and profitability of the reinsurance industry, based on the Gallagher Reinsurance Index group of companies.
Key findings
- Global reinsurance dedicated capital totalled $769 bn at full year 2024, an increase of 5.4% versus the restated full year 2023 base. Growth was driven by both the INDEX companies and non-life alternative capital.
- Gallagher Re’s in-depth analysis of a subset of 16 reinsurers shows the reported combined ratio further improved to 86.8% (2023 FY: 87.3%). This was driven by a strong improvement in the underlying combined ratio to 93% (2023 FY: 96%).
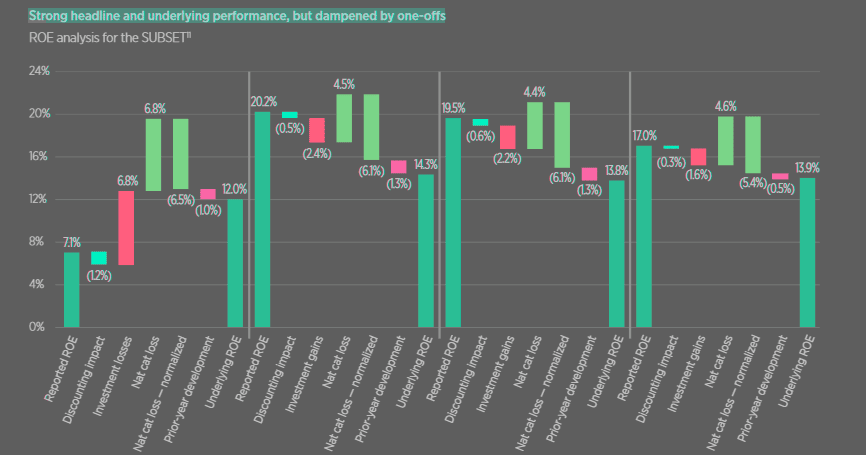
- The reported ROE remained strong at 17%, albeit lower than 19.5% at 2023 FY. Despite improved underlying underwriting profitability and higher running investment income, the underlying ROE remained stable at 13.9% due to headwinds outside P&C reinsurance. Without this, the underlying ROE would have been approximately 15%.
- Reinsurers are well positioned to maintain strong profitability in 2025. Assuming a ‘normal’ level of natural catastrophe losses, we expect an underlying ROE of around 15% and a headline ROE of approximately 18-19%. The California wildfires have resulted in substantial insured losses early in the year, but even if these losses prove to be incremental to annual Nat Cat budgets, reinsurers are well placed to deliver headline and underlying ROEs which are roughly double the industry’s cost of capital.
- Reflecting the continued strong profitability, traditional reinsurance capital is on track to increase by 6% in 2025. Resilience of the reinsurance industry materially improved over the past three years, driven by significantly improved underlying profitability.
For the INDEX companies, which provide over 80% of the industry’s capital, capital grew by 5.3% to $629bn. This was driven by net income of $117bn, partly offset by capital returns of $58bn and unrealized investment losses of $23bn, the latter largely from National Indemnity.
Largest reinsurers’ rankings
- Global Reinsurers by Net Income
- Global Reinsurers by Net Written Premium
- Global Reinsurers by Capital
Capital position of the global reinsurance industry
The capital position of the global reinsurance industry remains strong on an economic basis. Gallagher Re considers this measure most relevant for management decisions, Beinsure noted.
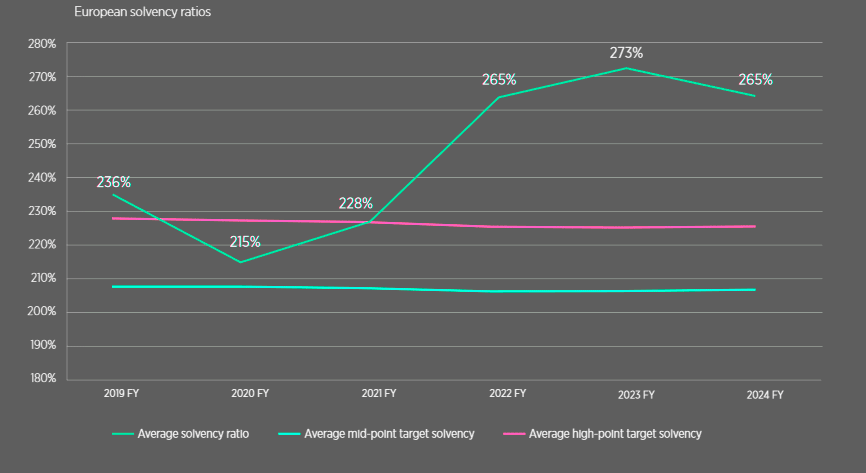
Among the top four European reinsurers, the average solvency ratio (or SST coverage in Swiss Re’s case) stood at 265% at the end of 2024, down from 273% a year earlier, yet still above the upper end of the target range.
In 2024, INDEX capital supply outpaced INDEX premium demand.
Reinsurance dedicated capital rises to a new peak
Within the subset of INDEX companies that disclose detailed figures, revenue rose 8.1% in 2024. This was due to higher rates in property and casualty reinsurance, while exposure growth remained limited as companies scaled back from the US casualty market (see TOP Global Reinsurance Companies Ranking by Country).
INDEX capital increased by $31.4bn to $629bn, driven by $59bn in retained earnings. This figure reflects net income of $117bn, of which $58bn was returned to shareholders.
Unrealized investment depreciation of $23bn, nearly all attributable to National Indemnity, partially offset this growth.
Economic capital adequacy remains strong
Net income of $117bn was supported by realized investment gains of $63.4bn at National Indemnity, up from $49.9bn in 2023.
Improved underwriting and stronger investment performance also contributed, with reinsurers benefiting from a 0.6 percentage point increase in running yield and positive gains yield.
INDEX companies distributed nearly half of their net income through dividends and share buybacks, which together totaled $58bn. There were no significant new entrants to the market despite favorable conditions (see TOP 50 Largest Global Reinsurance Groups in the World 2025).
The net effect of capital increases and debt reductions was limited to $0.2bn, down from $2bn at mid-year 2024 due to net debt reduction in the second half of the year.
Considering the projected profitability for 2025 and ongoing high levels of capital return, traditional reinsurance capital is expected to grow by more than 6%, or over $40bn, in 2025. This estimate assumes stable financial market conditions, with no material impact from unrealized investment gains or losses.
Global Reinsurers by Capital
| Rank | Reinsurer | Capital ($mn) |
| 1 | Munich Re | 40,446 |
| 2 | Swiss Re | 29,319 |
| 3 | Fairfax | 28,508 |
| 4 | Great-West Lifeco | 22,764 |
| 5 | Arch Capital | 20,82 |
| 6 | Markel | 16,929 |
| 7 | Hannover Re | 16,483 |
| 8 | General Re | 15,851 |
| 9 | Everest Re | 14,093 |
| 10 | China Re | 13,999 |
| 11 | QBE | 13,395 |
| 12 | AXA XL | 12,651 |
| 13 | RGA | 12,325 |
| 14 | MAPFRE | 12,026 |
| 15 | Pacific LifeCorp | 11,203 |
| 16 | RenaissanceRe | 10,574 |
| 17 | GIC India | 10,013 |
| 18 | Partner Re | 9,959 |
| 19 | WR Berkley | 9,417 |
| 20 | SCOR | 7,735 |
| 21 | Axis Capital | 6,511 |
| 22 | WMIG Ark | 5,286 |
| 23 | Transatlantic Re | 5,041 |
| 24 | Hiscox | 3,864 |
| 25 | Aspen | 3,372 |
| 26 | Arundo Re (formerly CCR Re) | 2,763 |
| 27 | DEVK Re | 2,659 |
| 28 | Fidelis | 2,630 |
| 29 | Convex | 2,619 |
| 30 | R&V Versicherung | 2,482 |
| 31 | QIC | 2,473 |
| 32 | Korean Re | 2,234 |
| 33 | SiriusPoint Re | 2,183 |
| 34 | RSUI Indemnity | 2,054 |
| 35 | Lancashire | 1,940 |
| 36 | Hamilton Re | 1,918 |
| 37 | Ascot | 1,869 |
| 38 | Toa Re | 1,842 |
| 39 | Somers Re | 1,346 |
| 40 | Peak Re | 1,282 |
| 41 | African Re | 1,066 |
| 42 | Conduit Re | 1,051 |
| 43 | PICC Re | 847 |
| 44 | Deutsche Re | 467 |
| Index aggregate | 628,916 | |
| National Indemnity | 240,606 | |
| Subset aggregate | 226,270 |
Global Reinsurers by Net Written Premium
| Rank | Reinsurer | Net Written Premium 2024 FY ($mn) |
| 1 | Munich Re | 63,989 |
| 2 | Swiss Re | 42,286 |
| 3 | National Indemnity | 33,423 |
| 4 | Hannover Re | 24,914 |
| 5 | MAPFRE | 22,972 |
| 6 | AXA XL | 19,746 |
| 7 | RGA | 17,843 |
| 8 | QBE | 17,316 |
| 9 | Everest Re | 15,814 |
| 10 | Arch Capital | 15,732 |
| 11 | Great-West Lifeco | 15,484 |
| 12 | Fairfax | 14,101 |
| 13 | SCOR | 13,694 |
| 14 | China Re | 12,705 |
| 15 | WR Berkley | 11,972 |
| 16 | RenaissanceRe | 9,952 |
| 17 | Markel | 8,296 |
| 18 | Partner Re | 7,940 |
| 19 | Pacific LifeCorp | 5,770 |
| 20 | Axis Capital | 5,757 |
| 21 | Korean Re | 4,771 |
| 22 | DEVK Re | 4,183 |
| 23 | GIC India | 4,081 |
| 24 | R&V Versicherung | 3,868 |
| 25 | Hiscox | 3,602 |
| 26 | Aspen | 2,943 |
| 27 | General Re | 2,935 |
| 28 | Ascot | 2,879 |
| 29 | Convex | 2,841 |
| 30 | Transatlantic Re | 2,784 |
| 31 | Fidelis | 2,395 |
| 32 | QIC | 2,362 |
| 33 | SiriusPoint Re | 2,352 |
| 34 | Toa Re | 1,854 |
| 35 | WMIG Ark | 1,679 |
| 36 | PICC Re | 1,375 |
| 37 | Deutsche Re | 1,330 |
| 38 | Lancashire | 1,326 |
| 39 | Peak Re | 1,321 |
| 40 | Somers Re | 1,315 |
| 41 | Arundo Re (formerly CCR Re) | 1,185 |
| 42 | Hamilton Re | 1,160 |
| 43 | RSUI Indemnity | 989 |
| 44 | African Re | 880 |
| 45 | Conduit Re | 720 |
| Index aggregate | 436,837 | |
| Subset aggregate | 251,576 |
Reinsurers’ combined ratio
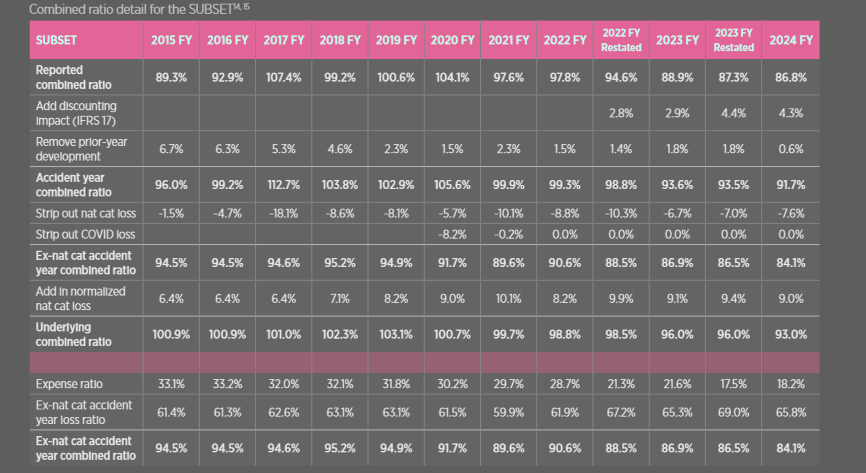
The combined ratio improved by 0.5 percentage points to 86.8%, driven by a 3.2-point drop in the ex-natural catastrophe accident year loss ratio, Beinsure noted.
However, this was partially offset by a 0.6-point increase from natural catastrophes, a 1.2-point reduction in reserve releases, and a 0.7-point rise in the expense ratio.
Reported and underlying combined ratios continued to reduce in 2024 FY
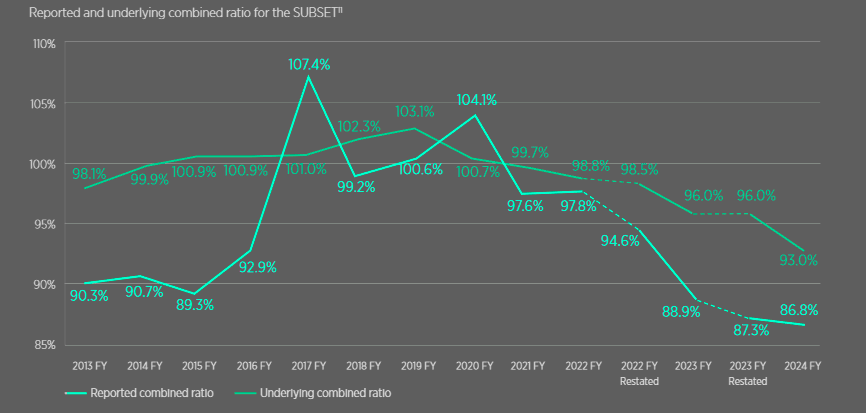
Reduction in reported combined ratios, driven by lower attritional losses
Underlying return on equity (ROE)
The industry recorded an underlying return on equity (ROE) of 13.9% for 2024, remaining well above the cost of capital.
The reported ROE for the subset reached 17%, slightly down from 19.5% in 2023.
Losses outside P&C reinsurance, such as SCOR’s life and health reserving and Everest’s primary P&C reserve strengthening, affected overall performance. Adjusting for these factors suggests the subset’s true underlying ROE stood near 15%.
Strong headline and underlying performance, but dampened by one-offs
Capital return as a percentage of earnings declined in 2024 to 50%, driven by a $45.3 bn reduction in dividends by National Indemnity.
- Excluding National Indemnity from both 2024 FY and 2023 FY, total capital return as a percentage of net earnings increased from 31% to 50%.
- Excluding National Indemnity, capital return in absolute terms in 2024 was up by 65% compared to 2023.
Strong reinsurers’ net income supports higher capital returns
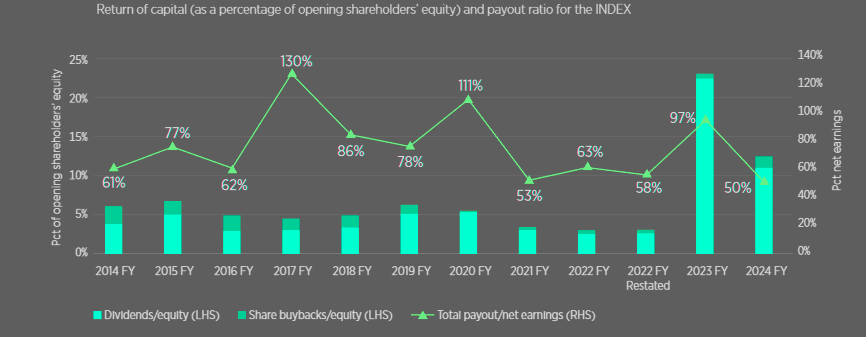
Excluding National Indemnity, capital return as a percentage of opening shareholders’ equity increased to 8% (2023 FY: 6%) as growth in capital return exceeded growth in opening shareholders’ equity.
As is usually the case, dividends were the main driver of capital returns. Albeit higher than 2023 FY, share buybacks remained modest at 1% of opening shareholders’ equity as management teams allocated capital to support growth in favorable market conditions.
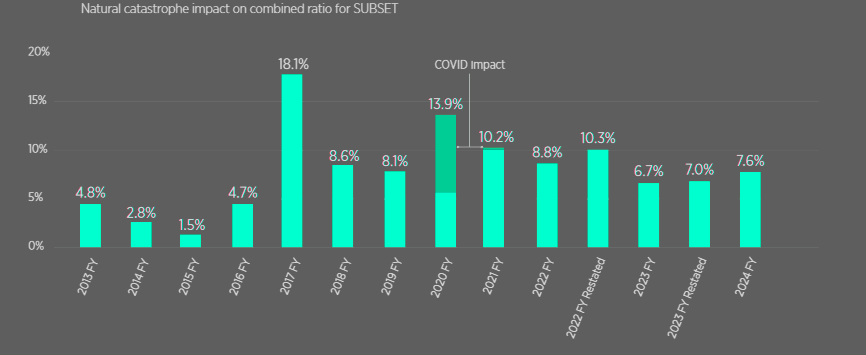
Natural catastrophe losses
Natural catastrophe losses for the year totaled 7.6%, below the normalized figure of 9%. While global insured natural catastrophe losses rose from $123bn in 2023 to $154bn in 2024, the subset absorbed a smaller share: 9.2% in 2022, 7.3% in 2023, and 6.9% in 2024.
This trend reflects increased attachment points and the type of recent catastrophe events. Prior-year development impacted the combined ratio by 0.6%, mainly due to Swiss Re’s $2.6bn reserve strengthening.
Excluding this, reserve releases improved the combined ratio by 2.5%, up 0.7 points on 2023, with property reserve releases more than offsetting US casualty reserve additions.
On an underlying basis, the combined ratio fell from 96% in 2023 to 93.0% in 2024—the best level since the Reinsurance Market Report was launched in 2014.
The effect of natural catastrophes on the combined ratio increased in 2024 FY
The improvement was mainly due to a lower ex-catastrophe loss ratio. With these results, the subset remains well positioned for 2025.
If natural catastrophe losses and investment returns remain at standard levels, the underlying ROE is expected to reach 15%, with a headline ROE of 18–19%.
These figures are approximately double the industry’s weighted average cost of capital.
Looking ahead, reinsurers maintain capacity to absorb higher-than-expected catastrophe losses.
Early 2025 has already seen significant events, with Southern California/Los Angeles wildfires producing estimated insured losses of $35–40bn.
Major reinsurers suggest these losses have used up 25–33% of their annual natural catastrophe budgets.
If these wildfire losses are in addition to normal events, the subset’s headline ROE could decline by 2–3 percentage points. Even in that case, it would remain above the cost of capital.
At the broader industry level, the impact from the SC/LA wildfires appears smaller, with an estimated reduction of 1.3 points to the headline ROE.
Overall, the industry remains in strong financial condition, supported by improved underlying profitability achieved over the past three years.
This sets the stage for another solid year in 2025, with traditional reinsurance capital expected to grow by 6% despite increased capital returns.
Impact of natural catastrophes on the combined ratio
Overall, the impact of natural catastrophes on the combined ratio increased 0.6ppts to 7.6% on average across the SUBSET, mainly driven by elevated catastrophe activity in the US. However, this number remains below the normalized catastrophe loss of 9%.
11 of the 16 SUBSET companies saw an increase in natural catastrophe losses. Most notably, the impact of natural catastrophes on the combined ratio increased substantially for Fidelis, WMIG Ark, and Arch Capital and currently exceeds 10% for all three companies.
The big four European reinsurers (Munich Re, Swiss Re, Hannover Re and SCOR) all reported natural catastrophe losses below their annual budgets for 2024 FY despite elevated catastrophe activity in the US.
Gallagher Re estimates that the private insurance market and public insurance entities covered $154 bn in losses from natural perils in 2024 FY, increasing from $123 bn as originally reported for 2023 FY.
This brings the annual average loss from natural catastrophes since 2017 to $146 bn, suggesting a “new normal” approaching USD150B per annum.
Over the recent past, SUBSET companies have carried a reduced proportion of these losses, from 9.2% in 2022 FY to 7.3% in 2023 FY and to 6.9% in 2024 FY (despite the higher impact of natural catastrophe losses on the combined ratio in 2024 FY relative to 2023 FY).
This trend reflects not only higher attachment points but also the nature of catastrophe losses in recent years, with a continued prevalence of so-called secondary-perils.
FAQ
At full-year 2024, global reinsurance dedicated capital reached $769bn, representing a 5.4% increase compared to the restated 2023 figure. Growth was supported by both INDEX companies and non-life alternative capital.
The reported combined ratio improved to 86.8% in 2024, down from 87.3% in 2023. The underlying combined ratio also improved to 93%, primarily due to a 3.2-point reduction in the ex-catastrophe accident year loss ratio.
The reported ROE for the subset of reinsurers was 17%, slightly down from 19.5% in 2023. The underlying ROE remained stable at 13.9%, with adjusted figures pointing to a normalized level of approximately 15%.
Natural catastrophe losses accounted for 7.6% of the combined ratio, below the normalized benchmark of 9%. Despite total global insured cat losses rising to $154bn, the subset of reinsurers absorbed only 6.9% of those losses, down from 7.3% in 2023 and 9.2% in 2022
Assuming normal levels of cat losses and stable markets, reinsurers are expected to deliver an underlying ROE of around 15% and a headline ROE of 18–19%, which would be about twice the industry’s average cost of capital.
The California/Los Angeles wildfires are estimated to result in $35–40bn of insured losses. If counted as incremental to normal cat budgets, this could reduce the headline ROE of the subset by 2–3 points, but overall ROE would still stay above the cost of capital.
Yes. Based on current profitability trends and investment returns, traditional reinsurance capital is expected to grow by 6% in 2025, even after factoring in higher capital return levels.
………………
AUTHORS: Michael van Wegen – Head of Client and Market Insights International,
Gallagher Re Global Strategic Advisory, Lara Mowery – Gallagher Re Chief Commercial Officer
Edited by Oleg Parashchak – CEO Finance Media Holding