
Overview
US Life Insurance Companies to see growth earnings in 2026 while wrestling with the impact of higher interest rates, a dynamic annuities sector and the commercial real estate market’s effect on investment portfolios. The Life & Health insurance industry’s admitted assets grew by 6% to $9,5 bn.
US Life insurers’ capital and short-term liquidity make them unlikely to be forced sellers of real estate assets at distressed valuations, any commercial real estate losses are expected to remain within ratings sensitivities
According to Beinsure Data, higher interest rates for life insurers put additional strain on borrowers’ ability to repay loans, and default rates on corporate debt in the US, though low, are beginning to rise. Corporate insolvencies are also increasing.
The US life & annuity sector experienced a 5.3% increase in total income during the 2025 compared to the same period. This growth stemmed from a 13.7% rise in premiums and annuity considerations and a 9.6% increase in net investment income.
Net investment income for the life/annuity segment increased by 10% in 2025 to $250 bn, slightly higher than the 9% year-over-year increase recorded in 2023. In addition, according to the report, Mortgage loan portfolios have grown considerably over the last decade, and at year-end 2024 accounted for 14% of invested assets.
Total expenses rose by 8.8%, driven by a $63 bn increase in surrender and other benefits. Despite these gains, the pretax net operating profit dropped 43% to $31.6 bn, while net income declined 30.5% to $21.7 bn due to reduced net realized capital losses, according AM Best’s Review.

- Prudential of America Group led Best’s Review’s Top 200 US Life/Health Insurers ranking, reporting $568.19 bn in 2024 admitted assets, which is $121.20 bn more than second-place New York Life Group.
- Northwestern Mutual Group’s admitted assets rose 5.4% to $378.45 bn, pushing the company into fifth place and moving TIAA Group to sixth despite a 1.2% increase to $367.98 bn.
- Pacific Life Group and Brighthouse Insurance Group exchanged positions, ranking 15th and 16th, respectively.
- CL Life & Annuity Insurance Co. recorded the largest increase in admitted assets among the 200 companies, rising 174.7% to $637.9 mn and moving to 174th place from 218th a year earlier.
- Federal Life Insurance Co. advanced from 206th to 167th with a 166.1% increase to $849.6 mn in assets.
- Venerable Holdings Group experienced the largest drop, with assets declining 13.2% to $41.00 bn and its rank falling from 41st to 45th.
- Gleaner Life Insurance Society saw a 12.3% decrease in assets, finishing in the 152nd position compared to 143rd the previous year.
- Genworth Financial Cos. dropped from 32nd to 35th place, the only insurer in the top 40 reporting a decline, with assets down 1.7% to $62.93 bn.
TOP 100 Largest Life & Health Insurers in the United States by admitted assets
| Rank | Company/Group | Total Assets ($’000) | % Change |
| 1 | Prudential of America Group | 568,189,539 | 6.9 |
| 2 | New York Life Group | 446,993,932 | 5.6 |
| 3 | MetLife Life Ins Companies | 414,849,940 | 0.1 |
| 4 | Massachusetts Mutual Life Group | 406,644,847 | 6.7 |
| 5 | Northwestern Mutual Group | 378,451,501 | 5.4 |
| 6 | TIAA Group | 367,981,623 | 1.2 |
| 7 | Corebridge Finl | 364,554,224 | 4.5 |
| 8 | Lincoln Finl Group | 313,032,183 | 6.7 |
| 9 | Jackson Natl Group | 300,149,158 | 4.8 |
| 10 | John Hancock Life Insurance Group | 294,684,772 | 3.1 |
| 11 | Equitable Life Group | 284,853,258 | 9.7 |
| 12 | Athene US Life Group | 284,781,867 | 17.3 |
| 13 | Nationwide Life Group | 265,370,311 | 10.0 |
| 14 | Principal Finl Group Inc. | 241,283,870 | 5.6 |
| 15 | Pacific Life Group | 219,957,778 | 8.3 |
| 16 | Brighthouse Ins Group | 210,462,535 | 0.9 |
| 17 | Aegon USA Group | 207,540,415 | 2.6 |
| 18 | Allianz Life Ins Group | 192,258,882 | 4.6 |
| 19 | Great-West Life Group | 188,508,102 | 8.1 |
| 20 | Global Atlantic Group | 184,959,784 | 16.1 |
| 21 | Voya Finl Group | 142,565,399 | 5.3 |
| 22 | Sammons Finl Group | 127,209,623 | 7.9 |
| 23 | Ameriprise Finl Group | 120,306,322 | 7.8 |
| 24 | Thrivent Finl for Lutherans | 117,953,918 | 3.9 |
| 25 | Talcott Resolution Group | 113,464,766 | 0.5 |
| 26 | Amer Natl Ins Companies | 103,387,299 | 7.3 |
| 27 | Protective Life Group | 103,175,105 | 5.7 |
| 28 | Guardian Life Group | 102,400,108 | 5.7 |
| 29 | State Farm Life Group | 98,256,454 | 3.8 |
| 30 | Western & Southern Finl Group | 75,957,661 | 7.4 |
| 31 | Group 1001 Life & Annuity Group | 67,320,699 | 8.7 |
| 32 | Securian Finl Ins Group | 66,347,594 | 2.6 |
| 33 | Fidelity & Guaranty Life Group | 66,183,636 | 16.4 |
| 34 | RGA Group | 65,215,888 | 8.9 |
| 35 | Genworth Finl Companies | 62,930,455 | -1.7 |
| 36 | Symetra Life Group | 60,722,375 | 7.2 |
| 37 | SBL Hldgs Group | 58,023,971 | 6.2 |
| 38 | Oneamerica Group | 51,762,846 | 6.5 |
| 39 | Fidelity Investments Group | 51,090,965 | 13.5 |
| 40 | Mutual of Omaha Group | 50,602,944 | 4.3 |
| 41 | Penn Mutual Group | 48,404,095 | 13.0 |
| 42 | ERAC Group | 48,367,290 | 0.7 |
| 43 | Natl Life Group | 47,056,335 | 11.4 |
| 44 | Meiji Yasuda US Life Group | 46,578,243 | 14.9 |
| 45 | Venerable Hldgs Group | 40,997,948 | -13.2 |
| 46 | Unum Ins Group | 40,966,943 | 1.5 |
| 47 | CMFG Life Group | 37,461,666 | 6.1 |
| 48 | Wilton Re Group | 37,397,885 | 5.5 |
| 49 | Resolution Life US Group | 34,700,074 | -0.6 |
| 50 | EquiTrust Life Ins Co | 33,576,723 | 23.5 |
| 51 | USAA Life Group | 32,490,954 | 6.7 |
| 52 | Aetna Life Group | 32,133,556 | 14.4 |
| 53 | CNO Group | 31,240,633 | 8.9 |
| 54 | Knights of Columbus | 31,194,633 | 2.9 |
| 55 | Fortitude Re US Group | 31,167,198 | -4.4 |
| 56 | Ameritas Life Group | 30,558,978 | 5.6 |
| 57 | Cigna Life Group | 30,255,569 | -3.1 |
| 58 | AuguStar Life Group | 29,305,447 | 4.5 |
| 59 | Tokio Marine US Life Group | 29,095,056 | 15.9 |
| 60 | Berkshire Hathaway Group | 28,268,382 | -5.0 |
| 61 | Kuvare US Group | 27,231,744 | 16.3 |
| 62 | Everlake Life Group | 25,913,096 | 0.3 |
| 63 | Mutual of America Group | 24,018,246 | -0.4 |
| 64 | UnitedHealth Life Companies | 23,802,153 | 0.6 |
| 65 | Globe Life Group | 23,485,534 | 1.7 |
| 66 | Prosperity Life Group | 23,344,019 | 0.6 |
| 67 | Sun Life Finl Group | 23,278,496 | -1.3 |
| 68 | Hannover Life Reassur America | 20,620,838 | 7.5 |
| 69 | Nassau Ins Group | 19,237,091 | 5.4 |
| 70 | Aflac U.S. Group | 19,149,195 | 3.6 |
| 71 | Modern Woodmen of America | 18,169,069 | 2.5 |
| 72 | Zurich Amer Life Group | 18,057,368 | 8.7 |
| 73 | Southern Farm Bureau Life Ins Co | 16,491,564 | 2.4 |
| 74 | Legal & Gen America Group | 13,611,194 | 16.9 |
| 75 | Swiss Re Life Group | 13,267,048 | -0.9 |
| 76 | Hartford Life & Accident Ins Co | 12,942,016 | -0.9 |
| 77 | Calton Hldgs Group | 12,047,109 | 37.5 |
| 78 | Axcelus Finl US Group | 11,620,710 | 18.8 |
| 79 | Oceanview Life & Annuity Co | 11,322,191 | 35.0 |
| 80 | Woodmen of the World Life Ins Society | 11,300,236 | 0.3 |
| 81 | Munich Amer Group | 11,056,102 | 6.9 |
| 82 | COUNTRY Finl Life Companies | 10,904,886 | 3.8 |
| 83 | Sentry Life Ins Group | 10,567,756 | 7.3 |
| 84 | Horace Mann Life Companies | 10,372,870 | 4.8 |
| 85 | SILAC Ins Group | 10,056,105 | -3.8 |
| 86 | Farm Bureau Life Group | 9,966,334 | 1.7 |
| 87 | Amer Fidelity Group | 8,367,311 | 3.6 |
| 88 | Americo Life Group | 8,186,620 | 6.4 |
| 89 | Aspida Life Ins Co | 7,905,081 | 156.6 |
| 90 | Advantage Capital Life Group | 6,529,809 | 12.2 |
| 91 | Sagicor Life Ins Co | 5,479,804 | 15.1 |
| 92 | Union Labor Life Ins Co | 5,424,996 | 9.8 |
| 93 | Cincinnati Life Ins Co | 5,281,772 | 1.7 |
| 94 | Amer Family Life Ins Co | 5,172,228 | -0.1 |
| 95 | AAA Life Group | 5,165,153 | 4.3 |
| 96 | Natl Guardian Life Ins Co | 5,129,325 | 4.0 |
| 97 | GBU Finl Life | 4,729,123 | 6.8 |
| 98 | Auto-Owners Life Ins Co | 4,674,208 | 0.9 |
| 99 | Continental Gen Ins Co | 4,615,310 | -2.5 |
| 100 | Physicians Mutual Companies | 4,447,575 | 1.6 |
| Top 200 Insurers | 9,233,983,117 | 5.8 | |
| Total U.S. Life/Health Industry | 9,248,860,523 | 5.8 |
While life insurers’ exposures to illiquid assets have been rising, it does not necessarily lead to unmeasured risks. Private and illiquid credit cannot be traded or sold and the lender is primarily exposed to default risk.
Mortgage loan holdings have nearly doubled in the last 10 years, although the quality of mortgages in good standing continues to deteriorate as economic conditions impact debt service coverage and loan-to-value ratios, in addition to residential mortgages constituting a greater share of the portfolio.
Kaitlin Piasecki, industry research analyst, Industry Research and Analytics, AM Best
Capital and surplus increased to $514.4 bn. Key drivers included $37.9 bn from net income, changes in unrealized gains, contributed capital, and other surplus changes, offset by $31.5 bn in changes to the asset valuation reserve and stockholder dividends.
US Life & Annuity – Financial Indicators
| Financial Indicators | 2024 ($ bn) | % Change |
| Premiums and Annuity Considerations | 795 | 13.7 |
| Net Investment Income | 223 | 9.6 |
| Commissions and Expense Allowances – Ceded | 30 | -16.6 |
| Other Income | 6 | -89.7 |
| Total Income | 1 055 | 5.3 |
| Death Benefits | 84 | -1.7 |
| Annuity Benefits | 100 | 6.7 |
| Surrender Benefits | 455 | 20.9 |
| Other Benefits | 259 | 3.6 |
| Total Incurred Benefits | 898 | 11.5 |
| Commissions and Expense Allowances – Direct & Assumed | 74 | 4.1 |
| General Insurance Expenses and Other | 104 | -4.4 |
| Net Transfers to Separate Accounts | -81 | 12.2 |
| Dividends to Policyholders | 20 | 3.5 |
| Total Expenses | 1 015 | 8.8 |
| Pretax Net Operating Gain | 39 | -43 |
| Federal and Foreign Taxes | 9 | -29.1 |
| Net Operating Gain | 30 | -46.1 |
| Net Realized Capital Gains/Losses | -3 | -80.5 |
| Net Income | 26 | -30.5 |
The majority of private credit lies in senior notes and term loans, but structured private credit, particularly collateralized loan obligations, has grown markedly,” said Jason Hopper, associate director, Industry Research and Analytics, AM Best.
“The amount of private credit on L/A insurers’ balance sheets, as well as the expertise required to manage the risk exposure of these holdings, raises the question of how much larger allocations to private credit can become.”
US Life & Annuity – Capital and Surplus
| Capital and Surplus Indicators | $ bn | % Change |
| Prior Year End Capital and Surplus | 635 | 4.9 |
| Net Income | 26 | -27 |
| Change in Unrealized Gains (Losses) | 5 | 340 |
| Change in Asset Valuation Reserve | -9 | 4.7 |
| Other Changes in Surplus | 8 | 2.7 |
| Contributed Capital | 6 | 63 |
| Stockholder Dividends | -20 | -1.2 |
| Ending Capital and Surplus | 643 | 4.0 |
| Change in C&S from Prior Year End ($) | 8 | |
| Change in C&S from Prior Year End (%) | 1 |
Cash and short-term investments grew by 11% from the end of 2025. The mortgage loan asset class maintained a consistent share of 12–14% of invested assets over the last five years.
Profitability is improving as well, with greater room for margins in new spread-based products and opportunity to reinvest assets backing legacy liabilities at a higher rate, according to Swiss Re sigma.
The surge in interest rates to 15-year highs significantly improves the outlook for life and annuity insurance. The global life insurance industry today looks very different to 15 years ago.
Low interest rates from 2008 until the inflation surge after 2021 put huge strain on the traditional life insurance business model of using balance sheet leverage and investment income to deliver contractual promises to policyholders.
US fixed annuity sales are projected to reach a new record this year, following a more than twofold increase in 2025 compared to any previous year before 2022.
Life insurer operating results and investment return, key markets
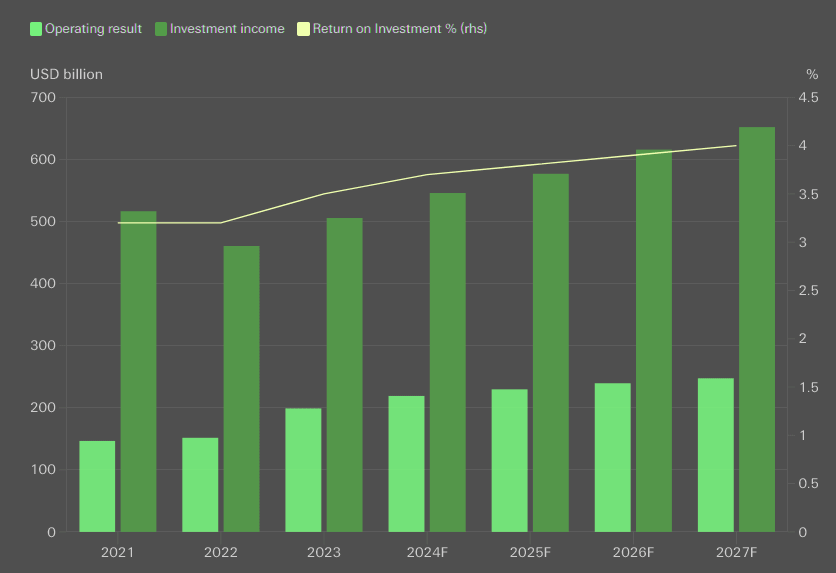
This demand boost should help mobilize the substantial private savings needed to narrow the retirement savings gap between current pension assets and the amount required for secure retirements, according to Top Trends in the Global Life Insurance Market.
US life insurers are expected to see growth during third-quarter earnings while wrestling with the impact of higher interest rates, a dynamic annuities sector and the commercial real estate market’s effect on investment portfolios.
FAQ
US life insurers are projected to see growth in earnings this year, even as they navigate the challenges posed by higher interest rates, a dynamic annuities sector, and the effects of commercial real estate on investment portfolios.
Prudential of America Group led Best’s Review’s Top 200 US Life/Health Insurers ranking, reporting $568.19 bn in 2024 admitted assets, which is $121.20 bn more than second-place New York Life Group
Higher interest rates have increased the pressure on borrowers, leading to a slight rise in default rates on corporate debt. Despite this, most US life insurers are well-capitalized with short-term liquidity, reducing the need to sell real estate assets at distressed prices.
Ibexis Life & Annuity Insurance recorded the largest growth, with a 317% increase in assets, moving it up from 240th to 176th place. Conversely, Farmers New World Life Insurance experienced a 57.8% decline, falling from 92nd to 128th position.
The rise in interest rates has spurred demand for fixed annuities, with sales expected to reach new records. This trend offers life insurers an opportunity to boost profitability through spread-based products and reinvestment of assets at higher returns.
……………
Edited & Fact-checked by Oleg Parashchak – CEO Finance Media & Editor-in-Chief at Beinsure Media and Insurance TOP Ratings (25+ years of professional experience in Rankings, Insurance & Media) by AM Best Data.