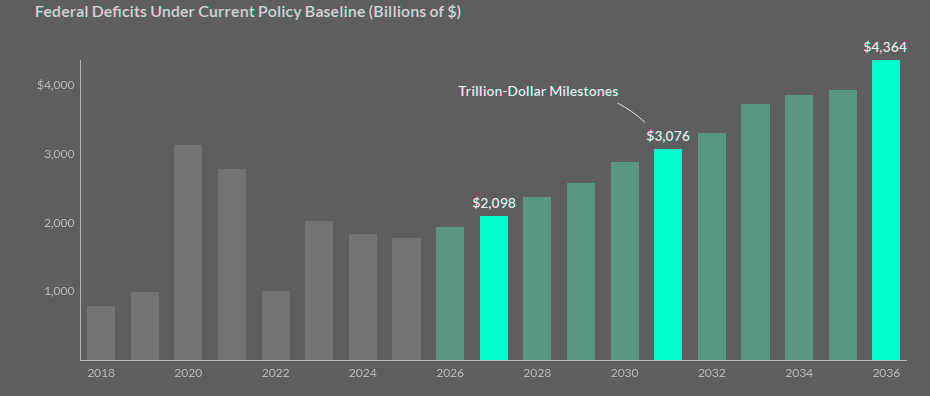
- Current-policy deficits reach $4.4 tn by 2036
- Debt reaches 137% of GDP in 2036 under the Brookings scenario
- Social Security, Medicare and interest account for much of the fiscal shift
- Social Security and Medicare shortfalls grow through 2036
- Brookings attributes the 30-year deficit to Social Security and Medicare shortfalls
- Spending-only budget balance requires broad reductions
- Holding debt near 100% of GDP requires changes equal to 4.3% of GDP
US federal finances face mounting pressure as debt, annual deficits and major trust fund shortfalls move closer to several fiscal deadlines. Gross federal debt passed $40 tn in August 2026, and debt held by the public remains near 100% of GDP. Social Security’s retirement trust fund is projected to exhaust its reserves in late 2032, followed by Medicare’s Hospital Insurance fund in 2033.
A 2026 chart book by Brookings Institution examines federal spending, taxes, deficits and debt using CBO, Treasury and other government data. It also presents a current-policy scenario differing from CBO’s statutory current-law baseline.
Those distinctions matter because expiring tax provisions, future tariffs and congressional spending decisions materially change the numbers.
A tax-only Social Security fix would lift the combined payroll rate above 16%, increasing annual costs for workers and employers as 2032 approaches.
Key highlights
- Social Security’s retirement trust fund faces a 2032 deadline. The Old-Age and Survivors Insurance Trust Fund is projected to exhaust its reserves in the fourth quarter of 2032. Continuing revenue would cover about 78% of scheduled retirement and survivor benefits under the trustees’ assumptions.
- A payroll-tax-only solution would require a substantial rate increase. The 2026 trustees estimate the combined Social Security payroll tax would need to rise immediately from 12.4% to 16.65% to address the projected 75-year shortfall. Other models put the required rate slightly above 17%. CBO projects Social Security’s retirement fund will run dry in 2032, leaving payroll revenue sufficient for only 74% of scheduled benefits.
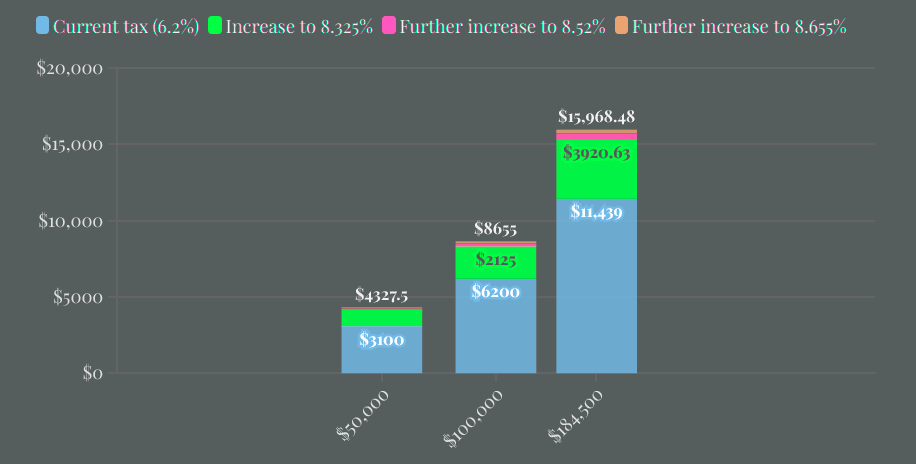
- Employees would see their 6.2% contribution move above 8% if employers and workers continued splitting the tax equally. Under estimates ranging from 16.65% to 17.31% combined, the employee rate would reach roughly 8.33-8.66%.
- Higher earners face another possible source of additional revenue. Social Security taxes currently apply to the first $184,500 of wages in 2026, and lawmakers have discussed raising or removing this ceiling rather than increasing the rate for earnings below it.
- Congress has several financing structures available, but each distributes costs differently. A higher payroll rate spreads additional taxes across most covered workers, whereas increasing the taxable earnings ceiling concentrates more of the additional revenue on workers earning above the current limit. Changes to future benefits represent another route.
Current-policy deficits reach $4.4 tn by 2036

CBO’s February baseline projects the federal deficit rising from $1.9 tn in 2026 to $3.1 tn in 2036, equal to 6.7% of GDP. CBO must generally construct its baseline around current law, including scheduled expirations of temporary tax provisions, according to Peter G. Peterson Foundation’s research.
Riedl adjusts that baseline to assume Congress extends temporary tax cuts and maintains current spending patterns. Brookings scenario also assumes tariffs introduced under President Donald Trump phase down after his presidency.
Under those assumptions, the annual deficit reaches roughly $4.4 tn in 2036 rather than CBO’s $3.1 tn. A tax-only Social Security fix would lift the payroll rate from 12.4% to about 17%, adding $2,600 to $3,000 yearly for a median worker.
Social Security payroll tax scenarios
| Scenario | Combined payroll tax | Employee share if split equally | Employer share |
| Current law | 12.40% | 6.20% | 6.20% |
| 2026 trustees estimate | 16.65% | 8.33% | 8.33% |
| Cato model | 17.04% | 8.52% | 8.52% |
| CBO-based estimate cited by Cato | 17.31% | 8.66% | 8.66% |
The figures above assume the existing arrangement remains in place, with employers and employees formally paying equal shares. Self-employed workers generally pay the full combined Social Security rate themselves.
The gap between those estimates doesn’t represent conflicting arithmetic. They answer different questions. CBO estimates the path under laws currently on the books, whereas Riedl models a scenario in which lawmakers continue several existing policies beyond their scheduled expiration dates.
Deficits will exceed $4 tn by 2036 under current policy
Debt reaches 137% of GDP in 2036 under the Brookings scenario
CBO projects debt held by the public at 120% of GDP in 2036, up from about 101% in 2026. Its long-term baseline then places debt at 175% of GDP by 2056 under current law.
The current-policy assumptions produce a steeper path. Extending temporary tax cuts, keeping discretionary spending near 6% of GDP and preventing smaller mandatory programs from shrinking relative to the economy pushes debt to about 137% of GDP in 2036.
Over 30 years, the difference grows wider. Brookings estimates debt at 243% of GDP by 2056 under its current-policy scenario, compared with CBO’s 175% current-law projection.
Federal debt could be even worse than what is currently projected
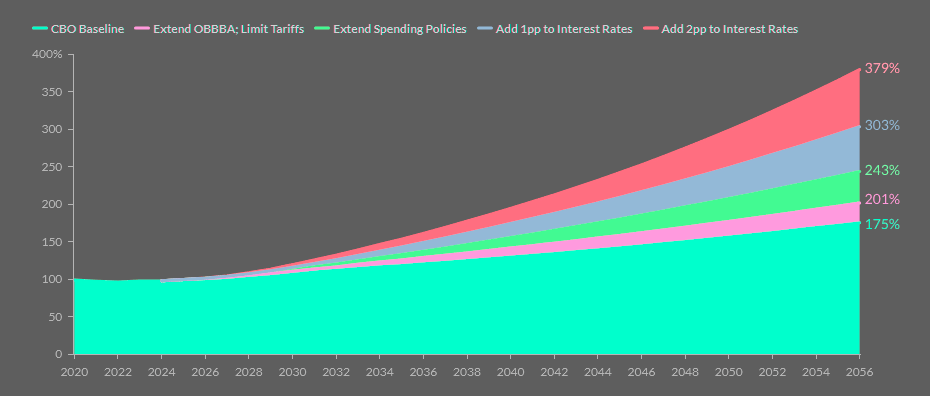
Interest rates add another variable. Riedl calculates that a long-run federal borrowing rate reaching 5.2% instead of CBO’s assumed 4.2% would raise debt to about 303% of GDP by 2056.
Another percentage point would raise the scenario to 379% of GDP. These figures are scenario estimates rather than CBO forecasts, and their outcomes depend heavily on future fiscal policy and borrowing costs.
Estimated additional annual employee tax
| Annual earnings | At 16.65% combined | At 17.04% combined | At 17.31% combined |
| $50,000 | $1,063 | $1,160 | $1,228 |
| $100,000 | $2,125 | $2,320 | $2,455 |
| $184,500 | $3,921 | $4,280 | $4,529 |
These estimates show only the employee’s additional direct contribution, assuming workers and employers continue splitting the payroll tax equally. An employer would pay approximately the same additional amount for each worker under that structure.
Social Security, Medicare and interest account for much of the fiscal shift
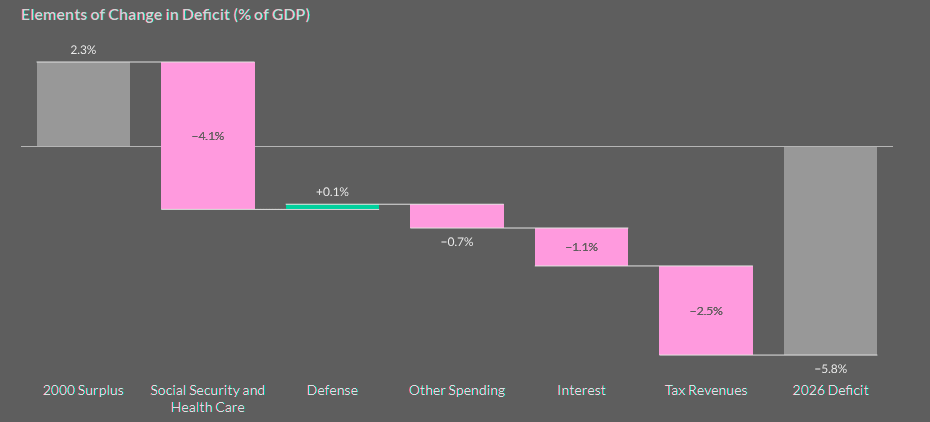
The federal government recorded a budget surplus equal to 2.3% of GDP in 2000. CBO now projects a 2026 deficit equal to 5.8% of GDP, with higher mandatory spending and interest costs accounting for much of the change over time.
Population aging has increased Social Security and Medicare spending as the number of beneficiaries rises. Health spending per person has also increased over long periods, and higher federal debt has pushed net interest costs upward.
Tax legislation and weaker revenue relative to spending have contributed as well. The fiscal change since 2000 therefore comes from several sources rather than one program or law.
The deficit has ballooned since 2000 due to Social Security, health care programs, and tax cuts
Net interest spending already represents a large part of the federal budget. CBO projects interest costs rising from 3.3% of GDP in 2026 to 4.6% in 2036, reaching $2.1 tn annually by the end of the 10-year window.
Social Security and Medicare shortfalls grow through 2036
Riedl’s calculations separate the annual financing gaps associated with Social Security and Medicare from the rest of the budget. In her current-policy scenario, transfers needed to finance those programs rise sharply over the next decade.
For 2026, the analysis attributes about $875 bn of the projected deficit to general revenue transfers associated with Social Security and Medicare, including related interest costs. Other federal policies account for roughly $1.1 tn.
By 2036, the Social Security and Medicare component reaches about $2.7 tn, compared with roughly $1.6 tn for the rest of the federal budget. Under this accounting method, growth in those program shortfalls accounts for most of the increase in annual deficits through 2036.
Social Security and Medicare are driving the projected $138 tn deficit projected over the next 30 years
Social Security’s Old-Age and Survivors Insurance fund faces the earlier deadline.
The 2026 trustees project reserve depletion in the fourth quarter of 2032, after which continuing program income would cover 78% of scheduled retirement and survivor benefits under current law.
Medicare’s Hospital Insurance trust fund faces reserve depletion in the second quarter of 2033. The trustees estimate dedicated revenue would cover 89% of scheduled Part A costs at depletion.
Brookings attributes the 30-year deficit to Social Security and Medicare shortfalls
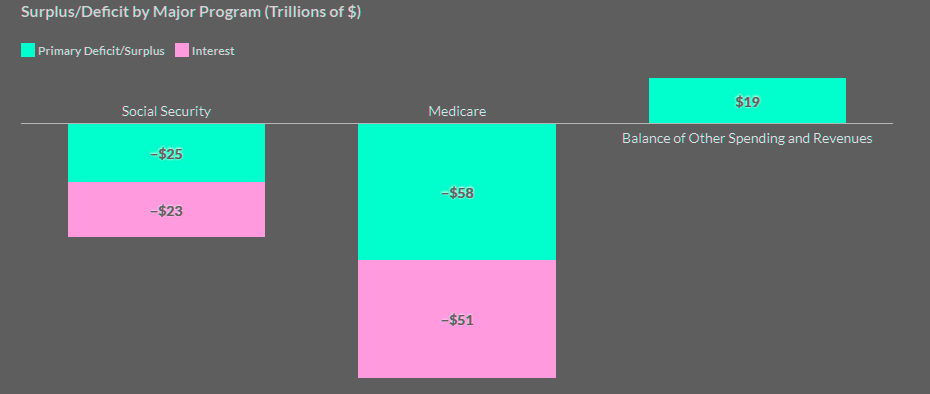
CBO’s baseline produces about $138 tn in cumulative nominal federal deficits between 2026 and 2056.
$48.3 tn of that amount to Social Security and $108.8 tn to Medicare, including interest costs directly associated with their annual financing gaps.
Together, those two programs produce a $157 tn shortfall under this framework. The remainder of the federal budget produces a $19.3 tn surplus, leaving the combined federal deficit near $138 tn.
This result depends on the chart book’s accounting method. Riedl treats benefits financed beyond dedicated payroll taxes, premiums and other non-interest program revenue as requiring general federal revenue, then assigns related interest costs to those programs.
The analysis therefore doesn’t mean every dollar of future federal borrowing legally belongs to Social Security or Medicare.
It shows how Riedl allocates projected deficits when comparing dedicated program revenue with scheduled benefits and the borrowing costs associated with the gap.
Main Social Security funding dates
| Measure | 2026 trustees projection |
| OASI reserve depletion | Q4 2032 |
| Benefits payable after OASI depletion | 78% of scheduled benefits |
| Implied OASI funding gap at depletion | 22% |
| Combined OASI and DI reserve depletion | Q3 2034 |
| Combined benefits payable at depletion | 83% |
| Disability Insurance reserve outlook | Full scheduled benefits through 2100 |
| 2026 taxable earnings maximum | $184,500 |
Spending-only budget balance requires broad reductions
Riedl also tests what balancing the federal budget by 2036 through spending cuts alone would require. Her current-policy baseline produces unusually large reductions under every version of that exercise.
An equal reduction across federal programs would require cuts averaging 36%. Excluding Social Security and Medicare pushes the required reduction across remaining programs to 69%.
Protecting veterans’ programs as well raises the reduction to 80% across everything left. Excluding defense too produces a required cut above 100%, meaning the remaining categories don’t contain enough spending to close the full deficit.
Those figures illustrate the scale of a spending-only approach under Riedl’s assumptions rather than a proposed federal budget. Different protections, revenue policies and baseline assumptions would produce different results.
How much could higher Social Security Tax rates cost workers?
Holding debt near 100% of GDP requires changes equal to 4.3% of GDP
Brookings estimates that stabilizing debt held by the public near 100% of GDP would require annual tax increases or spending reductions equal to about 4.3% of GDP by 2036 under its current-policy baseline.
Lower borrowing would then reduce interest costs by another 1.4% of GDP, bringing the total fiscal improvement to about 5.7% of GDP in 2036. The direct policy adjustment rises to 5.1% of GDP by 2056, with interest savings lifting the total improvement to 10.8% of GDP.
The scale becomes clearer against major budget categories. CBO projects individual income tax receipts near 9% of GDP around the end of the next decade, while discretionary spending falls below 5% of GDP in its current-law baseline.
No single calculation determines how Congress would distribute an adjustment of this size. Spending reductions and revenue increases produce different effects across households, businesses and federal programs, and the timing of changes alters the required annual amount.
The official CBO baseline remains less severe than several scenarios in Riedl’s chart book, yet it still projects debt rising to 120% of GDP in 2036 and 175% by 2056.
Brookings’ current-policy assumptions raise those figures because the analysis assumes several temporary policies continue rather than expire.
Both sets of projections depend on economic conditions, interest rates and future legislation. Their shared finding is narrower: under current projections, federal spending remains above revenue for decades and debt continues rising relative to the economy without changes to taxes, spending or both.
FAQ
Will Social Security disappear in 2032?
No. Payroll taxes and other dedicated revenue would continue flowing into Social Security after the OASI trust fund exhausts its reserves. The problem is that projected revenue would cover about 78% of scheduled retirement and survivor benefits under the 2026 trustees’ assumptions.
Does the 22% figure mean Congress has already approved a benefit cut?
No legislation has established a 22% across-the-board reduction. The figure represents the difference between scheduled OASI benefits and the amount projected to be payable from continuing program income after trust fund reserves reach zero under current law.
How high would Social Security payroll taxes need to rise?
The 2026 trustees estimate an immediate combined rate of 16.65% would address the projected 75-year actuarial shortfall. Cato’s model estimates 17.04%, while a CBO-based estimate cited by Cato reaches 17.31%, with differences resulting from separate demographic and economic assumptions.
What would a 16.65% payroll tax mean for employees?
If employers and employees continued dividing the tax equally, each side would pay roughly 8.33% instead of 6.2%. A worker earning $100,000 would therefore pay about $2,125 more annually in direct Social Security payroll tax.
Could Congress tax higher earners instead of raising everyone’s rate?
Congress could increase the amount of wages subject to Social Security tax. The 2026 taxable maximum is $184,500, meaning wages above that amount currently escape the Social Security payroll tax, although Medicare payroll taxes follow different rules. One proposal examined by CBO would resume the 12.4% Social Security tax on earnings above $250,000. CBO estimated that version would reduce federal deficits by about $1.43 tn between 2025 and 2034.
Would removing the payroll tax cap solve the entire Social Security shortfall?
The result depends on the design. Removing the ceiling without granting additional benefits on newly taxed earnings raises more net revenue than a structure giving workers additional future Social Security benefits in return for those taxes.
Why does acting later change the size of the required tax increase?
A later policy change leaves fewer years to collect additional revenue before reserves disappear. The 2026 trustees estimate an immediate increase to 16.65% under a tax-only approach, whereas delaying an equivalent response until the combined trust funds approach depletion would require a larger rate adjustment.
…………………….
AUTHOR: Jessica Riedl – Fellow at Economic Studies, Urban-Brookings Tax Policy Center
Edited by Tetiana Mykhailova – Commercial Director of Finance Media, CFO Beinsure Media, Yana Keller – Lead Insurance Editor at Beinsure