Overview
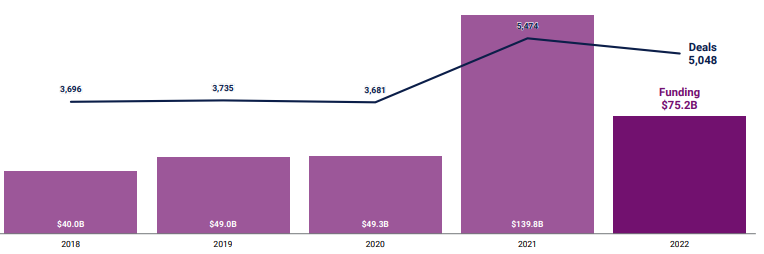
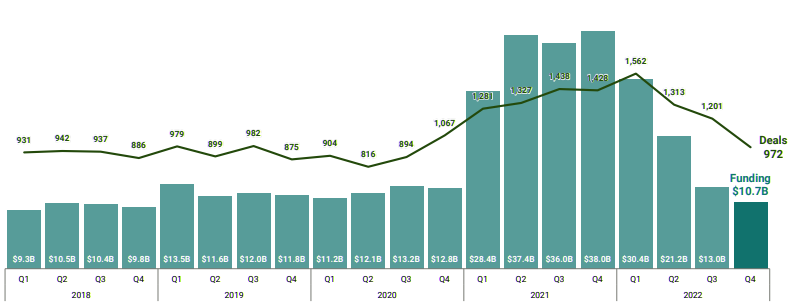
Global fintech funding reached $75.2B in 2024 — marking a 46% drop from 2021, but up 52% compared to 2020. The funding slowdown was especially severe in the second half of the year, with Q4’24 funding clocking in at $10.7B — the lowest quarterly level since 2018, according to CB Insights’ State of Fintech Report.
Beinsure Media has collected the opinions of fintech experts and presents a Global finTech and insurtech investment trends.
Total US fintech funding
While total fintech funding globally was down markedly last year compared to 2021, numbers were still higher than 2020.
Global fintech funding amounted to $75.2 billion in 2023, down 46% compared with 2021, but up 52% compared to 2020. The second half of the year was especially bleak.
Only $10.7 billion of investment dollars went to fund fintech startups in the fourth quarter. About $3.2 billion of that, or nearly 30%, flowed into U.S.-based companies.
FinTech and InsurTech sectors have experienced significant growth in funding and investment. Here’s a concise overview:
- Funding Surge: The FinTech and InsurTech industries have seen a substantial increase in funding, driven by rising demand for digital financial services and innovative insurance solutions.
- Key Players: Major investors include venture capital firms, private equity funds, and institutional investors, all seeking high returns from disruptive technologies.
- Geographic Hotspots: North America and Asia dominate the funding landscape, with notable contributions from Europe and emerging markets.
- Innovative Technologies: Investments often target companies leveraging AI, blockchain, and big data to enhance financial and insurance services.
- Market Trends: The focus has shifted towards customer-centric solutions, emphasizing user experience, automation, and personalized offerings.
- Regulatory Influence: Evolving regulations play a crucial role, with many startups adapting to compliance requirements to attract investors.
- Future Outlook: The sectors are expected to continue growing, driven by technological advancements and increasing consumer acceptance of digital financial solutions.
These trends highlight the dynamic nature of FinTech and InsurTech, reflecting their potential to reshape the financial and insurance landscapes.
Global fintech funding falls 46%, deals fall 8%
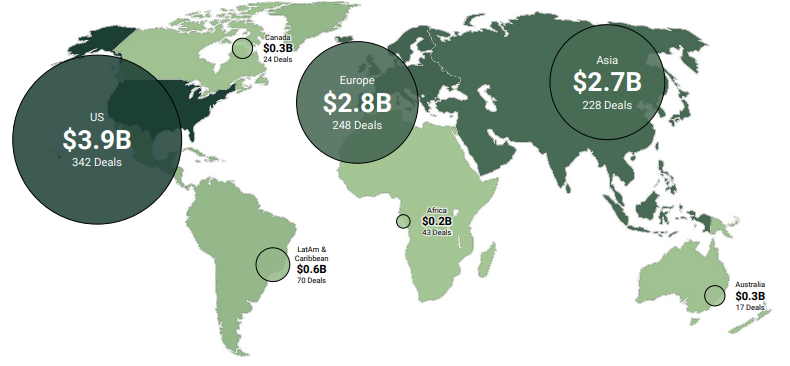
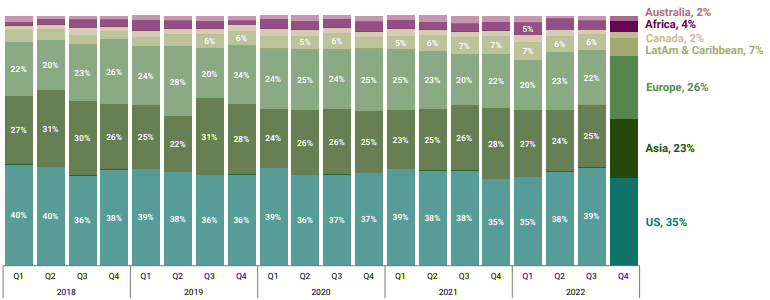
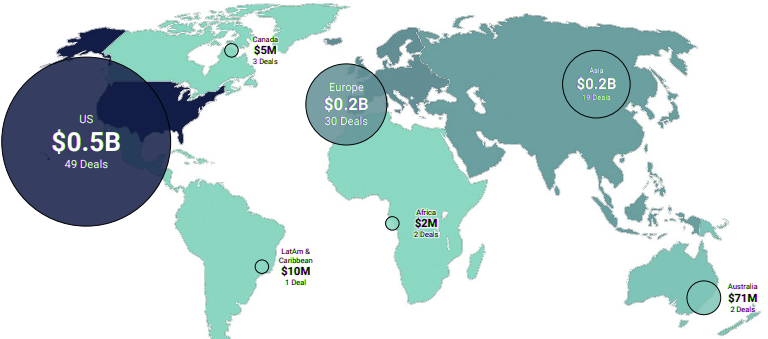
The US leads in funding and deals, followed by Europe and Asia in Q4’22
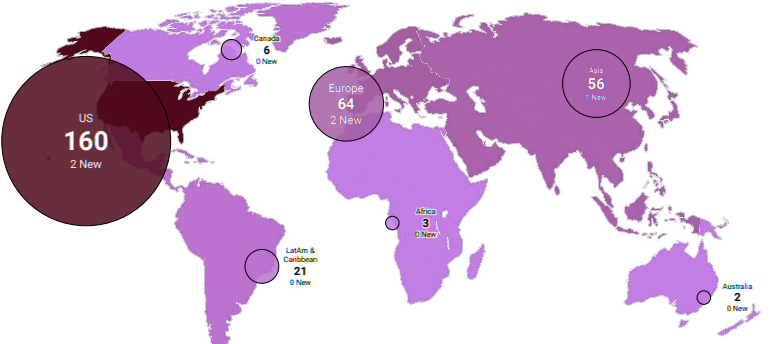
US has more total unicorns than all the other regions combined
Global: Top 10 Fintech unicorns by valuation
- 1 Stripe – $95.0B / United States
- 2 Checkout.com – $40.0B / United Kingdom
- 3 Revolut – $33.0B / United Kingdom
- 4 Chime – $25.0B / United States
- 5 Ripple – $15.0B / United States
- 6 Blockchain.com – $14.0B / United Kingdom
- 7 Plaid – $13.5B / United States
- 8 OpenSea – $13.3B / United States
- 9 Devoted Health – $12.6B / United States
- 10 Brex – $12.3B / United States
Global venture funding & deal
Global venture funding reached $415.1 billion in 2022, marking a 35% drop from a record 2021.
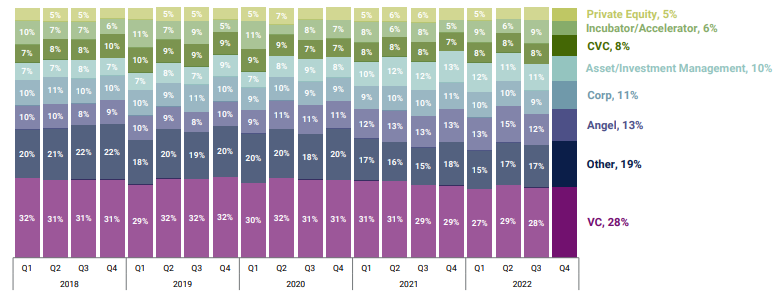
VCs continue to lead investor deal share in Q4’22
Fintech deal volume fell 8% globally year-over-year to 5,048 in 2022. Notably, Africa was the only major region to see deals climb compared to 2021 — with a record 227 deals in 2022, a 25% increase year-over-year.
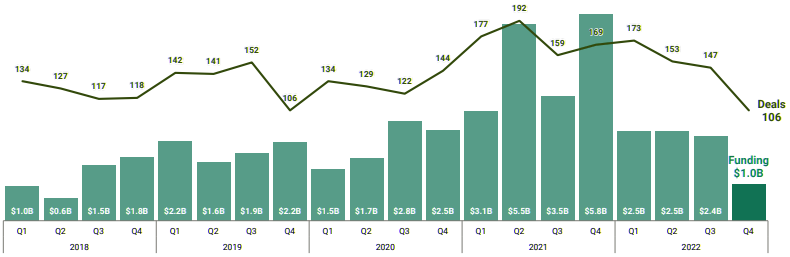
Q4’22 funding falls to 2018’s levels, deals fall to 2020’s levels
A staggering 89% of 2022 deals in Africa were early-stage — a five-year high for the continent and the highest among all other regions.
In the U.S., fintech funding in 2022 was down 50% to $32.8 billion. Yet deal size was only down 9%, signaling another trend we saw last year: early-stage deal share continued to dominate. On the flip side, mega round funding and deals fell 60% and 52% year-over-year, respectively.
The US continues to lead deal share, Europe and Asia follow
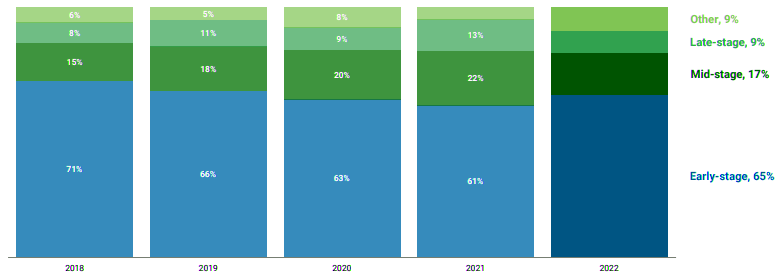
2021 was a unique year that resulted from digital transformation needs during the pandemic. However, on the positive side, 2022 numbers were higher than 2020.
Therefore, investors did not shy away from giving capital. Instead, funding was given more to smaller, earlier-stage deals versus bigger, later-stage deals like we saw in 2021.
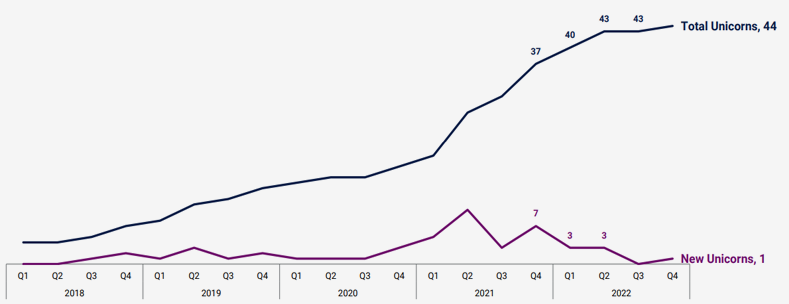
Notably, the world saw a drastic decline in the number of new unicorns in 2022. Fintech specifically saw a total of just 69 total unicorn births in 2022, a huge drop (58%) compared to 166 births in 2021.
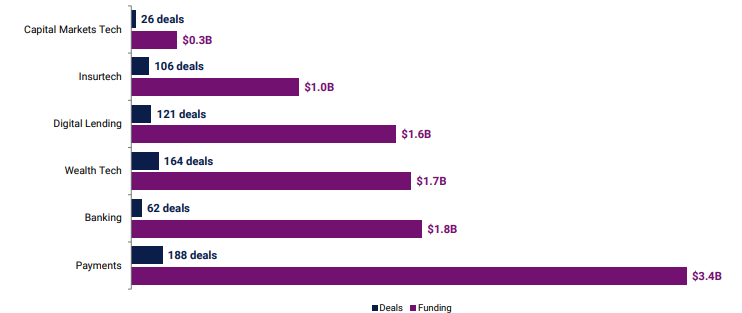
Payments lead in total funding and deals
This drop in unicorn births for fintech was actually smaller than what we saw for all VC-funded companies in 2022. Unicorn births for all VC-backed companies dropped 86% year-over-year.
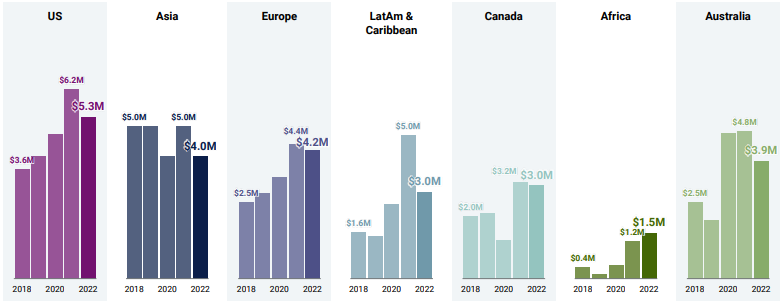
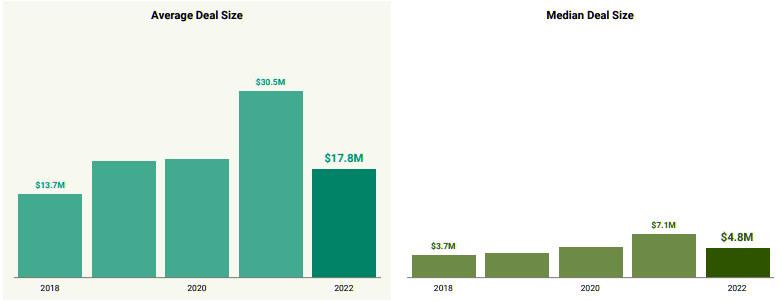
Median deal size falls in all regions except Africa
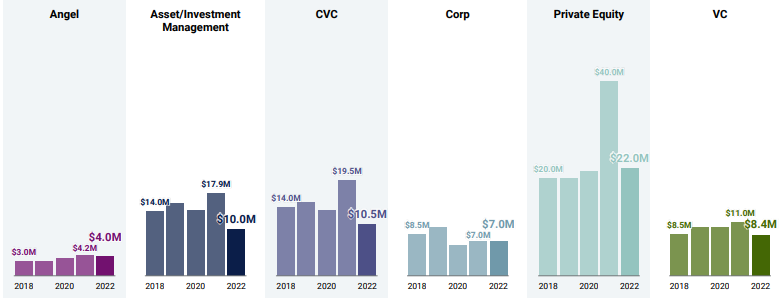
Median deal size flattens for corporations, all other investor categories fall
Decrease in capital markets tech funding
Capital markets tech funding declined 39% YoY from $3.8B in 2021 to $2.3B in 2022. This was the lowest percentage drop in funding for any fintech sector analyzed.
Meanwhile, deals to companies in the sector fell to a 5-year low of 119 in 2022.
Highlights include:
- $100M+ mega-rounds accounted for $36.5B in funding in 2022, marking a 60% drop from 2021.
- Banking funding declined 63% YoY — the sharpest drop across fintech sectors analyzed — to return to pre-Covid levels.
- US fintech funding fell 50% YoY to $32.8B. Despite the drop, 2022 was the second-highest funding year for US fintechs on record.
- Africa-based fintechs saw a record 227 deals in 2022, a 25% increase YoY.
- Insurtech M&A exits reached a new high, rising 40% in 2022 to 81 deals.
- Fintech unicorn births steadily declined throughout 2022, sinking to a low of 5 new unicorns in Q4’22 — an 87% drop compared to Q4’21.
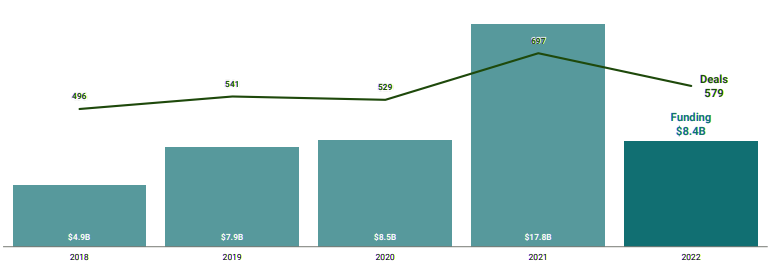
Funding to LatAm & Caribbean-based fintechs dropped 71% from $13.9B in 2021 to $4B in 2022. This was the greatest percentage drop in fintech funding for any region YoY. However, deals only fell 5% YoY – the lowest regional drop along with Canada.
Insurtech M&A exits
Insurtech M&A exits rose 40% in 2022 to 81, up from 58 in 2021. Despite a poor showing in the public markets, insurtech was the only fintech sector to see a year-over-year increase in M&A exits.
Overall, global fintech M&A exits declined 20% YoY to a total of 742. This also coincided with a 72% YoY drop in fintech IPOs, from 82 in 2021 to 23 in 2022. There were no IPOs or SPACs in the insurtech space in all of 2022 for the first time since the second quarter of 2020.
Insurtech funding drops 53%, returning to 2020’s level
Insurtech Funding at lowest level since Q2’18, deals at lowest level since Q4’19
According to Global InsurTech Data Highlights, the aforementioned hardship has resulted in a number of different InsurTech businesses being forced to make some decisions that would have been previously unthinkable, even as recently as in the last 12 months.
Several businesses have publicly laid staff off, and in more extreme cases, been forced to shut shop. At the end of 2019, there were nearly 3,000 global InsurTech businesses. We estimate that currently there are 2,050 businesses that are actively open for business.
The US leads with half of the quarter’s total global funding
With the downturn of investment came the revision of company values and a rethinking of what ‘success’ should mean in a more conservative environment. As a direct result, the ability to leverage individual company equity for loss-propping risk capacity became increasingly difficult, and several InsurTechs had some very challenging decisions to make as they reviewed their own margins and likelihood of (near term) future rounds.
Average deal size falls 42%, median deal size down 32%
Early-stage deal share continues to dominate in 2022
As mentioned in prior reports, some of the InsurTech company ‘restructuring’ is simply streamlining redundant positions (which is completely normal in a fast-paced business where some roles are no longer required), but it is also a sign of belt buckling, a pulling back on valuation peacocking (hiring lots of staff prior to an investment round can artificially increase a company’s ‘value’), and in many cases an unclear view on the next significant financial event (see How Insurers and InsurTechs Can Transform Insurance Platforms?).
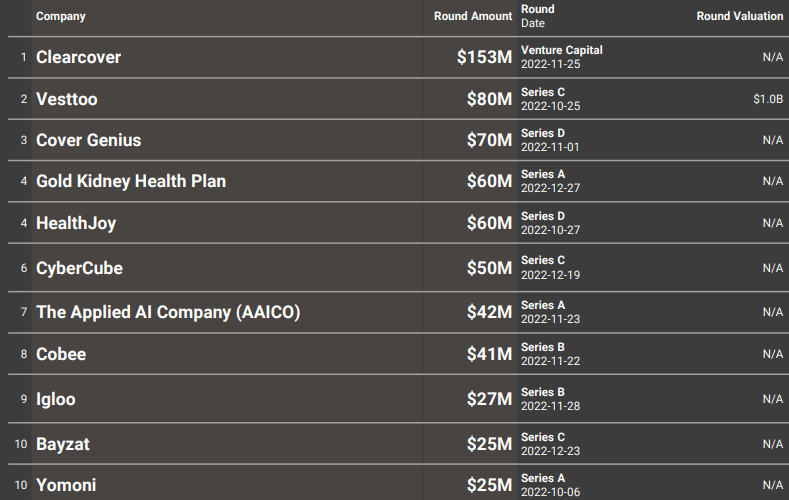
Insurtech: Top equity deals
It is estimated that from some of the largest and most established tech firms, approximately 120,000 layoffs across close to 800 companies has been recorded in the second half of 2022 (see How InsurTechs & Tech-Driven Innovation Changing the Insurance?).
The current risk capacity market is also applying pressure to the squeeze being felt by many (in terms of costs, margin returns and availability to support originated business from an ‘InsurTech player’ where so many incumbent risk partners have been historically burnt).
1 quarterly insurtech unicorn birth brings the total herd to 44
Whereas venture capital historically preceded risk capital commitments, VCs are now looking to see that (re)insurers are actually going to come to the table (first in some cases) before writing a cheque. Understandably this has created a chicken and egg type situation for a number of InsurTechs looking to raise money in this environment.
What is possibly the most significant feature of 2022 (as we review the ‘key events’ of each year leading up until this point) is that the narrative around ‘disruption’ seems to be truly over.
What is included in Report:
Equity financings into private companies only. Funding rounds raised by public companies of any kind on any exchange (including Pink Sheets) are excluded from our numbers, even if they received investment from a venture firm.
Only includes the investment made in the quarter for tranched investments. If a company does a second closing of its Series B round for $5M and previously had closed $2M in a prior quarter, only the $5M is reflected.
Round numbers reflect what has closed, not what is intended. If a company indicates the closing of $5M out of a desired raise of $15M, our numbers reflect only the amount which has closed. Only verifiable fundings are included.
Fundings are verified via (1) various federal and state regulatory filings; (2) direct confirmation with firm or investor; (3) press release; or (4) credible media sources. Equity fundings to joint ventures and spinoffs/spinouts are included.
Unicorn data includes private companies valued at $1B or more in the private markets globally, per the same 4 sources listed above and relied on for funding events, which include valuations disclosed in credible media sources.
………………..
Fact checked by Oleg Parashchak