Overview
The Bloomberg Billionaires Index ranks the world’s richest people globally, updating their net worth daily based on stock market performance, economic conditions.
Beinsure Media analyzed Bloomberg’s data and compiled a world’s billionaires ratings as of October 2025.
The latest global rankings of individual net worth highlight a clear trend: technology continues to be the leading driver of extreme wealth.
Top 10 Billionaires by Net Worth in 2025
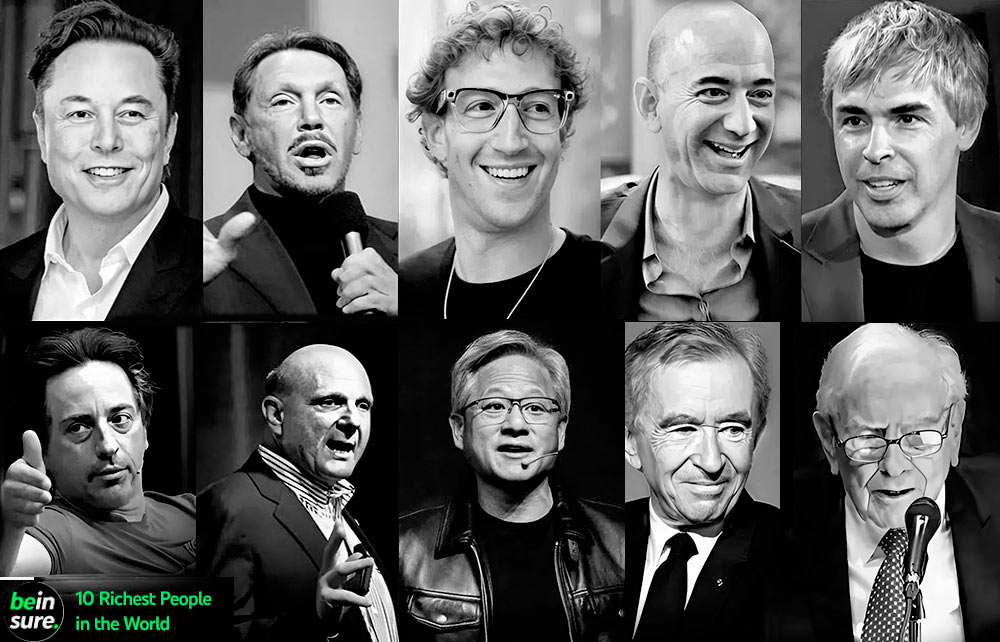
As of September, 2025, the wealthiest individual in the United States is Elon Musk with an estimated fortune of $472 bn, built through Tesla, SpaceX, and his wide-ranging bets on advanced technology. In second place is Larry Ellison at $342 bn, whose fortune comes from Oracle’s dominance in enterprise software and a sizable investment in Tesla.
Mark Zuckerberg holds third position with $264 bn, reflecting Meta’s strong performance in social platforms, virtual reality, and artificial intelligence. Jeff Bezos remains in the top tier with $252 bn, as Amazon continues to shape global e-commerce, logistics, and cloud services.
Total net worth of the top 100 billionaires in the United States amounts to an estimated $4.4 tn in 2025. This extraordinary concentration of wealth underscores the dominance of a few industries that continue to shape the global economy.
Google co-founder Larry Page ranks fifth with $233 bn, while Sergey Brin follows closely with $218 bn, both benefiting from Alphabet’s vast reach in AI, cloud computing, and digital advertising. Former Microsoft CEO Steve Ballmer holds $186 bn, securing the seventh spot thanks to his Microsoft shares and ownership of the Los Angeles Clippers. Bernard Arnault holds $197 bn.
Nvidia CEO Jensen Huang, at $174 bn, ranks eighth as demand for AI chips drives record growth. Michael Dell, a fortune built on Dell Technologies and investments in enterprise infrastructure sits ninth with $166 bn, his wealth tied to Berkshire Hathaway’s diversified portfolio. Completing the top ten is Legendary investor Warren Buffett with $145 bn.
This list highlights how American wealth is concentrated in technology and diversified investment, with most of the top fortunes tied to breakthroughs in software, AI, and global commerce.
Billionaires List by Country in 2025
- Richest People in the United States
- Richest People in the United Kingdom
- Richest People in Canada
- Richest People in Australia
- Richest People in China
- Richest People in France
- Richest People in Germany
- Richest People in Hong Kong
- Richest People in Italy
- Richest People in Sweden
- Richest People in Switzerland
- Richest People in India
- Richest People in Indonesia
100 Richest People by Net Worth in 2025
| Rank | Name | Net worth | Industry |
| 1 | Elon Musk | $472B | Technology |
| 2 | Larry Ellison | $342B | Technology |
| 3 | Mark Zuckerberg | $264B | Technology |
| 4 | Jeff Bezos | $252B | Technology |
| 5 | Larry Page | $233B | Technology |
| 6 | Sergey Brin | $218B | Technology |
| 7 | Bernard Arnault | $197B | Fashion |
| 8 | Steve Ballmer | $186B | Technology |
| 9 | Jensen Huang | $174B | Technology |
| 10 | Michael Dell | $166B | Technology |
| 11 | Warren Buffett | $145B | Diversified |
| 12 | Jim Walton | $128B | Retail |
| 13 | Rob Walton | $126B | Retail |
| 14 | Alice Walton | $125B | Retail |
| 15 | Bill Gates | $122B | Technology |
| 16 | Amancio Ortega | $120B | Retail |
| 17 | Carlos Slim | $115B | Diversified |
| 18 | Mukesh Ambani | $105B | Energy |
| 19 | Francoise Bettencourt Meyers | $92B | Consumer |
| 20 | Gautam Adani | $90B | Industrial |
| 21 | Julia Flesher Koch & family | $80B | Industrial |
| 22 | Zhong Shanshan | $77B | Diversified |
| 23 | Thomas Peterffy | $76B | Finance |
| 24 | Charles Koch | $73B | Industrial |
| 25 | Ma Huateng | $69B | Technology |
| 26 | Jeff Yass | $62B | Finance |
| 27 | Zhang Yiming | $60B | Technology |
| 28 | Stephen Schwarzman | $58B | Finance |
| 29 | Giovanni Ferrero & family | $54B | Food & Beverage |
| 30 | Tadashi Yanai | $49.0B | Retail |
| 31 | Jacqueline Badger Mars | $48.4B | Food & Beverage |
| 32 | John Mars | $48.4B | Food & Beverage |
| 33 | Ken Griffin | $48.3B | Finance |
| 34 | Abigail Johnson | $46.8B | Finance |
| 35 | Zeng Yuqun | $46.3B | Industrial |
| 36 | Changpeng Zhao | $45.6B | Finance |
| 37 | Alain Wertheimer | $45.5B | Consumer |
| 38 | Gerard Wertheimer | $45.5B | Consumer |
| 39 | German Larrea | $44.4B | Commodities |
| 40 | Lei Jun | $44.1B | Technology |
| 41 | William Ding | $43.2B | Technology |
| 42 | Jack Ma | $43.0B | Technology |
| 43 | MacKenzie Scott | $42.8B | Technology |
| 44 | Colin Huang | $42.4B | Technology |
| 45 | Lukas Walton | $42.1B | Retail |
| 46 | Miriam Adelson | $42.0B | Entertainment |
| 47 | Eduardo Saverin | $39.9B | Technology |
| 48 | Klaus-Michael Kuehne | $39.6B | Industrial |
| 49 | Eric Schmidt | $39.4B | Technology |
| 50 | Len Blavatnik | $39.3B | Diversified |
| 51 | Dieter Schwarz | $38.5B | Retail |
| 52 | Iris Fontbona & family | $37.7B | Commodities |
| 53 | Dan Gilbert | $37.5B | Real Estate |
| 54 | Prajogo Pangestu | $36.6B | Energy |
| 55 | Li Ka-shing | $35.9B | Real Estate |
| 56 | Thomas Frist | $35.7B | Health Care |
| 57 | He Xiangjian | $35.5B | Consumer |
| 58 | Mark Mateschitz | $35.4B | Food & Beverage |
| 59 | Zhang Bo | $35.4B | Industrial |
| 60 | Shiv Nadar | $34.5B | Technology |
| 61 | Ernesto Bertarelli & family | $33.7B | Diversified |
| 62 | Rodolphe Saade & family | $33.7B | Services |
| 63 | Phil Knight & family | $33.5B | Consumer |
| 64 | Masayoshi Son | $33.1B | Technology |
| 65 | Shapoor Mistry | $32.5B | Industrial |
| 66 | Susanne Klatten | $31.6B | Industrial |
| 67 | Robert Pera | $31.4B | Technology |
| 68 | Savitri Jindal | $31.3B | Commodities |
| 69 | Vladimir Potanin | $31.0B | Commodities |
| 70 | Eyal Ofer | $30.7B | Diversified |
| 71 | Phil Anschutz | $30.4B | Technology |
| 72 | Gianluigi Aponte | $30.3B | Services |
| 73 | Hasso Plattner | $29.9B | Technology |
| 74 | Idan Ofer | $29.7B | Energy |
| 75 | Aliko Dangote | $28.7B | Industrial |
| 76 | Gina Rinehart | $27.9B | Commodities |
| 77 | Henry Cheng | $27.7B | Retail |
| 78 | Henry Samueli | $27.6B | Technology |
| 79 | Andrea Pignataro | $27.3B | Finance |
| 80 | Sunil Mittal | $27.3B | Media & Telecom |
| 81 | Elaine Marshall | $27.0B | Industrial |
| 82 | Stefan Quandt | $26.9B | Industrial |
| 83 | Wang Chuan-Fu | $26.8B | Consumer |
| 84 | Alexey Mordashov | $26.6B | Industrial |
| 85 | Azim Premji | $26.5B | Technology |
| 86 | Wang Ning | $26.5B | Consumer |
| 87 | Jorge Paulo Lemann | $26.0B | Food & Beverage |
| 88 | Lakshmi Mittal | $25.8B | Commodities |
| 89 | Vagit Alekperov | $25.5B | Energy |
| 90 | Chen Tianshi | $25.2B | Technology |
| 91 | Low Tuck Kwong | $25.2B | Energy |
| 92 | Andrew Forrest | $24.9B | Commodities |
| 93 | Lyndal Stephens Greth | $24.6B | Energy |
| 94 | Leonid Mikhelson | $24.6B | Energy |
| 95 | Zhang Zhidong | $24.2B | Technology |
| 96 | Takemitsu Takizaki | $24.2B | Technology |
| 97 | Rick Cohen | $24.1B | Consumer |
| 98 | Dilip Shanghvi | $24.1B | Health Care |
| 99 | Vicky Safra | $24.1B | Finance |
| 100 | Peter Thiel | $23.9B | Finance |
Technology clearly leads the rankings, accounting for more than half of the total wealth. Titans such as Elon Musk, Larry Ellison, Mark Zuckerberg, Jeff Bezos, and the Google founders drive the sector’s strength, with fortunes tied to electric vehicles, cloud computing, social media, artificial intelligence, and semiconductors.
Finance represents the second-largest sector. Investors such as Thomas Peterffy, Ken Griffin, Stephen Schwarzman, and David Tepper demonstrate how hedge funds, private equity, and brokerage have produced enormous fortunes.
Retail remains a core source of dynastic wealth, anchored by the Walton family of Walmart, while industrial empires such as Koch Industries and diversified holdings contribute additional scale. Food and beverage, consumer goods, health care, and energy also feature prominently, though at smaller proportions compared to technology.
Total Net Worth of the Listed Billionaires by Country
| Rank | Country | Billioners’ Net Worth, $ bn |
| 1 | United States | $5,080B |
| 2 | China | $875B |
| 3 | India | $589B |
| 4 | France | $448B |
| 5 | Germany | $364B |
| 6 | Hong Kong | $232B |
| 7 | Canada | $179B |
| 8 | United Kingdom | $162B |
| 9 | Mexico | $143B |
| 10 | Indonesia | $141B |
| 11 | Italy | $140B |
| 12 | Australia | $136B |
| 13 | Switzerland | $127B |
| 14 | Spain | $126B |
| 15 | Brazil | $115B |
| 16 | Japan | $98B |
| 17 | Sweden | $78B |
| 18 | Austria | $60B |
| 19 | Czech Republic | $56B |
| 20 | Taiwan | $52B |
| 21 | Israel | $51B |
| 22 | Colombia | $50B |
| 23 | Singapore | $42B |
| 24 | South Africa | $39B |
| 25 | Saudi Arabia | $37B |
| 26 | Netherlands | $36B |
| 27 | Philippines | $35B |
| 28 | Monaco | $35B |
| 29 | Denmark | $35B |
| 30 | Chile | $33B |
| 31 | Greece | $31B |
| 32 | Nigeria | $28B |
| 33 | UAE | $23B |
| 34 | Thailand | $21B |
| 35 | Ireland | $21B |
| 36 | Norway | $18B |
| 37 | Malaysia | $18B |
| 38 | Korea | $17B |
| 39 | Egypt | $17B |
| 40 | New Zealand | $11B |
| Total | $9,800B |
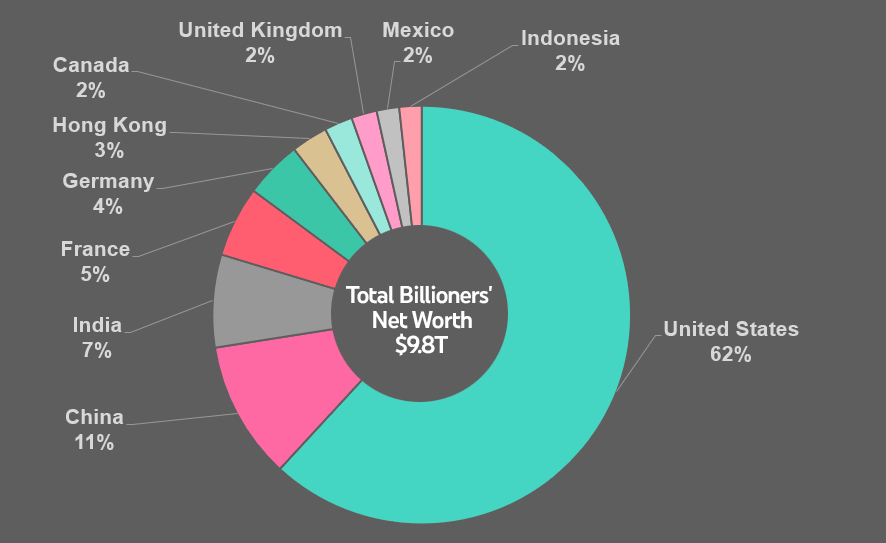
Top 10 Countries by Share of the World’s Richest People
| Rank | Country | Net Worth | Share, % |
| 1 | United States | $5,080B | 51,8% |
| 2 | China | $875B | 8,9% |
| 3 | India | $589B | 6,0% |
| 4 | France | $448B | 4,6% |
| 5 | Germany | $364B | 3,7% |
| 6 | Hong Kong | $232B | 2,4% |
| 7 | Canada | $179B | 1,8% |
| 8 | United Kingdom | $162B | 1,7% |
| 9 | Mexico | $143B | 1,5% |
| 10 | Indonesia | $141B | 1,4% |
| Top 10 | $8,213 | 83,8% | |
| Other | $1,587 | 16,2% | |
| Total | $9,800 | 100,0% |
Methodology of the Bloomberg Billionaires Index
For private businesses, Bloomberg applies comparisons with similar publicly listed companies using enterprise value-to-Ebitda or price-to-earnings ratios. If net debt is unknown, the valuation assumes the average net debt-to-Ebitda ratios of comparable peers.
These valuations change daily in line with peer company movements or sector indices. Bloomberg selects peers based on company size and industry.
If ownership of certain private assets cannot be confirmed, they are excluded. Valuation notes, including the exact methods used, appear in the billionaire’s profile and are accessible through Bloomberg’s professional platform.
A default 5% discount is applied to privately held assets to reflect potential illiquidity, with exceptions noted and justified. Public shares are not discounted.
For individuals with concentrated holdings in a specific country, Bloomberg may apply a geographic risk discount, based on Standard & Poor’s sovereign debt ratings.
If public company shares are used as collateral for loans, their value or the amount borrowed is removed from the total net worth. When credible data shows how the funds were used, the corresponding value is added back in.
Valuing hedge funds relies on the average market capitalization-to-assets under management ratios of listed equivalents. Bloomberg excludes fee income due to verification issues and personal co-investments.
A 25% discount applies when a fund’s results depend primarily on a single manager. Asset values are updated using government filings, credible media, and analyst reports. Returns are factored in when supported by industry sources like the HFRI Index.
Calculations include dividend income and sales of both public and private shares. Bloomberg deducts taxes based on the country’s highest income, dividend, and capital gains rates, unless reliable evidence supports a lower rate.
Cash and other investable assets are valued using a hybrid return model combining cash, government bonds, equities, and commodities.
Personal debt is excluded from estimates. Family holdings are treated as part of the billionaire’s total wealth unless control is clearly divided among members. When multiple adults play active roles in a business, Bloomberg attributes value individually based on verified stakes.
Each individual or their representative may respond to questions regarding their net worth assessment. If they provide credible corrections or new data, Bloomberg adjusts the figures accordingly.
Michael Bloomberg is excluded from this ranking due to editorial policy restricting Bloomberg News from covering its parent company.
Bloomberg’s confidence score for evaluation
- 5-star profile includes mostly public assets or well-documented private holdings, with verification from the individual or their team.
- 4-star rating applies when most assets are public or transparent private firms, even if held through less transparent structures.
- 3-star score reflects significant private holdings or unverifiable public stakes, often relying on unconfirmed or single-source data.
- 2-star rating involves considerable unknowns or assumptions, and little or no current feedback.
- 1-star profile depends on limited information and requires major assumptions.
FAQ
Bloomberg calculates net worth using a combination of public data and financial modelling. Public company shares are valued at the latest New York market close and converted to USD using current exchange rates. Private assets are estimated by comparing similar publicly listed firms, adjusted for debt, liquidity, and control factors.
Net worth estimates are updated daily, reflecting changes in the stock market, exchange rates, and relevant financial disclosures. This makes the Bloomberg Index a dynamic and up-to-date reflection of global wealth.
Beinsure Media analysed Bloomberg’s global data to compile a focused ranking of the wealthiest individuals in the United Kingdom, highlighting the country’s top billionaires by industry and net worth.
Private businesses are valued by comparing them to publicly traded companies of similar size and sector, using enterprise value-to-EBITDA or price-to-earnings ratios. A default 5% discount is applied to account for illiquidity, unless verified exceptions apply.
Bloomberg deducts taxes based on the highest applicable rates in each country—covering income, dividends, and capital gains—unless supported evidence suggests otherwise. Personal debt is excluded, but loan-collateralised shares are adjusted accordingly.
Each billionaire’s profile includes a confidence score from 1 to 5 stars. A 5-star rating means the valuation relies primarily on public assets or well-documented private holdings, while lower ratings indicate greater reliance on assumptions and unverifiable data.
Due to an internal editorial policy, Bloomberg News does not cover the net worth of its founder, Michael Bloomberg, to avoid any conflict of interest. As a result, he is excluded from the rankings, regardless of his financial standing.
………………………..
AUTHORS: Brian Chappatta — Managing Editor:Wealth Group at Bloomberg News, Tom Maloney, Jack Witzig, Pei Yi Mak and Andrew Heathcote – Bloomberg News` Editors
Edited by Oleg Parashchak — Editor-in-Chief at Beinsure Media