Overview
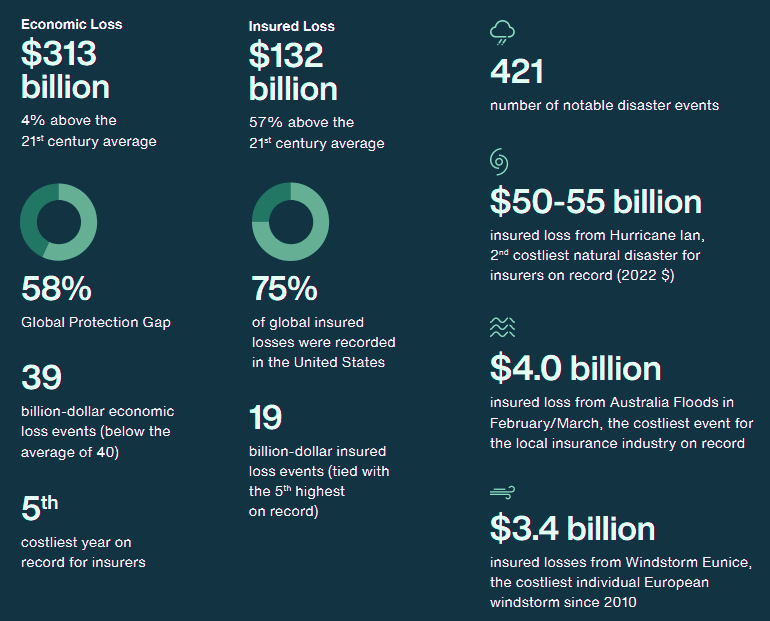
Global natural disasters resulted in near-average economic losses totaling $313 billion. Half of those losses occurred in the United States and were driven by the devastating Hurricane Ian and multiple severe convective storm outbreaks.
According to AON Weather, Climate and Catastrophe Insight report, three global drought events were among the 10 costliest disasters, which underlines the growing significance of the peril on a global scale. These occurred in the United States, Europe and China.
The insurance sector covered $132 bn — marking 2023 as the fifth costliest year for insurers on record.
While this is one of the lowest protection gaps on record (only matched by a similar percentage from 2005), the remaining gap presents both a challenge for the global resilience, as well as an opportunity to facilitate further protection.
Key highlights by report:
- 2023 ranks as the fifth costliest year for insurers on record. Insurers covered $132 bn in losses.
- Hurricane Ian (2022) caused $50-55 bn in insured losses, the second costliest event on record. Hurricane Katrina remains the costliest, with $99 bn in losses (price-inflated).
- 58% of disaster losses were uninsured. This is one of the lowest protection gaps on record, similar to 2005.
- Natural catastrophe events caused €3 bn in damages. Winter storm series “Ylenia”, “Zeynep”, and “Antonia” in February caused €1.4 bn in damages, nearly 50% of the total.
- €2.5 bn of the total damages were related to residential buildings, household goods, and businesses.
Natural Disaster Events and Loss Trends
Global natural disaster losses in 2023 are better covered by insurers who face their fifth costliest year in history; climate change drives new extreme weather records.
The industry the second costliest event on record, as Hurricane Ian (2022) resulted in approximately $50-55 bn of insured losses covered by public and private entities.
It is only surpassed by Hurricane Katrina with $99 billion on a price-inflated basis. With a protection gap of 58%, most disaster losses were uninsured.
Natural catastrophe events in Germany caused damages of €3bn. 2022 has been an above-average claims year. The winter storm series “Ylenia”, “Zeynep” and “Antonia” in February alone caused almost 50% of the damage at €1.4 bn. This makes the storm series the third most severe since 2002.
Of the €3bn in total damages, €2.5bn is related to residential buildings, household goods, and businesses. Only about half of homeowners in Germany are insured against natural hazards.
New extreme weather records were broken, and many regions saw prolonged drought and scorching heatwaves. This is a reminder that the impact of climate change on communities around the globe is tangible and that behavior of certain natural perils will continue to be affected (see 5 Largest Natural Catastrophes).
Many disasters in highly exposed areas, including Hurricane Ian or the devastating floods in Pakistan, highlight the need to strengthen resilience, as socio-economic change and concentration of exposure and wealth in vulnerable areas remains a major loss driver.
Through the adoption of effective adaptation strategies and better disaster management and warning systems, we can better protect the communities in which we live and work.
Closing the Protection Gap to Mitigate and Protect Against Climate Risks
We are living in a time that has been deemed “The Great Volatility” by the world’s leading economists. And there is no greater volatility we face — collectively — than the impacts of climate change (see Natural Catastrophe insurers losses Outlook).
Mitigating and in some cases adapting to climate change is one of the biggest challenges we face. There are abundant opportunities, but success is not guaranteed. This is why collaboration between public, private and societal forces is essential.
Aon has been developing partnerships across the industry to advance climate solutions and close the protection gap. Our recent work with the International Federation of Red Cross and Red Crescent Societies to create the Disaster Response Emergency Fund (DREF), which provides emergency funding for communities in all kinds of disasters when needs exceed resources, illustrates this commitment.
Greg Case, Chief Executive Officer, Aon
As AON President Eric Andersen put it at the DREF Pledging Conference: “Big problems need to be solved by collaboration and this has been exactly that — humanitarian, private and public sectors partnering to prove that solutions can be found together.”
This report explores the events and costs of catastrophes and natural disasters in 2022 that amounted to economic losses of $313 billion — $299 billion of which was the result of weather and climate events. That’s a staggering amount of loss, and yet, only 42% were covered by insurance. This data highlights a tremendous opportunity to close this protection gap. In doing so, we can protect vulnerable communities and strengthen the economy.
There are three risks that we hear from our clients that could hold companies back from taking a leading role in solving the climate crisis. They are telling us the industry continues to:
- Leave the playing field by excluding climate-related triggers and exiting challenged geographies;
- Tax the net-zero transition by opting out of entire sectors and inadvertently making the transition to clean energy harder;
- Ignore the accelerators by moving too slowly on adjacent markets.
Insurance exists to protect that which we cannot afford to lose, and when it comes to climate change, we all have a lot to protect.
The good news is that there are examples of where the industry has forged a better path: choosing to stay in the game, facilitate a just transition and provide ways to bring new solutions to market quicker (see Natural & Man-Made Catastrophe Loss Outlook).
For example, catastrophe bonds were created to provide post-event cover for traditional risks, but they also encourage pre-investment in research and development that would accelerate clean energy transitions by assuring certainty of funds to deal with the impact of traditional claims.
In another case, we have developed an industry-leading capability to enable a company to accurately value its intellectual property, and then use it as an asset to finance growth. This allows them to bypass traditional funding and accelerate their time to market. For many green technology companies, this is becoming their best option.
Global Economic Losses Near the 21st Century Average
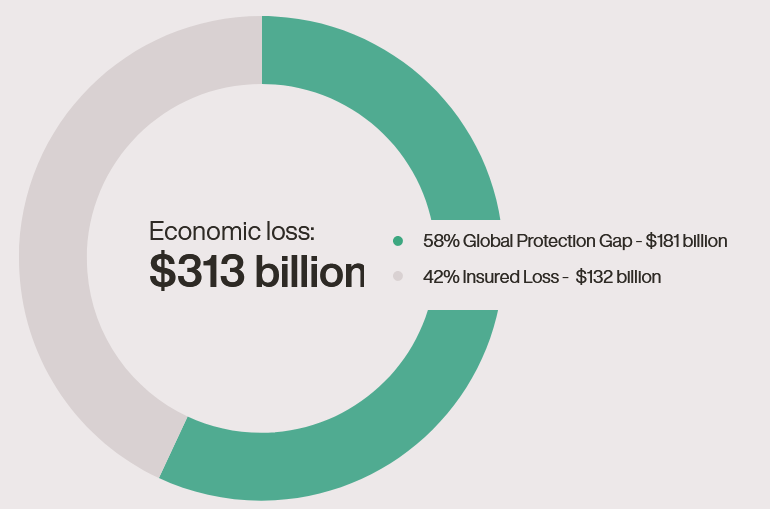
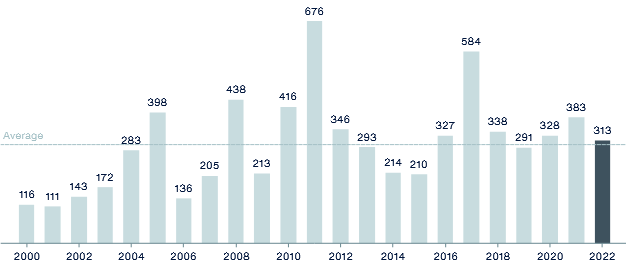
Direct economic losses resulting from natural disasters are estimated at $313 billion. This is close to the 21st century average, after adjusting actual incurred damage to today’s dollars using the U.S. Consumer Price Index.
Though 2022-2023 was far from record-breaking in terms of overall losses, it saw many impactful and costly events across the globe (see Reinsurance Rates for Property Catastrophe Forecast).
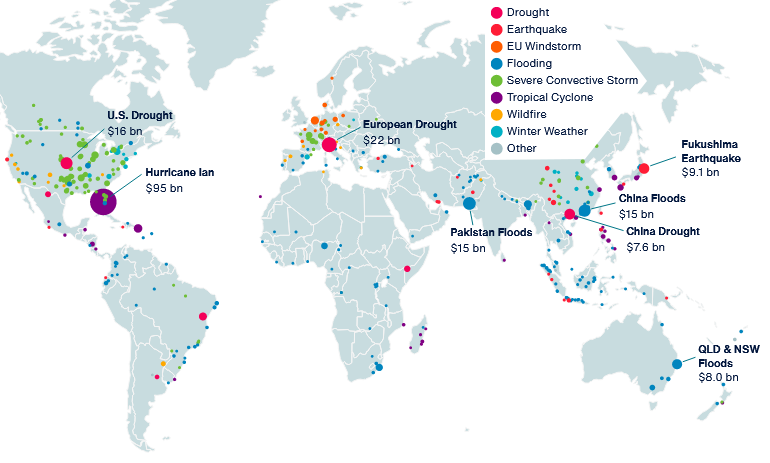
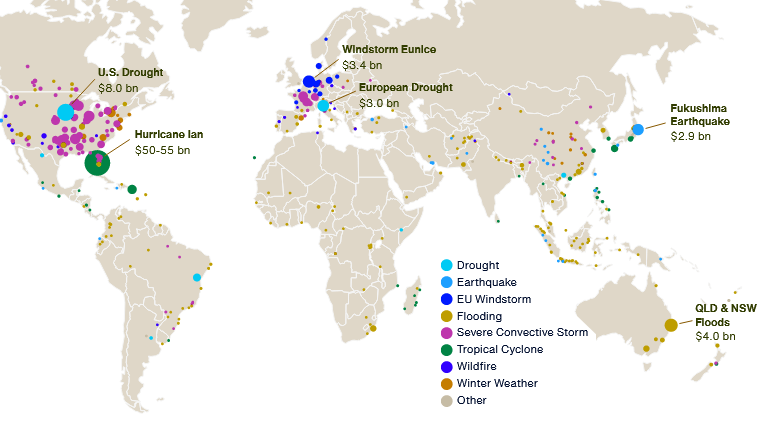
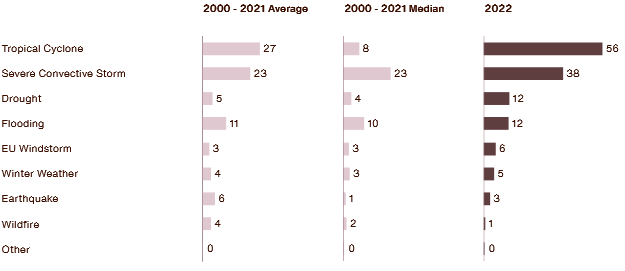
Visualizing the geographic distribution events allows for distinguishing certain patterns, including higher frequency of medium-sized Severe Convective Storm (SCS) events in the U.S. and Europe, and the prevalence of flooding events in Africa, Southeast Asia and Oceania.
Significant Economic Loss Events
Note that significant price inflation throughout the year already resulted in notable increases of per-event losses.
The map primarily shows the economic impact, which to some extent correlates with concentration of wealth — this is not a result of a reporting bias. What this map does not highlight is the humanitarian crises and displaced communities, as many events with significant human impacts do not necessarily translate into a high financial toll in terms of direct damage.
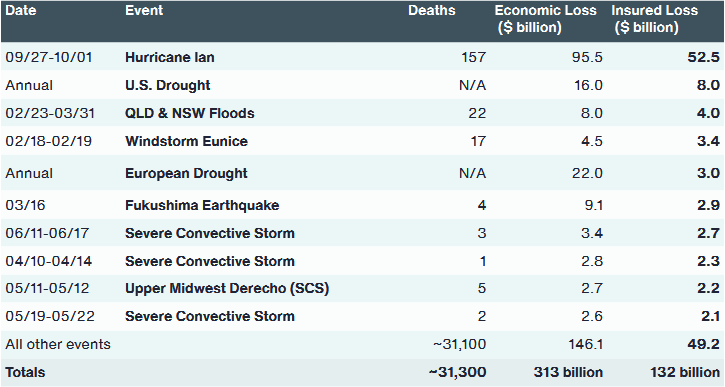
Top 10 Global Economic Loss Events
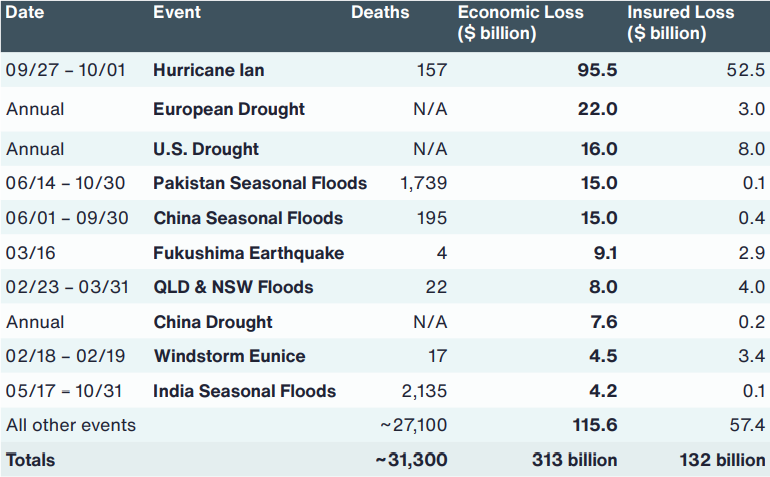
At least five events topped the economic loss threshold of $10 billion. Hurricane Ian dominated the ranking with an aggregated toll of approximately $95.5 billion — more than the next seven events combined.
Three drought events in the table of 10 costliest events underline the growing significance of the peril on a global scale. Particularly, cumulative drought losses in European countries were at their highest since the historic summer of 2003, while the U.S. had the worst drought since 2012 in terms of overall economic losses.
Floods in Pakistan were the costliest event for the peril, tied with seasonal flood losses in China, which were at their lowest since 2015. All but one event in the table were weather- and climate-related; the only two geophysical disasters that topped $1 billion in economic losses in 2022 were the March Fukushima Earthquake in Japan and September Sichuan Earthquake in China.
Global economic losses from natural disasters were close to the 21st century average ($301 bn) and median ($292 bn) on price-inflated basis and reached approximately $313 bn. They were 6% and 4% lower based on the average and median, respectively, of the last decade
Focusing on weather-related disasters only, total losses in 2022 were roughly 17% above the average since 2000, yet still lower than the short-term mean and median statistics and reached approximately a half of losses in the record year of 2017.
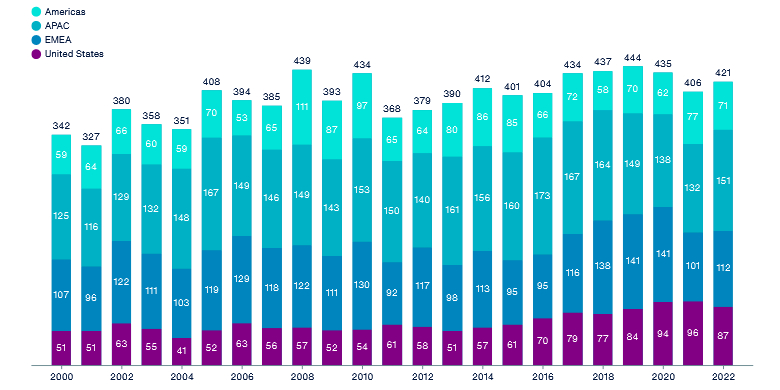
Global Economic Losses from Natural Disasters
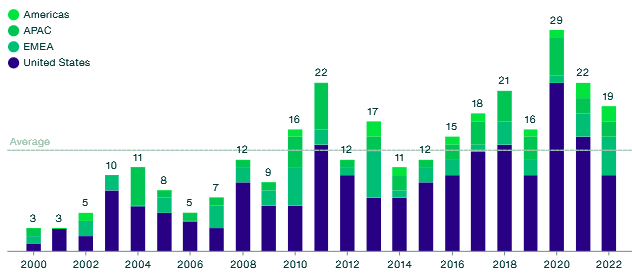
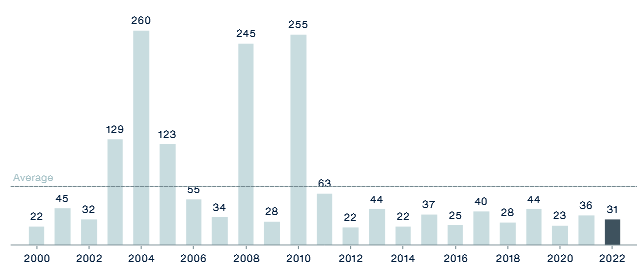
Global Billion-Dollar Economic Loss
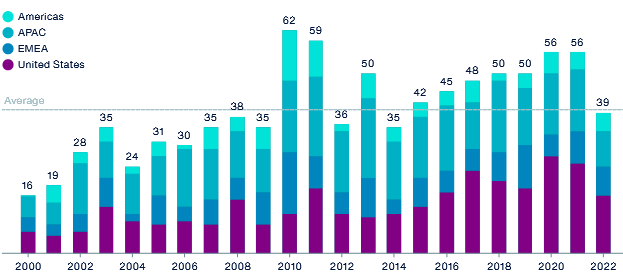
There were at least 39 individual billion-dollar natural disasters, which was below the average of 40.
U.S. wildfires are treated as individual events. For some years, tropical cyclone events in the Atlantic Basin resulted in billion-dollar losses in both the U.S. and elsewhere in the Americas. Such occurrences are only included once. Loss development for events expected in the coming months may increase of the total.
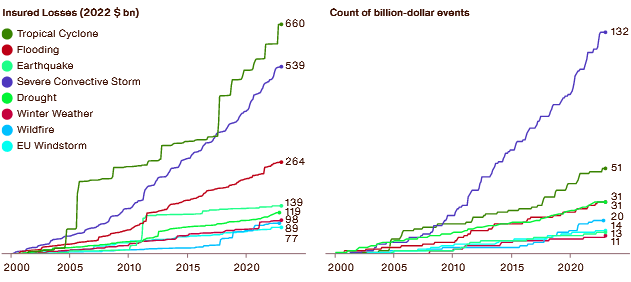
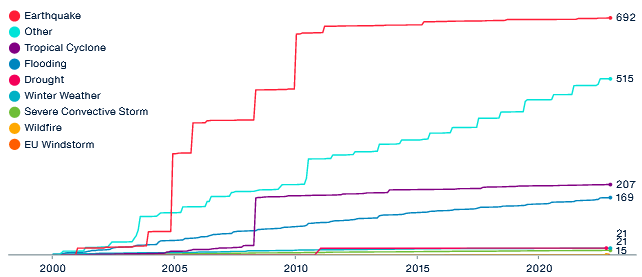
Cumulative Global Economic Losses by Peril
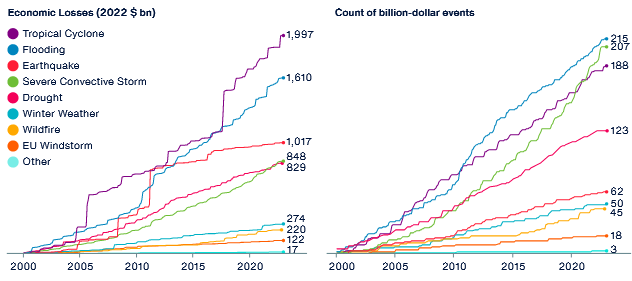
Tropical cyclone remains the costliest peril on a cumulative basis since the start of the 21st century. Driven by extreme loss years, such as 2023, 2022, 2017, 2005 and 2004, it is nearing the $2 trillion aggregated loss.
The historical record also shows that roughly half of these cumulative losses were caused by only 10 individual events, including Hurricane Ian.
While the earthquake peril holds the title for the costliest natural disaster ever recorded, the Great Tohoku Earthquake and Tsunami in 2011, it failed to generate an event exceeding the $10 billion loss threshold since 2016.
Global Economic Losses by Peril
Accelerating frequency of costly SCS events will likely result in the peril dominating the cumulative count of billion-dollar events in the following years.
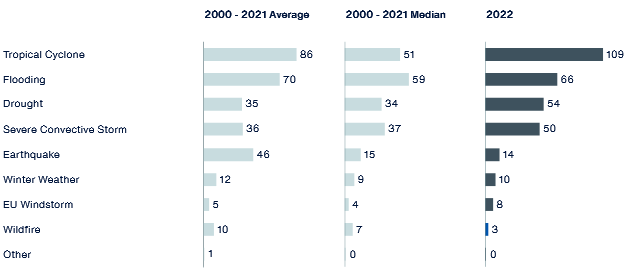
With more than $100 billion of economic losses, tropical cyclone was by far the costliest natural peril, with vast majority of losses resulting from Hurricane Ian.
The peril was well above its 21st century average and median statistics. Other perils that exceeded their mean losses were Drought, SCS and European Windstorm.
Global Insured Losses Surpass $100 bn for the Third Time in a Row
Global insured losses from natural disasters in 2022 are estimated at $132 billion, well above the short-, medium- and long-term averages. Roughly 42% of direct aggregated economic losses were covered by public and private insurance entities, translating to a global protection gap of 58%.
Top 10 Global Insured Loss Events
Hurricane Ian was by far the costliest event of the year for the global re/insurance industry and became the second costliest natural disaster ever recorded in terms of insured loss on a price-inflated basis, only surpassed by Hurricane Katrina, which resulted in more than $99 billion losses (in 2022 $) after its devastating impact in 2005. U.S. Home Insurers Have of the Highest Level of Catastrophe Exposure to Hurricane Ian.
Ian is anticipated to surpass the second costliest disaster so far, the Great Tohoku Earthquake and Tsunami of 2011. No other event reached the $10 billion-dollar mark, yet there were at least 10 multi-billion-dollar events.
Remarkably, the floods in Queensland and New South Wales in February and March resulted in insured losses of $4 billion, the highest loss in the history of the Australian insurance sector. Similarly, April floods in South Africa were the costliest for the country, with estimated $1.8 billion in insured losses.
It is also noteworthy that two drought events (in the U.S. and Europe) are featured in the table of top 10 costliest events, which only occurred once before, in 2003.
Significant 2022 Insured Loss Events
This is largely because both years saw extremely costly hurricane events in the U.S., a country exhibiting a relatively mature insurance market. While Asia, a region with a developing market and relatively low coverage, saw costly flooding events in Pakistan, India and China, overall economic losses in the region were still below average (see Lloyd’s of London guidelines on Catastrophe Exposure).
The protection gap remains a critical reference point for the insurance industry, financial markets and governments as it highlights the vulnerability of communities and the opportunity for new solutions.
Total insured losses were well above the 21st century average ($84 billion) and median ($75 billion), yet lower than 2021 ($146 billion) and slightly below the average of the last five years ($132 billion), during which the industry saw elevated losses. It was the third consecutive year when losses surpassed $100 billion, and only the 8th time that this threshold was exceeded.
Global Insured Losses from Natural Disasters

Depending on the eventual financial impact of Hurricane Ian and potential loss development for other significant events, 2023 is anticipated to rank as the fifth costliest year on record for insurers.
Global Billion-Dollar Insured Loss Even
There were at least 19 individual billion-dollar natural disasters, which was above the average of 13. U.S. wildfires are treated as individual events, tropical cyclone events in the Atlantic Basin resulted in billion-dollar insured losses in both the U.S. and elsewhere in the Americas. Such occurrences are only included once.
Cumulative Global Insured Losses by Peril
When viewing insured losses on a cumulative basis since the start of the 21st century, Tropical Cyclone is the costliest global peril. Like Earthquake, it is largely driven by extreme loss years and single catastrophic events, as opposed to SCS losses, which are driven by an increasing frequency of events.
Approximately 40% of cumulated losses from Tropical Cyclone were caused by only five Atlantic Hurricanes — Katrina, Ian, Irma, Ida and Sandy.
On the other hand, the number of costly SCS events outpaced other perils by a large margin.
Global Insured Losses by Peril
Tropical Cyclone was the costliest peril globally, followed by SCS. Notably, Drought had its second costliest year after 2012 due to elevated losses in both the U.S. and Europe. The only other peril that was above the long-term averages and medians was European Windstorm.
The entire sequence of windstorms on February 16 to 21 — Dudley, Eunice and Franklin — resulted in aggregated losses of $4.7 billion.
Losses from the latter on an inflation-adjusted basis were the highest since 2013 and Windstorm Eunice became the costliest individual windstorm since Xynthia in 2010.
Global Protection Gap
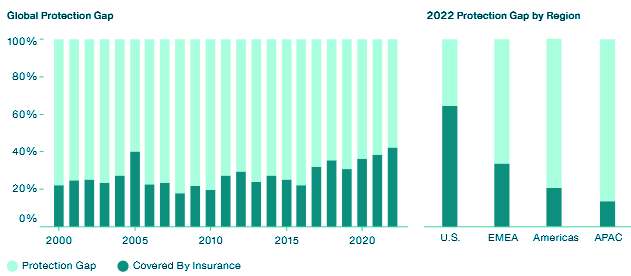
Closing the protection gap remains a global challenge. However, preliminary data shows that 2022 likely saw one of the lowest protection gaps on record with roughly 42% of losses covered; this is only matched by 2005.
In both years, costly disasters occurred in the U.S. and losses in less-developed markets were below average. Since 2017, the protection gap was always under 70%, which previously only occurred in 2005.
Insured Losses from Primary/Secondary Perils
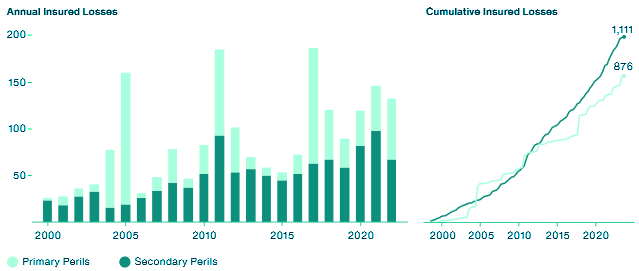
While the natural perils traditionally considered as primary or peak (Tropical Cyclone, Earthquake and European Windstorm) have resulted in the highest individual event losses this century, aggregated losses from the other types of disasters have already outpaced their cumulative costs. One of the factors that are driving this shift is the consistent increase of SCS losses.
Global Fatalities Remain Below Average for 12 Years in a Row
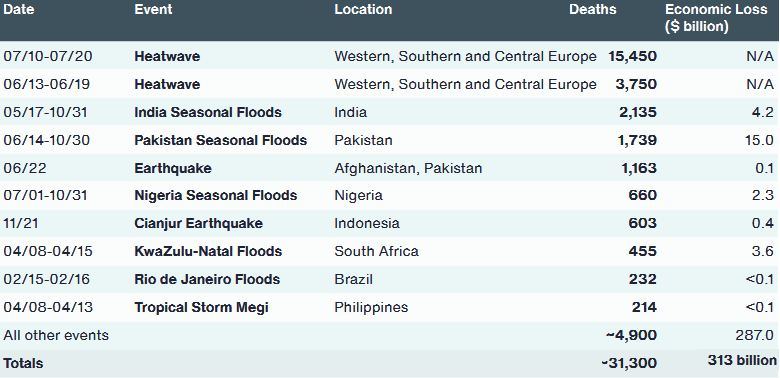
Approximately 31,300 people lost their lives due to global natural catastrophe events in 2022, which was well below the 21st century average (73,200) and median (38,900). Roughly two thirds of these fatalities can be directly attributed to heatwaves that occurred in Europe in June and July. It is worth noting that heatwaves in China and other countries also resulted in significant health impacts, yet reliable estimates will not be released until later in 2023.
Thousands of people were also killed in South Asia as a result of significant seasonal floods in India and Pakistan. Other notable floods included events in Nigeria and South Africa, as well as in China and Brazil.
Top 10 Human Fatality Events
The number of annual human casualties has shown a notable decline in recent decades. The improvements in forecasting, evacuation planning and strategies, increased public awareness and better building practices have all played a key role. Asia, Africa and South America show the greatest improvements with reduced fatalities.
Global Natural Disaster Fatalities (thousands)
Earthquake peril is responsible for the largest part of disaster-related fatalities in the 21st century. This human toll is mainly driven by individual catastrophic events in the Indian Ocean (2004), Haiti (2010), Pakistan (2005), China (2008) and Iran (2003).
These five events alone account for more than 600,000 fatalities, or roughly a third of all deaths attributed to natural disasters since 2000.
This statistic now accounts for heatwave-related fatalities in a more systematic manner and yearly totals are notably higher.
Cumulative Global Fatalities by Peril (thousands)
On the other hand, steadily increasing cumulative death toll from heatwaves (represented in the “Other” category) underlines the growing significance of perils that most importantly pose a threat to human health and wellbeing, and not necessarily a physical risk to property and infrastructure.
Natural Disasters Defined: Number of Events on the Rise
An event must meet at least one of the following criteria to be classified as a natural disaster in the Aon’s Catastrophe Insight Database:
- Economic Loss: $50 million
- Insured Loss: $25 million
- Fatalities: 10
- Injured: 50
- Structures Damaged or Filed Claims: 2,000
Based on the noted criteria above, there were at least 421 individual natural disasters, which was slightly above both the average (396) and median (398) since 2000. Additional 2023 events may be added later due to further research and data updates.
As typically anticipated given the highest frequency of SCS, flood and tropical cyclones, the highest number of disaster events occurred during the second (133) and third (113) quarters.
…………………..
AUTHORS: Michal Lörinc – Head of Catastrophe Insight at AON, Ondřej Hotový – Catastrophe Analyst at AON, Adam Podlaha – Head of Impact Forecasting at AON