Overview
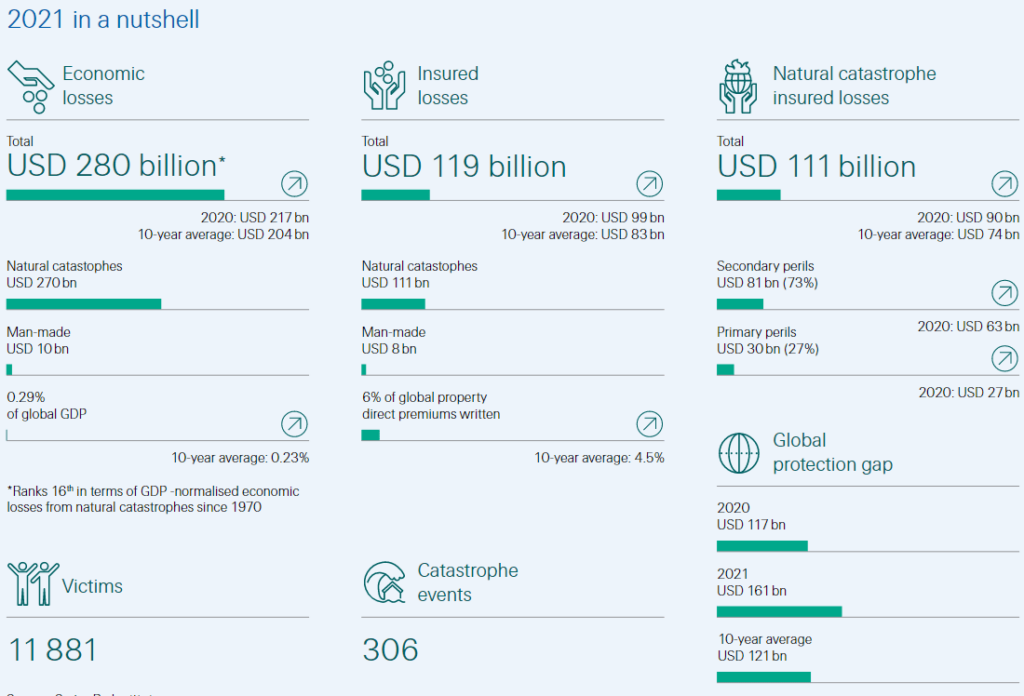
Natural and man-made disasters resulted in global economic losses of USD 280 billion, the sixth highest on Swiss Re sigma records, and the 16th highest since 1970 after normalising for GDP growth effects.
Of the economic losses, USD 270 billion was attributable to natural catastrophes. In addition to a devastating earthquake in Haiti that, sadly, claimed more than 2 000 lives, there were more than 50 severe flood events across the world, as well as tropical cyclones, episodes of extreme cold and heat, and severe convective storms (SCS).
Insurance covered USD 119 billion of last year’s economic losses, the fourth highest on record, of which USD 111 billion was compensation for damage resulting from natural catastrophes.
Insured losses have been elevated over the last five years due to recurring high-loss secondary peril events such as SCS, floods and wildfire.
However, peak perils have also featured prominently, including Hurricane Ida, the costliest industry event of 2021 with insured losses of USD 30–32 billion. Coming after a dip in 2012–2016, however, the higher insured losses of 2017–2024 signal a return to long-term growth trend of 5–7%, rather than a step-change up in claims.
Floods affect more people across the globe than any other natural disaster
The deadly floods that ravaged eastern Australia earlier this year were a tragic reminder of the increasing threat posed by extreme weather events as the climate crisis deepens.
The financial damage caused in vast areas of Queensland and New South Wales could be extensive. Insurers are now processing thousands of claims from their policyholders, and the costs underscore the challenges the industry faces from increasingly severe – and frequent – floods around the world. While we categorise flooding as a secondary peril, this doesn’t mean the impact is minimal.
To strengthen resilience against flood increased understanding and awareness of the peril is required, similar to that of primary perils.
In its many manifestations, flood is a complex peril to model. The influence and interplay of the anthropogenic environment on the physical processes creates additional modelling challenges when compared to other natural catastrophes.
In the last decade, the industry has progressed modelling of the multiple drivers of flood risk, capitalising on advances in academic research, computing capabilities and a growing ecosystem of modelling companies.
While we do not see a new norm of higher loss growth rates, regular occurrence of multi-billion insured loss outcomes from secondary peril events is new.
In 2021, two separate secondary perils events – winter storm Uri in the US and devastating floods in central-western Europe in July – each caused losses in excess of USD 10 bn.
Traditionally secondary perils have been less well monitored than primary. Recent efforts to change this should be further progressed.
Flood affects more people around the world than any other peril. Losses from flood have been on an upward trend globally and at a significantly faster pace than global GDP. Through 2011 to 2020, at near USD 80 billion, cumulative insured losses from flood events around the world were almost double that of the previous decade. The flood experience of 2022, with insured losses at USD 20 billion, indicates no let up of the upward trend.
Historically Asia has suffered the highest economic losses from flood, but it lags in terms of insured losses. There is a large flood protection gap across the world.
Insurance has covered just 7% of the aggregate economic losses from flood events in emerging markets in the last 20 years, and 31% in advanced economies.
Flood risk is complex to monitor. Exposure accumulation with economic growth and urbanisation has been the main driver of rising flood-related losses over time. However, many other factors such as aging or lack of flood control infrastructure, “soil sealing” in urban areas, more rainfall from tropical cyclones, and clustering of catastrophe events have also shaped loss outcomes.
Changing climate also needs to be considered in present-day and for future risk assessment. For instance, in scenario analysis, we project for 2050 more pronounced increases in UK flood-related losses for high return periods and assuming no adaptation interventions.
Granular understanding will improve the accuracy of flood risk costing and facilitate the development of innovative risk transfer solutions. It can also help inform local mitigation planning and disaster risk management. A core element of adaptation measures are flood defences.
As long-term investors in sustainable infrastructure, here too re/insurers can make a significant contribution to making communities more resilient. Indeed, with due attention on different fronts, re/insurers will remain primary agents of economic and social resilience against the ubiquitous risk that is flood.
A return to long-term NatCat trend
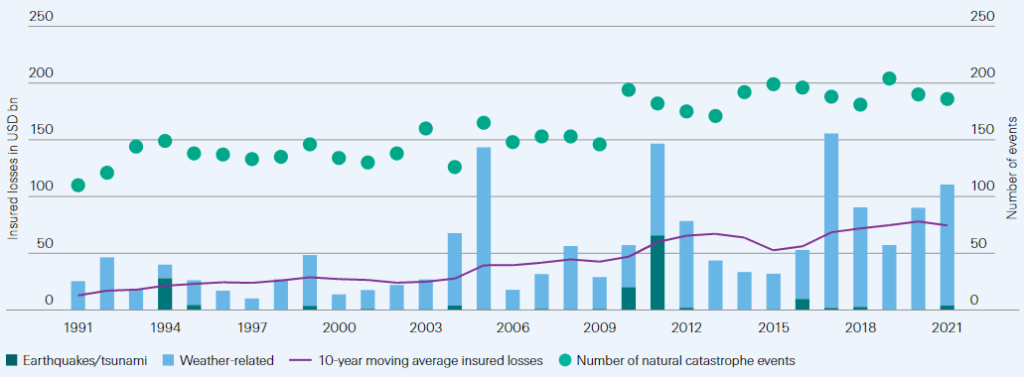
The record of the past five years has been elevated insured losses from natural catastrophes. After a benign phase of lower annual losses in the 2012–2016 period, annual losses have resumed their historically observed long-term growth rate of 5–7% annually, based on 10-year moving averages (see Natural Catastrophe insurers losses Outlook). Rather than a new normal or a step-change, insured losses have reverted to long-term (and still significant) growth trend.
Global insured losses from flooding
Insured flood losses are on the rise, with most of the global flood insurance losses recorded in the last two decades. Accumulating economic wealth, growing populations, poor defence infrastructures and climate-change effects are driving the increase.
Even so, in the last decade flood events counted for just 10% of insured losses from all natural catastrophes. This is a reflection of low flood insurance penetration in both emerging and advanced economies.
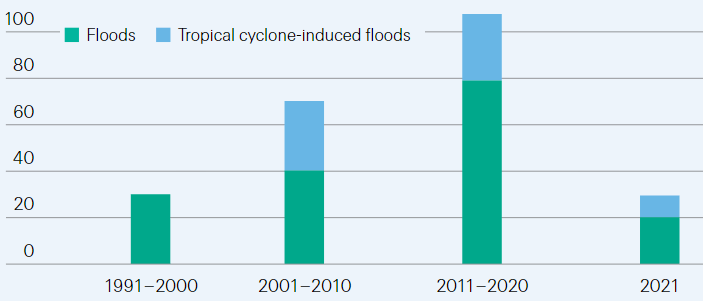
Global insured flood losses, including estimated flood damage due to tropical cyclones
Floods can be secondary effects of tropical cyclones that spark storm surges and/or heavy rains, leading to large-scale inland flooding.
With limited information available, we estimate that over the last 20 years, flooding as a secondary effect of tropical cyclones added around 30% to the global insured losses from pluvial and fluvial flood events.
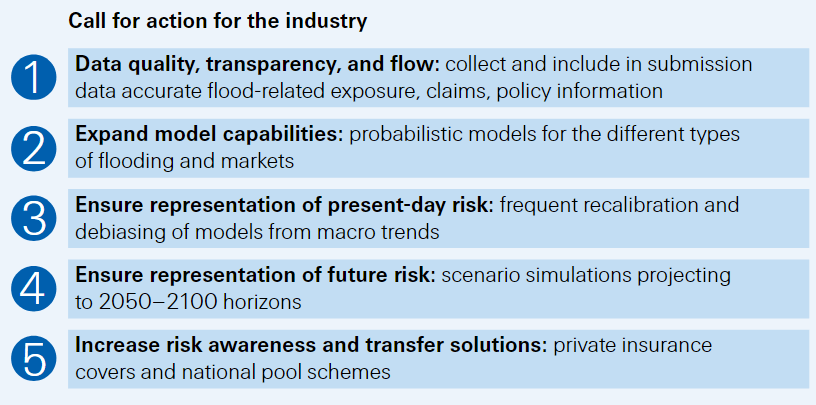
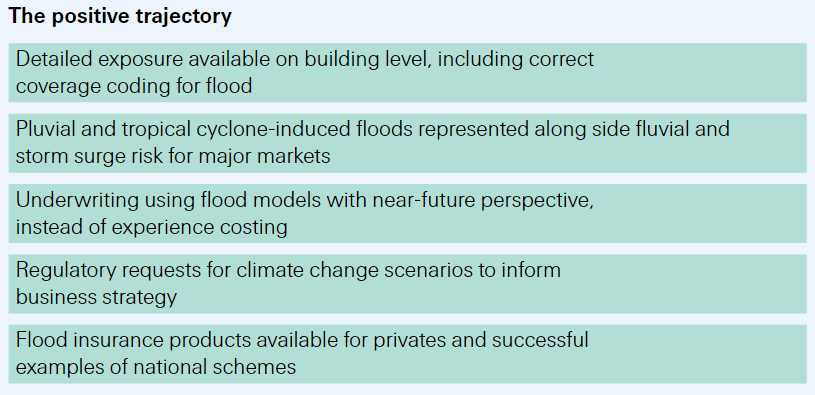
Call for action for the re/insurance industry
Make flood risk assessment more rigorous and develop risk transfer solutions.
Another year of severe weather events
Disaster events resulted in insured losses of USD 120 billion in 2022, the fourth highest on sigma records. The year’s natural catastrophes reinforced recent observations: namely the huge loss potential of a primary peril, and the significant impact of secondary perils, including flood.
Secondary peril events accounted for more than 70% of last year’s insured losses and for the first time ever, two separate secondary peril events each resulted in insured losses of more than USD 10 billion.
Overall, annual catastrophe insured losses have been above average in the last five years, but a 5–7% long-term growth trend remains intact.
According to Insured natural catastrophe losses Report, 2023 was another year of intense catastrophe activity across the world, including episodes of severe rainfall, heat, snow and cold, a massive earthquake in Haiti, hurricanes, wildfires and major tornado outbreaks. In real terms, global economic losses from man-made and natural disasters were USD 280 billion, of which USD 270 billion came from natural catastrophes.
The insured loss total was USD 119 billion, the fourth highest for a single year on sigma records. The insured total was well above the USD 99 billion registered in 2020 and the 10-year average of USD 87 billion. Natural disasters caused USD 111 billion of last year’s total insured losses, also the fourth highest annual count on record.
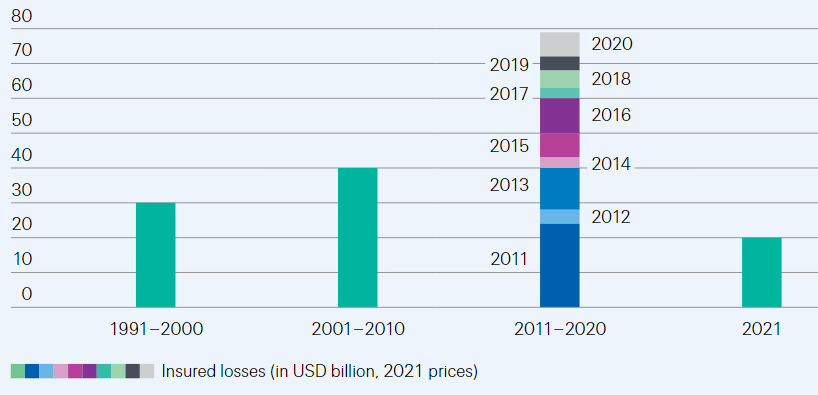
Top 4 peak insured loss years and past decade annual average, in USD billion
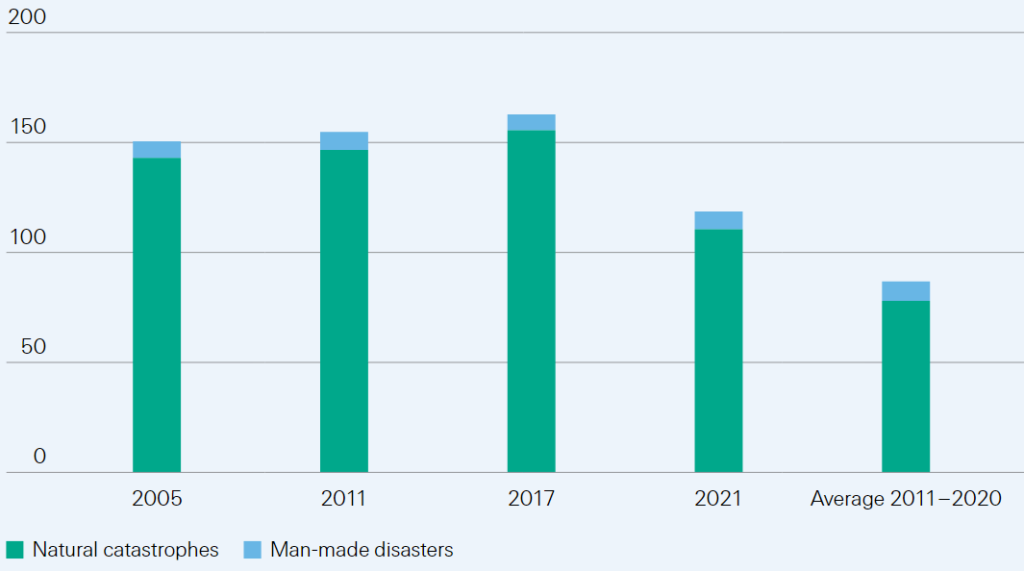
In 2024, natural catastrophe losses were spread across a wide variety of perils. The mix of events affirm the continuing importance of secondary perils such as severe convective storms (SCS) and floods in contributing to both economic and insured losses. Secondary perils accounted for 73% of all naturalcatastrophe insured losses in 2021.
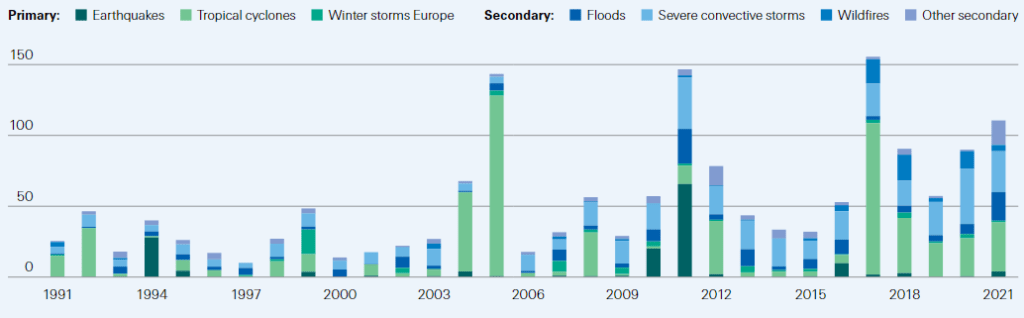
Global insured natural catastrophe losses by peril, in USD billion (2021 prices)
Last year’s below average losses do not detract from fire being an ever-present hazard in North America, Australia and other parts of the world. Losses are likely to continue to grow in the years to come, mostly driven by rising exposure in areas of wild-urban-interface, a multi-year drought in western US, where most of these losses originate, and often sub-optimal fire management strategies that increase natural biomass fuels on the ground.
In California, increases in autumn temperatures alongside decreases in precipitation have more than doubled the number of days per year with high fire risk since the 1980s. Longer fire seasons in an increasingly warmer planet (for instance the Colorado Marshall fires, the costliest wildfire of 2021, occurred in winter at the end of the year) also increase the loss potential.
A return to long-term NatCat trend
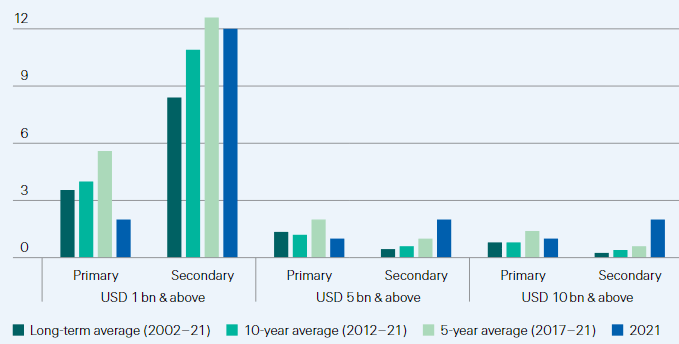
The past five years have coincided with heightened insured losses from primary and secondary perils. Over time, the frequency of all large loss-making events has risen.
The number of events resulting in insured losses of USD 1 billion or above increased from 6 on average annually from 1991 to 2010, to over 15 annually from 2011 to 2021 (see Global Insurance-Linked Securities Market Outlook). Two-thirds of the increase is attributable to secondary perils.
Average global insured losses from natural catastrophes in 2017–2023 were USD 101 bn, more than double the USD 48 bn in the prior 5-year period. In our view, the increase does not represent a step-change in the growth rate of annual insured losses.
The past five years have seen some very large disaster events, including Hurricanes Harvey, Irma and Maria in 2017, Typhoon Jebi in 2018, and large-scale wildfires in California and Australia (2017, 2018, 2019 and 2020), all of which have made for dramatic headline losses.
Even so, coming after a benign phase for the industry between 2012–2016, the elevated losses of the past five years have brought the rate of increase of insured losses back to the long-term average growth trend of 5–7%.
Global natural catastrophe insured losses and 10-year average in USD billion and number of events
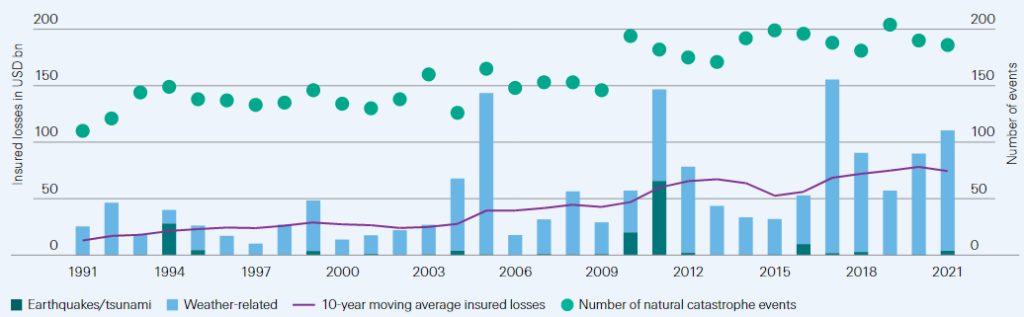
Rising losses have been mostly driven by socio-economic factors. Economic growth and urbanisation have generated ever-higher values of assets in areas exposed to natural catastrophes.
After normalising for GDP growth effects, the average annual growth rate of economic losses between 1980 and 2021 is 0.91%.
This shows that an historic event, if it were to occur at same severity today, would result in higher losses based on the accumulation of economic value over the past 40 years alone.
Further, disasters typically trigger a surge in demand for insurance locally. With more households and businesses needing repair work, the price of that work goes up. Of late, broader inflationary pressures have also contributed to higher insured losses.
Inflation has risen at a rate well-above the surge in demand for insurance attributable to events like Hurricane Ida.
The pandemic has disrupted global supply chains and also led to labour shortages, low inventories and an energy crisis, among others. In addition, the scale of fiscal stimulus packages have been unprecedented, leading to overheating in several economies including the US, and fuelling higher inflation; this has amplified the losses resulting from catastrophe events.
Average number of natural catastrophe events with insured losses of USD 1bn and above
The losses of some of last year’s events were also exacerbated by infrastructure vulnerabilities. In the case of Hurricane Ida, the New York City transport system was inundated by the rains that came in the wake of the storm.
The investments in sea barriers and other coastal protections following the storm surge from Hurricane Sandy in 2012 could do nothing against stormwater in the city away from coastal areas.
Meanwhile, winter storm Uri exposed the vulnerability of Texas’ energy grid. Massive power failures played a big role in the record losses from Uri.
Temperatures below zero for two weeks caused much of the equipment to freeze, resulting in widespread blackouts. Owing to the state’s grid independence, the authorities could not import energy from neighbouring states, leaving millions of residents without power for several days.
Tragically, Uri resulted in an estimated 226 deaths. There were also a very high number of insurance claims to cover for the cost of repairing burst water pipes.
That different factors contribute to the large losses from catastrophe events is not new knowledge. But the loss experiences of 2021 strengthen the case for broader and more uniform risk costing procedures.
This includes expanding the range of perils and the number of countries monitored, and accounting for the full range of risk drivers and contingencies from secondary effects. Historically, re/insurers and the modelling industry have focused more on peak severity perils (earthquakes, tropical cyclones), Secondary perils have received less attention, and so too the increasingly evident effects of global warming, urbanisation, land-use changes, and other socio-economic macro-trends.
This has likely led to some underestimation of actual exposures to catastrophe risks. For example, based on the analysis of insurance loss data from Swiss Re’s sigma database, a recent study by S&P Global estimates that a USD 150 billion insured loss event has an empirical return period of 10 years.
Considering the exposures of the top 21 global reinsurers, however, the study also estimates that on average, industry models see losses of such magnitude occurring only once in every 20 to 30 years.
More rigorous assessment and modelling of flood risk is specifically pressing. Currently flood is considered a secondary peril. Though there have been improvements over the past decade, flood is still afforded less attention and rigour in exposure data and modelling data provisions than primary peril risks.
This is even with flood ubiquitous risk, affecting an estimated 2.2 billion people around the world, more than any other peril.
In addition to the flooding in central-western Europe and New York in the wake of Hurricane Ida, last year also brought record seasonal floods in China and India, and after Typhoon Rai in the Philippines. These events confirm that water inundation is one of the most destructive and recurrent perils globally and, further, one that demands closer attention.
Global insured losses from flooding since 1991(in USD billion)

Historically, Asia has suffered the highest flood-related economic losses. In 2011–2020, economic losses from flood events averaged almost USD 30 billion annually, these including the Thailand flood of 2011. In terms of insurance coverage, though, Asia has lagged Europe and North America.
This was the case in 2022 also, when flood-related insured losses were USD 3 billion, or 11% of economic losses. In Europe and North America, the shares of economic losses covered by insurance were 32% and 36%, respectively.
There were more than 20 severe floods in Asia last year, once again the highest number of any region. Seasonal floods in China were the most severe in economic loss terms, those rising to USD 23 billion. Henan province was hardest hit. The associated insured losses, however, were just USD 2.3 billion, again indicative of a large flood protection gap.
…………………….
AUTHORS: James Finucane – Senior Economist, Swiss Re Institute, Thomas Holzheu – Chief Economist Americas, Swiss Re Institute