Overview
- Federal Judicial Court Civil Cases
- Frequency of Motor Vehicle Tort Filings
- FJC Clearance Rate
- Focusing on Motor Vehicle Tort Civil Cases
- The Value of Federal Judicial Court Motor Vehicle Tort
- Extrapolation of Motor Vehicle Tort Civil Case Filings
- Extrapolation of Motor Vehicle Tort Civil Case Dispositions
A civil case in the United States is a legal dispute between two or more parties seeking compensation rather than criminal penalties for issues involving human rights, contracts, personal injury, product liability, property disputes, or family matters.
The Insurance Information Institute highlights rising case volumes, inconsistent state court data, and the impact on insurance costs nationwide. Beinsure analyzed report and highlighted key points.
Triple-I revealed an estimated $42.8 bn in excess litigation value from motor vehicle tort cases filed over the past 10 years in both federal and state civil courts across the United States.
Drawing on data from the Federal Judicial Center and a curated sample of state court systems, the study highlights a sharp rise in motor vehicle-related litigation and emphasizes how incomplete and inconsistent state-level civil court data hinders transparency and reform.
A civil case filing may be settled out of court, go to trial, or be dismissed for legal or procedural deficiencies. If the case goes to trial, the judge or jury may award damages or actions to either the plaintiff or defendant, at which point either party may appeal to a higher court.

Triple-I’s latest research uses data to illustrate that the big business of U.S. law is only getting bigger, and it’s increasing insurance costs for all Americans.
Sean Kevelighan, Triple-I CEO
“Billboard attorneys and their billions spent on advertising to exploit and drive consumers toward litigation are not just annoying, they are making everyone victims of legal system abuse”, said Sean Kevelighan.
- Civil cases in the United States are handled by either the federal or state courts. Federal courts handle those civil cases involving federal laws, constitutional issues, and diversity of citizenship (citizens of different states) where the amount demanded exceeds $75,000 (see US Auto Insurance Rates by States).
- At the state level, civil cases are directed to either the small claims court system or higher courts for more complex cases and those meeting a minimum monetary demand threshold. These thresholds vary by state but are typically $20,000 or more.
“This study highlights how increasing tort litigation, particularly in the motor vehicle sector, is driving up insurance premiums,” said Patrick Schmid, Ph.D., chief insurance officer at Triple-I.
We urgently need standardized, publicly accessible civil case data from all 50 states and Washington D.C. Transparency is essential for understanding and addressing the effects of legal system abuse on both consumers and insurers.
Patrick Schmid, CIO at Triple-I
The findings reinforced previous research conducted by Triple-I and the Casualty Actuarial Society, which estimated $118.9 bn in combined economic and social inflation on auto liability insurance
Key Findings
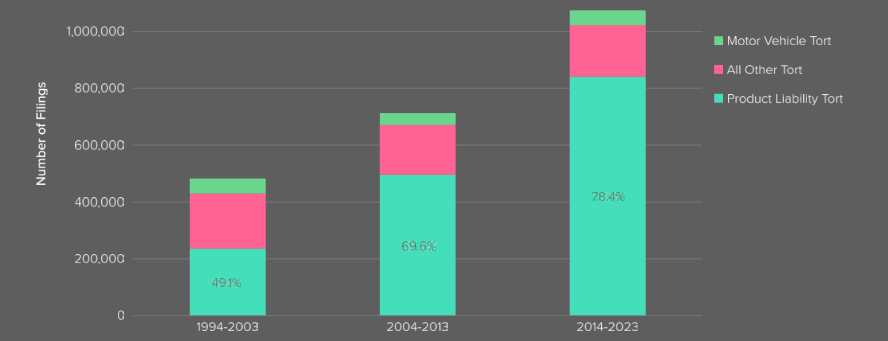
- From 1994 to 2003, 18.8% of all civil cases involved tort. This number increased to 33.8% from 2014 to 2024, 49.1% of all tort civil cases involved product liability. This number increased to 78.4%.
- Excluding multi-district litigation and product liability, the volume of total civil cases has been relatively flat from 1994 to 2024.
- From 2014 to 2024, the number of motor vehicle filings increased at a compound annual growth rate (CAGR) of 4.1% for no-fault states and at 5.5% for tort states.
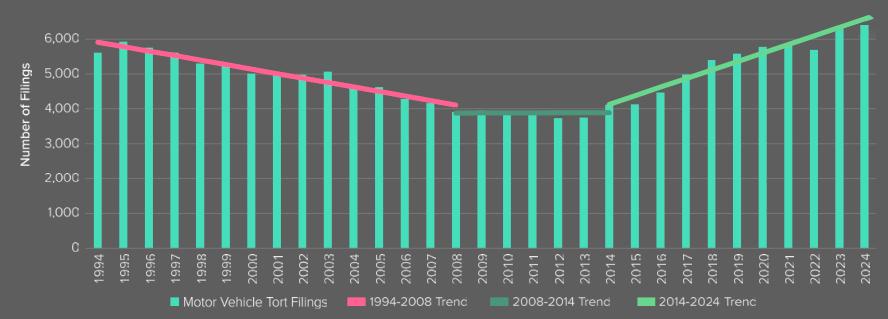
- The volume of motor vehicle tort civil cases decreased at a CAGR of 2.6% from 1994 to 2008, remained relatively flat from 2008 to 2014 at 0.1%, and then rose to 4.9% from 2014 to 2024.
- Approximately 52.8% of disposed motor vehicle tort civil cases settled out of court, with only 7.4% receiving a judgement disposition, according to U.S. Personal Auto Insurance Market Trends.
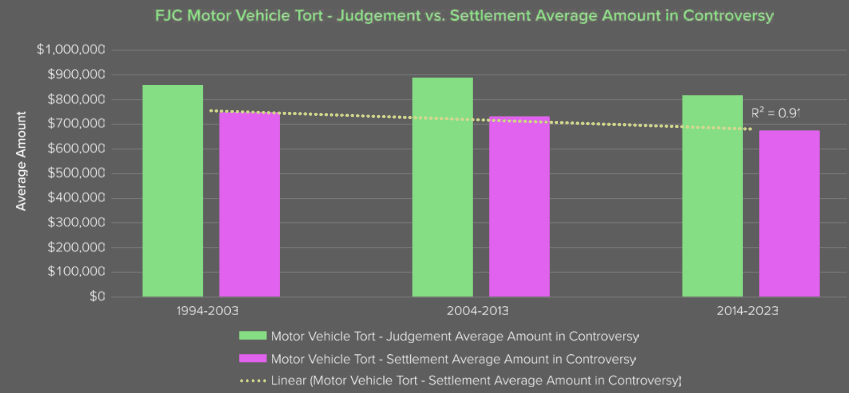
- The average amount in controversy for judgements increased for all civil cases (excluding multi-district litigation and product liability) from $447,000 during the 1994–2003 decade to $875,000 during the 2014–2023 decade. During these same periods, the amount in controversy for judgement for motor vehicle tort civil cases remained flat, while the average amount in controversy for settlements decreased from $748,000 to $674,000.
These cases are also considered unlimited civil cases in all courts given there is no limited maximum monetary demand.
At the federal level, public data on civil cases is available through the government website for Federal Judicial Courts of the United States.
At the state level, the availability of public data varies from state to state and from court to court, as do the definitions of terms and the completeness of case reporting.
Given this inconsistency, previous research by the University of Michigan Law School concluded that reasonable estimates based on court data can be drawn with caution.
This paper interprets and extrapolates such data with a focus on tort cases involving motor vehicle accidents to better understand overall trends in civil cases on a relative basis countrywide.
Litigation from motor vehicle accidents is a significant cost driver in both commercial and personal auto insurance, with the frequency of motor vehicle tort case filings increasing between 2014 and 2023 even as accident rates generally declined.
Triple-I’s report quantifies the financial impact of this excess litigation, providing an estimate based on civil court data and highlighting the challenges of accurately comparing state-by-state trends (see about Rising Auto Insurance Costs).
Federal Judicial Court Civil Cases

The findings provide a framework for future research and underscore the need for complete, publicly available civil court data to better identify and understand national trends in litigation.
From 1994 to 2019, the total number of civil case filings increased slightly at a CAGR of 0.9%. In 2020, that number increased by 67% year-over-year.
The recent trend in all civil cases is distorted by significant litigation around product liability. As highlighted by the Supreme Court’s Report on the Federal Judiciary, earplug product liability and multi-district litigation (MDL) cases represented 25.8% of civil cases from FY2020 through FY2023.
Distribution of All Federal Judical Court Case
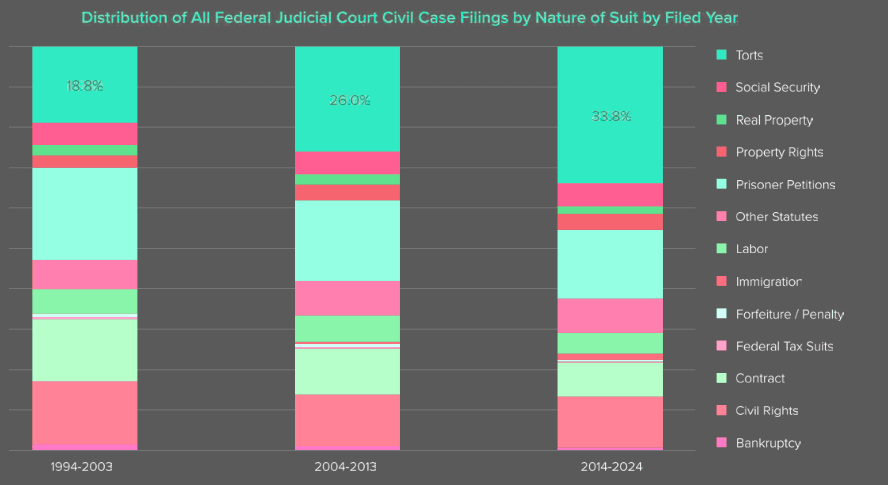
Because Federal Judicial Court does not provide an indicator of specific product liability types to this level of distinction, the influx in 2020 and the variance of cases year-over-year can be mitigated by excluding MDL and product liability civil cases.
Removing these cases establishes a stabilized average of 229,000 a year from 1994 to 2024 with a relative standard deviation of only 4.4.
Due to this extreme and abnormal variability, our report excludes MDL and product liability cases when assessing motor vehicle tort civil cases against total civil cases.
Federal Judical Court Tort Civil Cases Fillings
Though motor vehicle civil cases declined at a CAGR of 2.6% from 1994 to 2008 and remained relatively flat from 2008 to 2014 at 0.1%, they later increased at 4.9% from 2014 to 2023.
For purposes of determining the impact of this increase in 2014 to 2023 we use the time period from 2008 to 2014 as a steady state which has a flat trend (0.1%) in the volume of cases.
Number of Federal Judical Court Tort Civil Cases Fillings
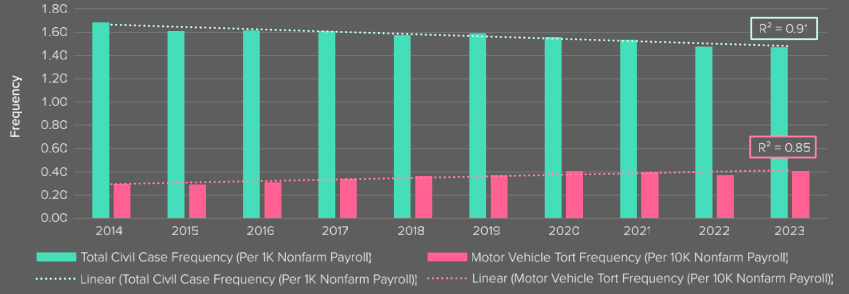
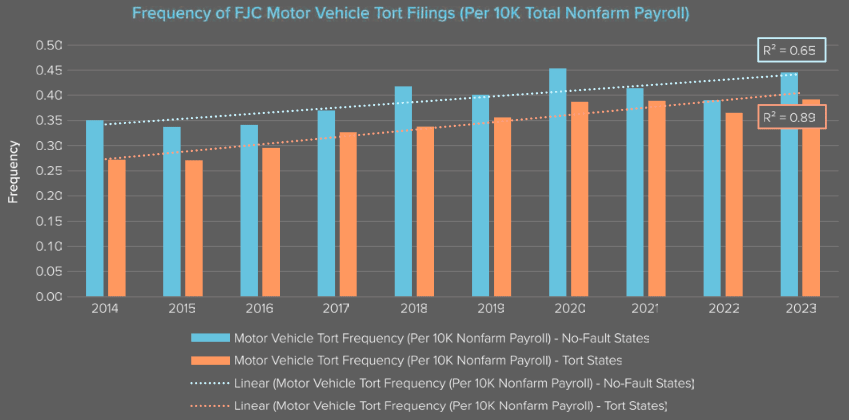
To calculate a measure of litigation frequency, we adjusted the number of cases for the size of the economy. Based on Total Nonfarm Payroll employee counts, frequency for total civil cases declined at a CAGR of -1.5% from 2014 to 2023, whereas motor vehicle tort case filings rose by 4.9% during the same period.
Frequency of Motor Vehicle Tort Filings
Similarly, the frequency of motor vehicle tort filings for no-fault states using the total nonfarm payroll aggregate of those states also increased at a lower CAGR of 2.7% from 2014 to 2023, compared to the CAGR of 4.1% for tort states.
Frequency of Total and Motor Vehicle Tort Filings
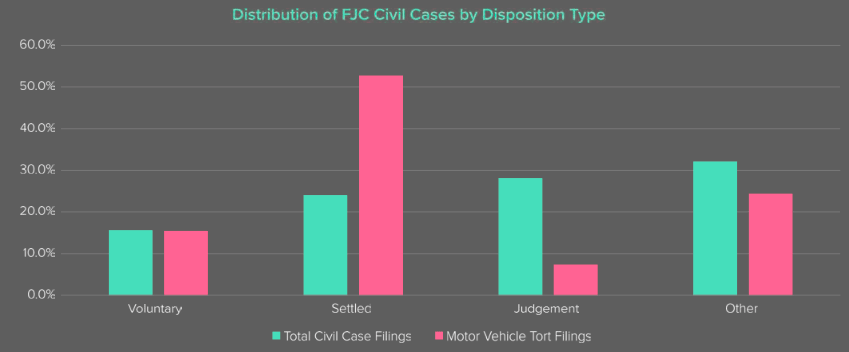
Civil case filings may be disposed voluntarily, by judgement, by settlement out of court, or due to case deficiencies or pursuit of criminal conviction.
Frequency of Motor Vehicle Tort Filings
From 2014 to 2024, the distribution of dispositions by settlement for motor vehicle tort cases was 52.8% — more than double that for total civil cases, which was 24%.
In contrast, the distribution of dispositions by judgement was only 7.4% for motor vehicle tort cases compared to 28.2% for total civil cases overall.
The combined 10-year average distribution of settlements and judgements for motor vehicle tort cases from 2014 to 2023 is 60.2%.
Segmenting FJC data between no-fault states and tort states results in 61.5% of motor vehicle tort dispositions by settlement or judgement for no-fault states and 59.5% for tort states. Using the rate of settlements and judgements per filing instead of rate per disposition as the basis, this is 59.5% for no-fault states and 55.7% for tort states.
FJC Clearance Rate
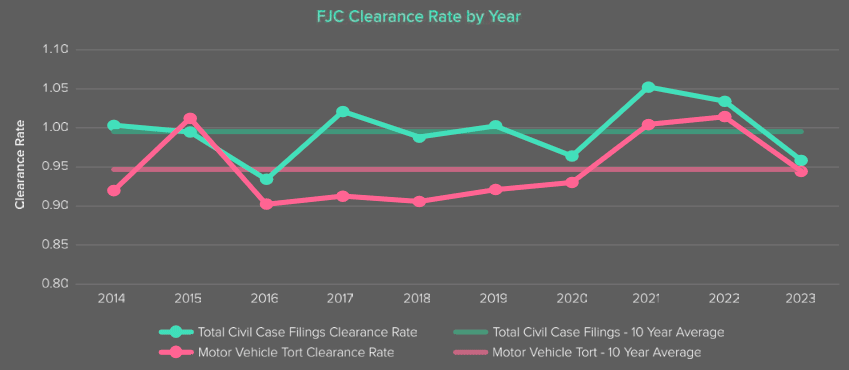
According to the report COVID-19 and the U.S. District Courts: An Empirical Investigation, clearance rates — the number of cases disposed divided by the number of cases filed in each 12-month period — fluctuated during the COVID-19 pandemic and post-pandemic years.
However, with the exception of 2015, the clearance rate for motor vehicle tort cases was lower than that for total civil cases each year from 2014 to 2023, at a 10-year average of 0.95 versus 1.00.
This slight but consistent backlog in cases for motor vehicle tort is also demonstrated in the time between filing and disposition per case. On average, motor vehicle tort civil cases require slightly more than 1 additional month, or 36 days, to be cleared compared to total civil cases from 2014 to 2023.
Focusing on Motor Vehicle Tort Civil Cases
Focusing on motor vehicle tort civil cases, the average amount in controversy for dispositions of judgement fluctuated around $850,000 across the three decades.
For dispositions of settlement, the average amount in controversy decreased -2.3% from the 1994–2003 to 2004–2013 decades and fell an additional -7.8% during the 2014–2023 period.
Isolating civil cases in favor of the plaintiff and using a three-year smoothing method to remove year-over-year fluctuation, the average amount awarded for total civil cases increased from $470,000 in 2014 to $623,000 in 2023, at a CAGR of 3.2%.
During this period, motor vehicle tort cases received a higher award every year (excluding 2018).
From 2014 to 2023, the 10-year average amount in controversy for motor vehicle tort settlements and judgements in favor of the plaintiff was $674,000.
Analyzing this finding against no-fault state regulations reveals an average amount of $725,000 for no-fault states, which is 11.5% higher than the $650,000 average for tort states.
The Value of Federal Judicial Court Motor Vehicle Tort
From 2014 to 2023, the total number of motor vehicle tort cases filed in the FJC was 17,666 for states with no-fault laws and 34,667 for tort states.
Applying the disposition rate of settlement and judgements to these volumes and then multiplying by the average amount in controversy and the excess percentage of filings above the previously established flat trend results in an excess value of $984.6 mn.
- FJC motor vehicle tort filings: 17,666 (no-fault states), 34,667 (tort states), 52,333 total
- Disposition rate of settlements and judgements: 59.5% (no-fault), 55.7% (tort)
- Average amount in controversy: $725,000 (no-fault), $650,000 (tort)
- Excess percentage of filings above trend: 4% (no-fault), 5.4% (tort)
- Total excess value: $305.8 mn (no-fault), $678.8 mn (tort), $984.6 mn combined
Because states maintain different definitions and criteria for data collection, most state civil case data is either unavailable or incomplete. Some states have technology or resource limitations that further constrain consistent reporting.
This lack of uniformity complicates national-level analysis of civil case trends at the state level, particularly for motor vehicle torts.
Extrapolation of Motor Vehicle Tort Civil Case Filings
To develop a calculation for state filing volumes that included states without publicly known civil case data, we extrapolated the ratio:
known Federal Judicial Court volumes for states with known data ÷ known state volumes
for both no-fault states combined and for tort states combined.
The FJC volumes for no-fault states with no available data were then multiplied by the no-fault ratio, and similarly for the tort states.
From 2014 to 2024, motor vehicle tort state cases increased at a CAGR of 2.6%. After applying our extrapolation method, this number remained at 2.8%.
- For no-fault states, motor vehicle tort state cases from 2014 to 2023 increased at a CAGR of 2.3%, which lowered slightly to 2.1% after extrapolation.
- For tort states, the CAGR increased slightly from 2.8% to 3.1% after extrapolation.
Based on this methodology, the total estimated number of motor vehicle tort state cases from 2014 to 2023 is 5.04 mn, with 1.56 mn from no-fault states and 3.48 mn from tort states.
Extrapolation of Motor Vehicle Tort Civil Case Dispositions
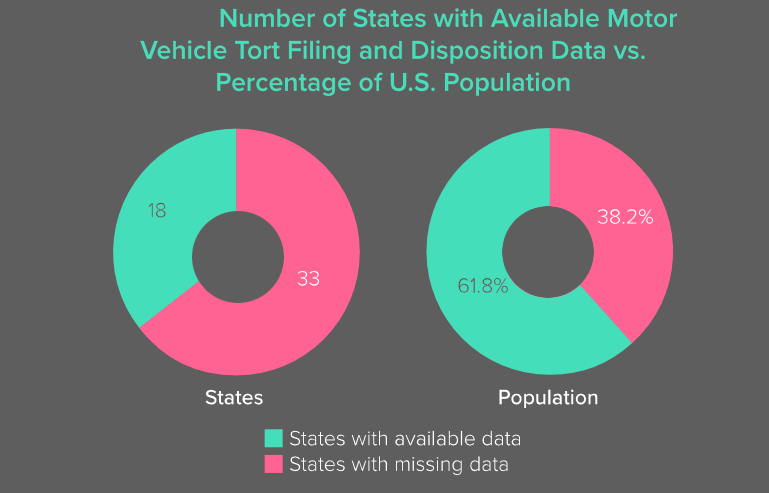
We found only 6 states providing public data for motor vehicle tort civil cases with a count of cases resulting in settlement or judgement from 2014 to 2023: California, Texas, Florida, New York, North Carolina, and New Jersey.
In aggregate, these states represent 39.3% of the population in 2024 and 38.9% of total nonfarm payroll in 2023.
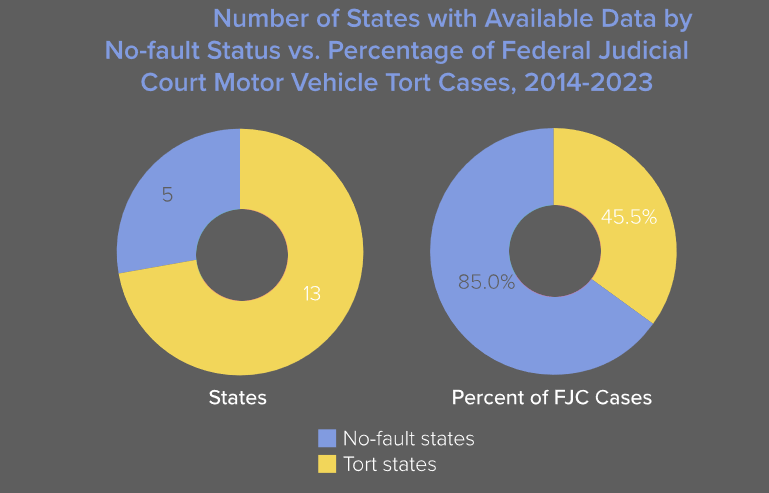
These states also represent 34.4% of FJC motor vehicle tort filings from 2014 to 2024, including 56.9% of no-fault states and 22.7% of tort states.
The average disposition rate of settlements and judgements of motor vehicle tort state civil cases for these 6 states is 42.1%, with no-fault states at a rate of 36.3% and tort states at a higher rate of 48.3%.
Amount in Controversy for State Civil Cases
Publicly available data on amount demanded or awarded in motor vehicle tort state civil cases is either incomplete or does not exist.
The minimum threshold for the amount in controversy for civil cases to escalate to FJC is $75,000, which Congress established through the Federal Courts Improvement Act of 1996 to reduce the number of civil cases filed at the federal level.
Each state court system, however, applies its own minimum threshold for courts above small claims courts. Mississippi maintains the lowest at $3,500 and Washington has the highest at $75,000.
Methodology
The methodology of our analysis focuses on the years 2014 to 2023 for the following reasons:
- To avoid data limitations, as many states lack published 2024 data.
- To avoid potential extended clearance rates and delays in disposition timing of new filings in 2024, which would delay or minimize actual volumes and therefore impact 2024 disposition rates.
- To compare results with the Triple-I and CAS joint report on Increasing Inflation.
The results in this report are based on several sources of information. Federal Judicial Court civil case data is sourced from the Federal Judicial Center’s tab-delimited Civil Case Cumulative File (including all cases terminated 1988 through March 31, 2025) and Integrated Data Base Civil documentation to identify fields and code mappings.
Specific data on the number of dispositions settled outside of court or of dispositions judged in favor of the plaintiff with verified dollar amounts is extremely limited and therefore unusable for this analysis.
State civil case data is sourced from state court system databases available online. Standardization of data across states, including for the minimum threshold for demanded amount in controversy and for the name and structure of the court system itself, does not exist.
A summary of state court systems, minimum thresholds, and civil case data availability is provided in Appendix B, along with links to judicial court websites by state.
FAQ
A civil case is a legal dispute between two or more parties seeking compensation rather than criminal penalties. Civil cases may involve human rights, contracts, personal injury, product liability, property disputes, or family matters. They can be settled out of court, proceed to trial, or be dismissed for legal or procedural reasons.
Triple-I revealed an estimated $42.8 bn in excess litigation value from motor vehicle tort cases filed between 2014 and 2024 across both federal and state civil courts in the U.S.
Data from state courts is often incomplete, inconsistent, or unavailable, which hinders transparency, makes comparisons difficult, and slows reform. This contrasts with federal-level data, which is more systematically published.
Federal courts deal with cases involving federal laws, constitutional issues, and disputes between citizens of different states where the amount exceeds $75,000.
State courts hear smaller claims in small claims courts, while more complex cases (typically with thresholds above $20,000) go to higher state courts. These are considered unlimited civil cases since there is no maximum demand cap.
From 1994–2003, 18.8% of civil cases involved tort; from 2014–2024, it rose to 33.8%. Product liability made up 49.1% of tort cases in 1994–2003, increasing to 78.4% in 2014–2024. Excluding MDL and product liability, total civil case volume has been flat.
Motor vehicle tort cases: Fell at a CAGR of -2.6% (1994–2008), Flat at 0.1% (2008–2014), Rose at 4.9% (2014–2024).
From 2014–2024, 52.8% of motor vehicle tort cases were settled, while only 7.4% ended in judgement (vs. 28.2% for all civil cases).
Judgement amounts for all civil cases rose from $447,000 (1994–2003) to $875,000 (2014–2023).
Motor vehicle tort judgement amounts stayed flat, while settlements fell from $748,000 to $674,000.
Motor vehicle accident litigation is a major driver of insurance costs, even as accident rates have declined. Triple-I’s report shows how excess litigation inflates costs nationwide, fueled in part by heavy attorney advertising. This creates higher insurance premiums for all U.S. drivers.
…………………
AUTHORS: Patrick Schmid – Ph.D., Chief Insurance Officer at Triple-I, Sean Kevelighan – Triple-I CEO