Overview
The United States personal auto insurance industry experienced its best underwriting result in the post-pandemic era with a net combined ratio of 95.3 in 2025, according to Triple-I report. Beinsure has analyzed auto insurance market data and highlighted new trends.
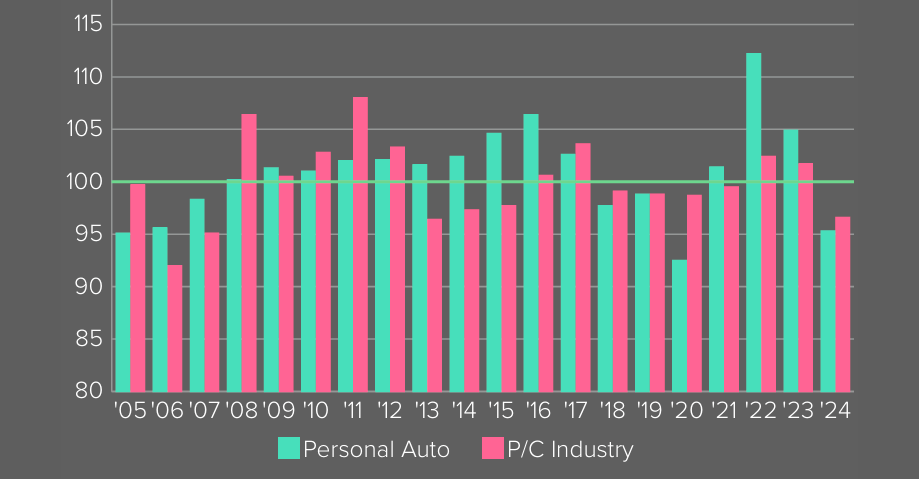
The line which represents more than a third of the industry on a premium basis and twice as much as the next largest line of insurance, has outperformed the net combined ratio of the P&C insurance industry 10 out of the 20 years since 2005.
Insurers’ underwriting profitability is measured by a combined ratio, which is calculated by dividing the sum of claim-related losses and expenses by premium. A combined ratio under 100 indicates a profit. A ratio above 100 indicates a loss.
Key Highlights
- In 2024, the personal auto insurance sector achieved a net combined ratio of 95.3—the most profitable result in the post-pandemic period.
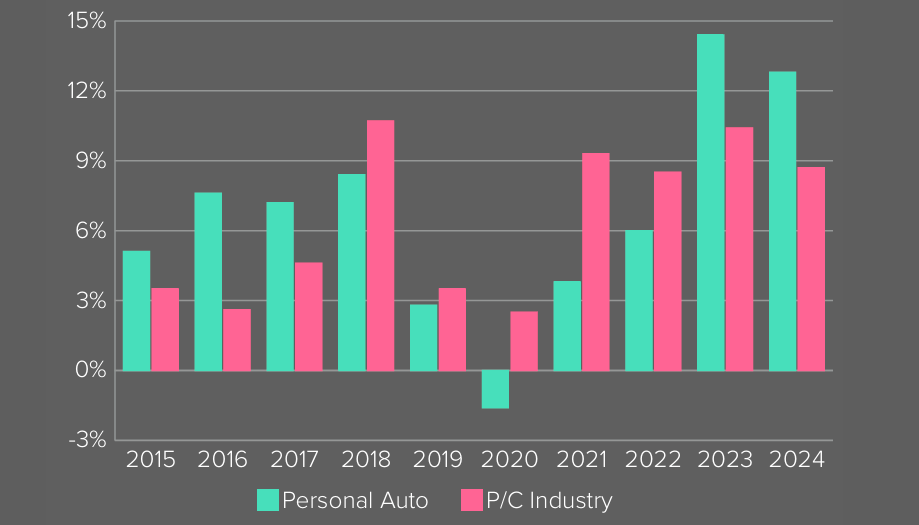
- Personal auto premiums rose sharply in 2023 and 2024, with growth rates of 14.4% and 12.8%, outpacing the broader P&C industry after years of slower growth.
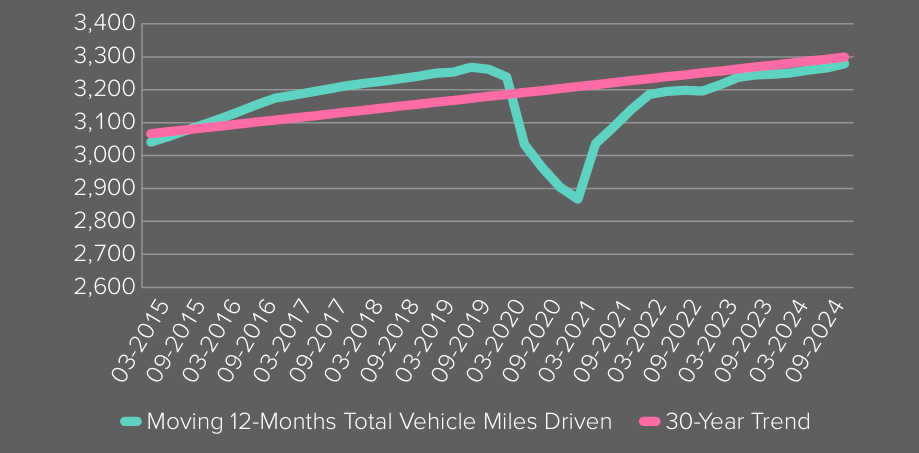
- There is a perfect positive correlation between changes in vehicle miles driven and net written premium, reaffirming the close relationship between driving behavior and premium levels.
- Insurance rate changes show over 70% correlation with CPI trends for vehicles, parts, and repair services, highlighting inflation’s direct role in premium adjustments.
- From 2014 to 2023, legal system abuse led to $76.3bn–$81.3bn in added losses and DCC expenses, driven by increased litigation, higher jury awards, and greater attorney involvement.
Personal auto insurance underwriting profitability appears to finally be headed in a positive direction after recent years of record underwriting losses. But while these gains show improvement, it will likely take time for them to be reflected in flattening premium rate, Beinsure noted.
Personal auto insurance premium
From 2018 to 2022, the net written premium growth rate in the property and casualty insurance industry outpaced that of personal auto.
However, personal auto experienced a marked reversal in 2023 and 2025, recording double-digit growth rates of 14.4% and 12.8%, respectively.
These increases reflect a significant rate recalibration following the effects of the COVID-19 pandemic (see 2025 Personal Auto Insurance Rates).
In 2020, personal auto premiums declined for the first time since 2009. This was the only instance of decline between 2009 and 2024 and coincided with a sharp reduction in total vehicle miles driven due to pandemic-related restrictions across the United States.
While the improved 2024 underwriting performance is encouraging, we remain focused on several challenges facing the personal auto insurance industry.
Sean Kevelighan, Triple-I CEO
“The growing impacts of legal system abuse, driven by the exploitive tactics of billboard attorneys, combined with an increasingly complex regulatory environment, will continue to put pressure on the market. It’s essential for auto insurers to continue managing these evolving risks effectively to sustain profitable growth”, Sean Kevelighan said.
Net Combined Ratio
Since then, total vehicle miles driven have returned to align with the 30-year historical trend (see US Auto Insurance Rates by States).
There is a perfect positive correlation between changes in vehicle miles driven before the pandemic, during its onset, and in the post-pandemic period, and the corresponding shifts in net written premium across these same periods.
This relationship highlights the direct influence of driving behavior on premium patterns in the personal auto insurance segment.
Net Written Premium Growth Rate
Replacement costs for personal auto – based on indicators such as new and used vehicle prices, motor vehicle parts and equipment, and maintenance and repair services – have risen substantially since the pandemic began. In response, insurers have adjusted rates to reflect these elevated costs (see U.S. Personal Auto Insurers See Strong Recovery).
From 2015 to 2025, year-over-year (YoY) changes in specific Consumer Price Index (CPI) components show strong correlations with the average rate changes implemented by insurance carriers.
These correlations exceed 70%, highlighting the connection between inflationary trends in auto-related goods and services and pricing strategies in the insurance sector, Beinsure noted.
Total Vehicle Miles Driven (mn)
The correlation between the YoY CPI change for new vehicles and insurance rate adjustments is 88% when the CPI data is shifted forward by one year.
For motor vehicle parts and equipment, the correlation reaches 74% under the same one-year forward shift. Used vehicle CPI changes show a 79% correlation when shifted forward by two years.
The YoY CPI change for motor vehicle maintenance and repair aligns with insurance rate changes at a 78% correlation, without the need for a time shift.
Price changes in personal auto insurance
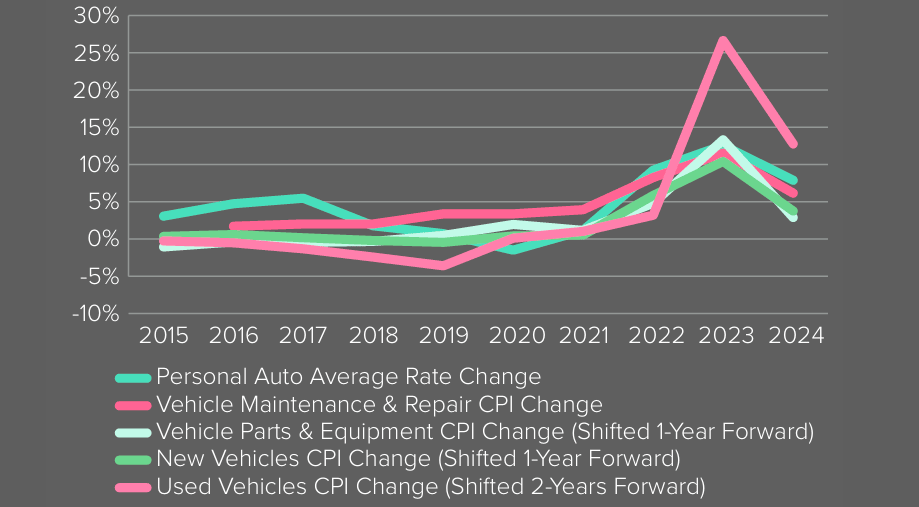
These figures indicate that inflation in vehicle-related expenses is a key driver in insurance rate-setting, with varying lag effects depending on the category.
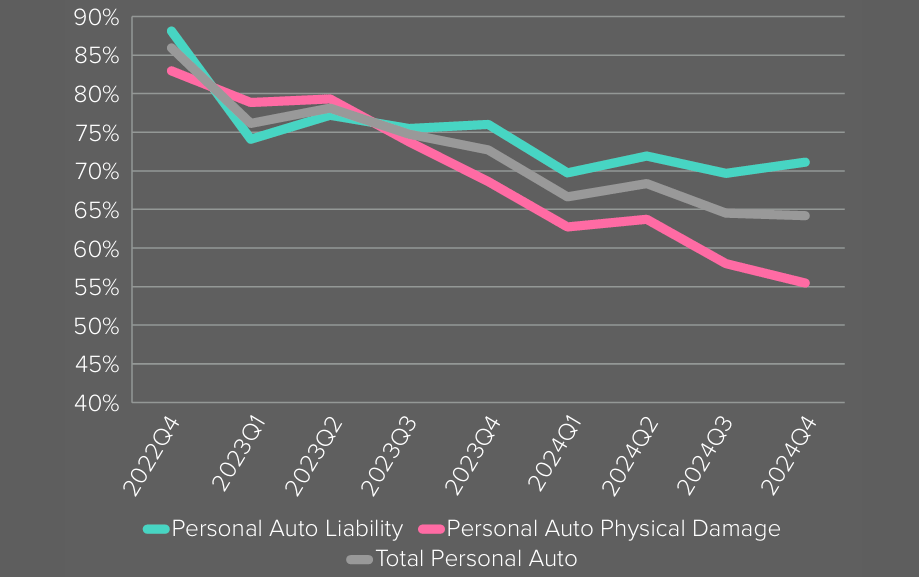
Personal auto insurance losses
Personal auto direct incurred loss ratio has improved 21.7 points from a peak of 86% in the fourth quarter of 2022 to 64% at the end of 2025 (see TOP 20 US Auto Insurers Underwriting Results).
However, improvement has varied between auto physical damage and auto liability, with more improvement in auto physical damage than auto liability.
This disparity has reached 15.7 points in the fourth quarter of 2025, the largest difference in over 10 years.
Direct Incurred Loss Ratio by Quarter
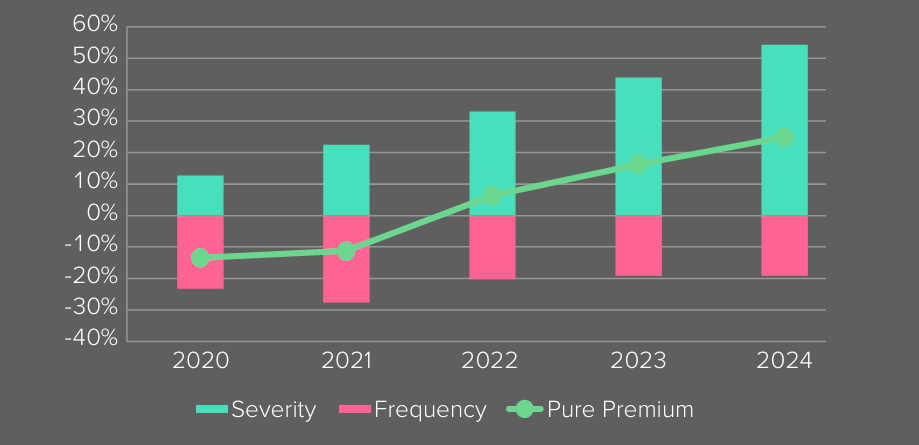
Loss trends in personal auto are driven by claim frequency and claim severity. For personal auto liability, frequency dropped in the first year of the pandemic and has remained below pre-pandemic levels, but severity has increased YoY.
The pure premium trend has increased a cumulative 25 points from 2019 to 2024, a compound annual growth rate of 4.6 points, driven primarily by the average cost of claims during this period, which increased a cumulative 54.2 points, Beinsure noted.
Rising severity in personal auto liability
Rising severity in personal auto liability reflects increasing legal system abuse, which includes higher levels of litigation, more frequent large jury awards, and greater attorney involvement in claims.
This trend contributes to inflation and has significantly impacted auto liability losses and defense and cost containment (DCC) expenses.
Between 2014 and 2023, these costs increased by an estimated $76.3bn to $81.3bn, based on the latest study by Triple-I and the Casualty Actuarial Society.
A report from the Insurance Research Council on rate regulation in personal auto insurance highlights that the approval process for rate filings became more burdensome nationwide between 2010 and 2023.
Personal Auto Liability – Cumulative Change in Pure Premium
The average number of days to secure approval increased by 40%, while the share of filings approved at lower-than-requested rate levels rose by 10 percentage points.
These regulatory delays and limitations reduce the availability of competitively priced auto insurance policies, restricting consumer access to appropriate coverage.
FAQ
The U.S. personal auto insurance industry posted a net combined ratio of 95.3 in 2026—the best result in the post-pandemic period. A combined ratio under 100 indicates underwriting profitability.
Between 2018 and 2022, the P&C industry’s net written premium growth outpaced personal auto. However, personal auto reversed this trend in 2023 and 2024, with growth rates of 14.4% and 12.8%, respectively, reflecting a rate recalibration after the COVID-19 pandemic.
There is a perfect positive correlation between changes in vehicle miles driven and net written premium growth in the periods before, during, and after the pandemic. This confirms that driving behavior strongly influences personal auto insurance premiums.
From 2015 to 2025, key CPI components showed strong correlations with insurer rate changes:
New vehicles: 88% correlation (1-year lag)
Motor vehicle parts & equipment: 74% (1-year lag)
Used vehicles: 79% (2-year lag)
Vehicle maintenance & repair: 78% (no lag)
These figures demonstrate the impact of inflation in vehicle-related expenses on rate-setting.
The direct incurred loss ratio declined from a 2022 peak of 86% to 64% by the end of 2025. Auto physical damage improved more than auto liability, with a 15.7-point disparity—the largest in over a decade. While claim frequency dropped post-pandemic, severity increased, leading to a 25-point cumulative rise in pure premium since 2019.
Legal system abuse has contributed to increased severity. Factors include more litigation, higher jury awards, and greater attorney involvement. Between 2014 and 2023, auto liability losses and DCC expenses rose by an estimated $76.3bn to $81.3bn.
From 2010 to 2023, the average time to approve rate filings increased by 40%, and the proportion of approvals at reduced rate levels rose by 10 percentage points. These delays and constraints limit insurers’ ability to offer competitively priced coverage, reducing availability for consumers.
……………
AUTHOR: Sean Kevelighan – President and CEO at Insurance Information Institute (Triple-I)