Overview
- Key 2026 Auto Insurance Trends
- The average cost of auto insurance in the U.S.
- Personal Auto Insurance Expenditures
- States by highest effective Auto insurance rate
- How Are Car Insurance Costs Trending?
- Top 10 Most Expensive States for Auto Insurance
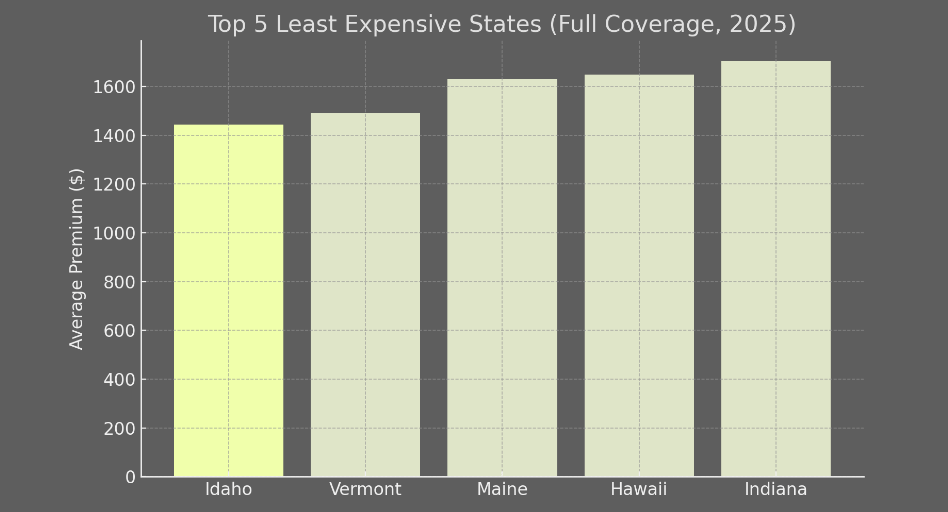
- Top 10 Least Expensive States for Auto Insurance
- Top 10 US Auto Insurers – Direct Premiums Written
- How to Save on Car Insurance?
US auto insurers are racing to increase premium rates as they seek to offset historically poor underwriting results. In 2026, U.S. auto insurance rates are projected to experience a smaller average increase of about 1%, following significant hikes in previous years.
While more than half of U.S. states may see rate drops, states like New Jersey (10.46% increase) and Nevada (6.42% increase) face the highest surges, while Idaho, Vermont, and Maine offer some of the lowest premiums.
There is a wide variance in the effective rate change between individual states, according to Beinsure’s data.
Key 2026 Auto Insurance Trends
- National Outlook: Average premiums are expected to stabilize compared to the 17% surge in 2024, with only a 1% average increase anticipated in 2026.
- Highest Cost States: New York has the highest average annual full coverage rate at $4,031, followed by high costs in Louisiana and Florida. Nevada is ranked 61% higher than the national average.
- Lowest Cost States: Idaho $1,473/year, Vermont $1,506/year, and Maine $1,651/year are among the cheapest for car insurance.
- Projected Rate Changes: More than 50% of states are expected to see rates drop, with Iowa (6.19%), Minnesota (5.29%), and Arkansas (4.70%) leading the decreases.
- Factors Influencing Rates: Rates are heavily influenced by economic factors, increased repair and medical costs, severe weather, and population density
Largest U.S. auto insurers continue to report underwriting losses despite sharper improvement in premium rates, with the 2026 marked by continued unfavorable claims severity and higher catastrophe related losses. Future profit improvement will continue to be hindered by unusually high loss severity.
The national average rate for full coverage car insurance is $2,637 and $682 for minimum coverage, but how much you’ll pay depends largely on where you live. The state you reside in is one of the biggest factors influencing the price of your auto insurance premium
- At the top is New York, where full coverage averages over $4,000 per year, driven by high repair costs, frequent claims, and expensive medical care.
- Idaho offers the lowest average car insurance rates in the U.S., with full coverage around $1,443 and minimum coverage at just $375 annually.
US private auto insurance premiums rose in the 2025 to $180 bn. Overall direct loss ratio for the business line also deteriorated, rising to 70%.
The rise in premiums can be attributed in part to carriers continuing to produce strong top-line growth as they attempt to catch up to fast-rising private auto loss costs via rate increases.
Cheapest States for 2026 (Annual Full Coverage)
- Vermont: $1,504
- New Hampshire: $1,650
- Maine: $1,701
- Idaho: $1,473
- Wyoming: $1,760
Factors That Affect Auto Insurance Rates
The cost of car insurance can be affected by factors such as:
- Age (younger drivers generally pay more)
- Gender (men typically pay more than women)
- Where you live (premiums may be higher areas with high crime or a lot of accidents)
- The vehicle you’re insuring (new cars cost more to insure than used cars)
- Your driving record (incidents and violations usually drive your costs up)
The type and amount of coverage you buy affects the cost of your car insurance. Most states require drivers to have a minimum amount of liability insurance.
If your vehicle is financed or leased, you are likely required to carry full coverage as a condition of your loan or lease agreement.
While the average costs in this article are good general guideposts, the actual cost of your car insurance could differ. To help find the best rates, take the time to compare insurance quotes from several insurers before buying a policy.
The average cost of auto insurance in the U.S.
Car insurance is like a fingerprint. Although your circumstances may seem similar, your personalized rating factors will cause your premium to vary from that of friends, family and the national average.
Although men tend to pay more for car insurance than women, this is not the case for 50-year-old drivers. 50-year-old women pay, on average, $2 more a year for full coverage car insurance than 50-year-old men.
Some vehicles experience higher average insurance premiums than others because of MSRPs, safety features, repair costs, parts availability and other variable characteristics. For example, the average cost of full coverage insurance for a Tesla Model 3 is 60% higher than for a Subaru Outback (see TOP 10 Largest U.S. Auto Insurance Companies).
Personal Auto Insurance Expenditures
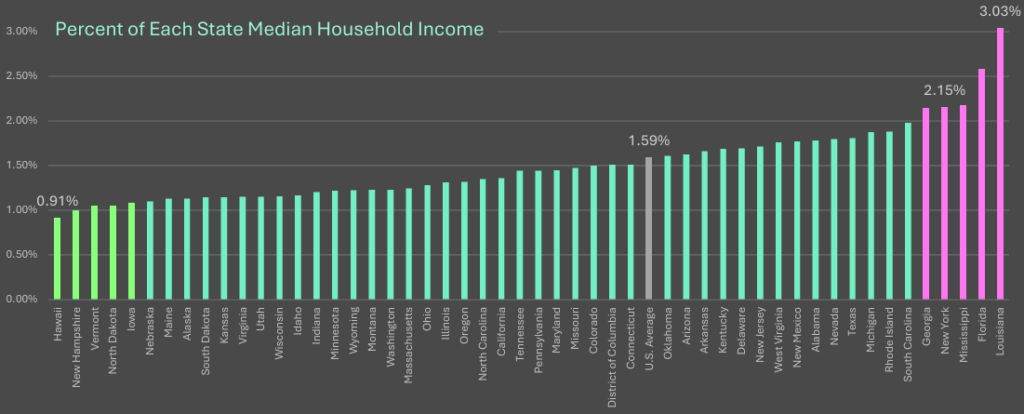
In total, 32 states reflect a double-digit increase based on about 12months of approved rate filings.
US auto insurance rate increases
The countrywide average will have increased by double digits in back-to-back years if this trend continues for the remainder of 2025. For several years prior to the current spike in private auto premiums, the average yearly change was a low single-digit increase.
The exception was in 2020, when COVID-19 spurred a rash of premiums credits to compensate consumers for their decreased driving habits.
Seven other states have a cumulative effective rate increase of 30% or more: Illinois, Ohio, Tennessee, Nevada, Arizona, Illinois and Utah.
States by highest effective Auto insurance rate
Beinsure synthesized data from Kiplinger and WNYAsset reports to compile this ranking. Top 10 states with the largest year-over-year percentage increase in average full‑coverage auto insurance rates from 2025 to 2026:
- North Carolina – roughly 25% increase
- Washington +25%
- Colorado +25%
- Florida +23%
- Minnesota +20%
- Arkansas +18%
- Wyoming – highest state increase at ~39% (this figure compares 2024 vs 2023; still the steepest jump among states)
- Other notable states with steep double‑digit increases include Maryland, Texas, Missouri, and New York, each exceeding +50% or showing the largest absolute premium increases—though exact year-over-year percentages may vary slightly depending on data source.
National auto premiums rose ~12% in 2025 versus 2024. States like North Carolina, Washington, and Colorado saw consistently high jumps driven by rising repair costs and increased theft rates.
Florida faced added pressure from hurricane exposure and a high rate of uninsured drivers. Wyoming’s nearly 39% increase stands out as the largest single-state surge year-over-year—even predating 2025.
How Are Car Insurance Costs Trending?
Car insurance costs have increased dramatically in the past few years. The rising cost of vehicles, parts and repairs, as well as the growing frequency of extreme weather events, have all played a role. The number of serious accidents leading to injuries, fatalities and lawsuits is also on the rise, escalating the cost of car insurance claims.
U.S. Average Annual Auto Insurance Premiums, 2023-2026
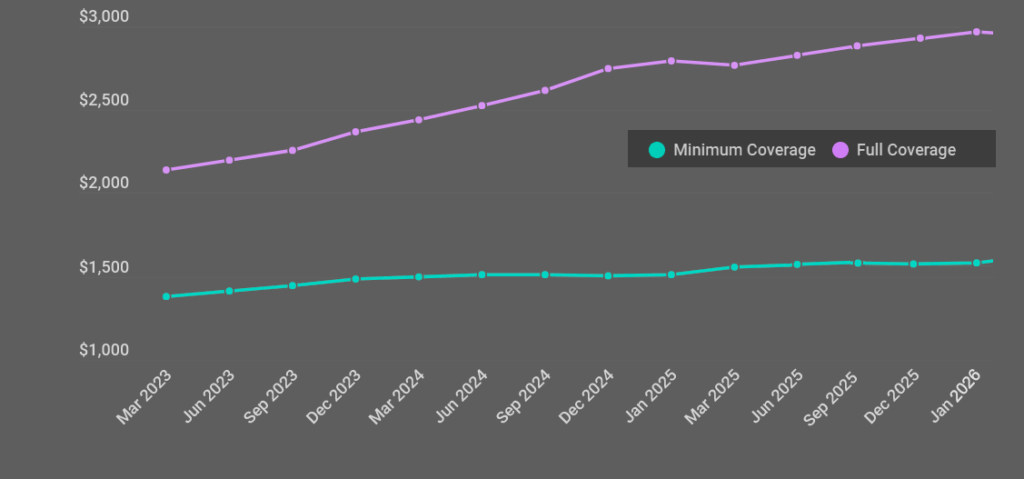
Rates have risen due to inflation affecting parts and repair costs. Other factors include higher population, crime rates, and weather trends. Additionally, more uninsured drivers and costly lawsuits contribute to higher premiums.
Auto insurance costs vary significantly across the United States, and the five most expensive states reflect a combination of factors such as population density, weather risks, fraud rates, and legal environments.
Top 10 Most Expensive States for Auto Insurance
- At the top is New York, where full coverage averages over $4,000 per year, driven by high repair costs, frequent claims, and expensive medical care.
- Louisiana follows closely, with rates near $3,950, influenced by extreme weather events, litigation frequency, and dense urban centers.
- Florida ranks third, with premiums averaging $3,874, largely due to hurricane exposure, a high volume of uninsured drivers, and fraud.
- In Nevada, rates exceed $3,600, affected by rapid population growth, rising accident rates, and increased vehicle theft.
- Michigan rounds out the top five, where average full coverage surpasses $3,200 due to its complex no-fault insurance laws and historically high medical benefit requirements.
| Rank | State | Full Coverage ($) | Minimum Coverage ($) |
| 1 | New York | $4031 | $1729 |
| 2 | Louisiana | $3953 | $1014 |
| 3 | Florida | $3874 | $1056 |
| 4 | Nevada | $3626 | $1081 |
| 5 | Michigan | $3236 | $903 |
| 6 | Colorado | $3230 | $570 |
| 7 | California | $3102 | $915 |
| 8 | New Jersey | $3027 | $1316 |
| 9 | Rhode Island | $2960 | $916 |
| 10 | Maryland | $2946 | $1057 |
In 2026, the most expensive states for annual full-coverage car insurance are consistently led by Louisiana, Florida, and Nevada, with average monthly costs exceeding $300.
These states face high premiums due to factors like, hurricane damage, high rates of uninsured drivers, and dense traffic. Other top expensive states include Colorado, California, New York, and Washington, D.C.
Top 5 Most Expensive States for Full Coverage (2026)
Based on projected 2026 data, here are the states with the highest annual full-coverage rates:
- Louisiana: Often cited as the #1 most expensive, with rates exceeding $3,400–$4,100 annually ($277–$290+ per month).
- Florida: Extremely high rates due to hurricane risk, insurance fraud, and high litigation ($3,100–$3,800+ annually).
- Nevada: Average rates of $335/month ($4,000+ per year).
- Washington, D.C.: High-density, high-cost area ($3,200–$3,300+ annually).
- Colorado: Ranks high due to weather-related claims and increasing, urban accidents ($3,100+ annually)
Top 10 Least Expensive States for Auto Insurance
Based on 2025-2026 data, the least expensive states for auto insurance are typically characterized by lower population density, less traffic congestion, and fewer severe weather claims. Vermont, Idaho, and Maine consistently rank as the cheapest states for full coverage car insurance
Here are the top least expensive states for auto insurance:
- Idaho offers the lowest average car insurance rates in the U.S., with full coverage around $1,443 and minimum coverage at just $375 annually.
- Vermont follows closely, maintaining low premiums across both policy types. Frequently cited as the cheapest state, with annual rates around $1,237 to $1,504 for full coverage.
- Maine ranks third, benefiting from minimal traffic congestion and a low population density, which contribute to reduced insurance risk.
- Hawaii, despite its geographic isolation, enjoys consistently low rates, likely due to strict regulation and lower accident frequency.
- Indiana completes the top five, offering affordable premiums thanks to a competitive insurance market and relatively low claim costs.
| Rank | State | Full Coverage ($) | Minimum Coverage ($) | |
| 1 | Idaho | $1443 | $375 | |
| 2 | Vermont | $1491 | $329 | |
| 3 | Maine | $1631 | $418 | |
| 4 | Hawaii | $1650 | $403 | |
| 5 | Indiana | $1704 | $446 | |
| 6 | New Hampshire | $1716 | $459 | |
| 7 | Wyoming | $1760 | $265 | |
| 8 | North Dakota | $1799 | $397 | |
| 9 | Ohio | $1823 | $487 | |
| 10 | Washington | $1890 | $577 |
Top 5 Least Expensive States (Full Coverage)
The rate information is sourced from disposed private passenger auto rate filings collected by S&P that are submitted to the Department of Insurance in various states.
The analysis is limited to rate filings of each state’s 10 largest private auto underwriter based on 2025 direct premiums written plus any of the country’s 10 largest private auto underwriters outside the state’s top 10.
The effective rate change is the average of the cumulative changes by renewal business effective date for each insurer weighted against respective calendar year direct premiums written reported within the NAIC property and casualty regulatory statements.
Top 10 US Auto Insurers – Direct Premiums Written
| Rank | Company/Group | Direct Premiums Written ($ bn) | % Change in Premiums | Market Share (%) | Adjusted Loss Ratios |
| 1 | Progressive Ins Group | 70.8 | 22.2 | 16.4 | 60.7 |
| 2 | State Farm Group | 69.8 | 17.0 | 16.2 | 74.3 |
| 3 | Berkshire Hathaway Ins | 44.4 | 8.5 | 10.3 | 65.9 |
| 4 | Allstate Ins Group | 37.2 | 10.5 | 8.6 | 66.7 |
| 5 | USAA Group | 22.1 | 11.5 | 5.1 | 67.6 |
| 6 | Liberty Mutual Ins Cos | 14.5 | -9.3 | 3.4 | 60.3 |
| 7 | Farmers Ins Group | 14.1 | 2.0 | 3.3 | 58.2 |
| 8 | Travelers Group | 11.0 | 10.2 | 2.6 | 62.3 |
| 9 | Auto-Owners Ins Group | 7.3 | 1.1 | 1.7 | 62.9 |
| 10 | Amer Family Ins Group | 6.5 | 8.2 | 1.5 | 64.1 |
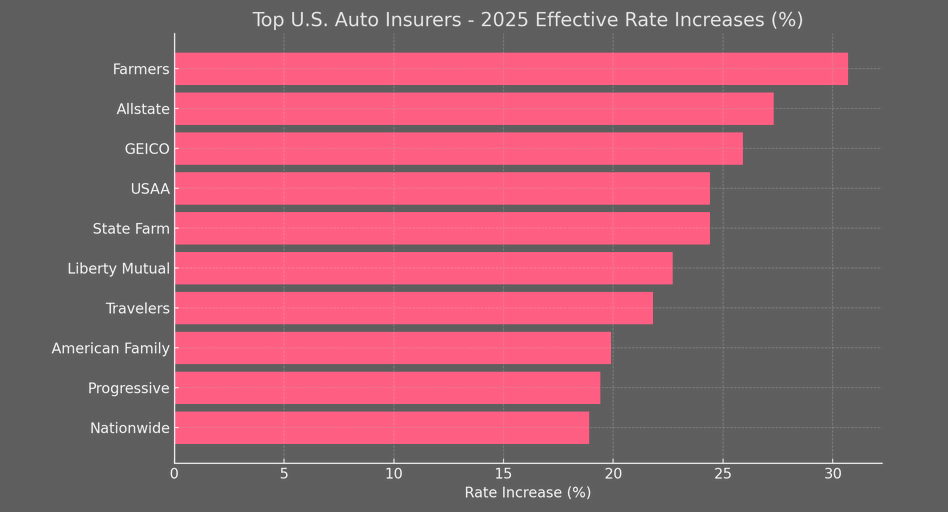
Top 10 U.S. private auto insurers’ effective rate change
| Insurer | Changes, % | 2025 Rate change | 2024 Rate change |
| 1. Farmers Insurance | 30,7 | 14,2 | 14,5 |
| 2. Allstate | 27,3 | 11,1 | 14,5 |
| 3. GEICO | 25,9 | 7,6 | 17,1 |
| 4. USAA | 24,4 | 14,9 | 8,2 |
| 5. State Farm | 24,4 | 13,9 | 9,2 |
| 6. Liberty Mutual | 22,7 | 8,8 | 12,8 |
| 7. Travelers | 21,8 | 11,9 | 8,8 |
| 8. American Family Insurance | 19,9 | 11,5 | 7,5 |
| 9. Progressive | 19,4 | 8,5 | 10 |
| 10. Nationwide | 18,9 | 8,8 | 9,3 |
Top U.S. Auto Insurers – Effective Rate Increases (%)
Average car insurance rates by state
| State | Average annual rate full coverage | Average rate minimum coverage |
| Alabama | $2,059 | $501 |
| Alaska | $2,479 | $514 |
| Arizona | $2,780 | $822 |
| Arkansas | $2,421 | $496 |
| California | $3,102 | $915 |
| Colorado | $3,230 | $570 |
| Connecticut | $2,704 | $1,057 |
| Delaware | $2,931 | $1,075 |
| Florida | $3,874 | $1,056 |
| Georgia | $2,867 | $1,009 |
| Hawaii | $1,650 | $403 |
| Idaho | $1,443 | $375 |
| Illinois | $2,488 | $688 |
| Indiana | $1,704 | $446 |
| Iowa | $1,916 | $329 |
| Kansas | $2,497 | $579 |
| Kentucky | $2,661 | $736 |
| Louisiana | $3,953 | $1,014 |
| Maine | $1,631 | $418 |
| Maryland | $2,946 | $1,057 |
| Massachusetts | $2,095 | $724 |
| Michigan | $3,236 | $903 |
| Minnesota | $2,568 | $717 |
| Mississippi | $2,320 | $525 |
| Missouri | $2,496 | $635 |
| Montana | $2,356 | $400 |
| Nebraska | $2,357 | $510 |
| Nevada | $3,626 | $1,081 |
| New Hampshire | $1,716 | $459 |
| New Jersey | $3,027 | $1,316 |
| New Mexico | $2,126 | $443 |
| New York | $4,031 | $1,729 |
| North Carolina | $1,955 | $661 |
| North Dakota | $1,799 | $397 |
| Ohio | $1,823 | $487 |
| Oklahoma | $2,796 | $557 |
| Oregon | $2,129 | $881 |
| Pennsylvania | $2,386 | $519 |
| Rhode Island | $2,960 | $916 |
| South Carolina | $1,955 | $625 |
| South Dakota | $2,287 | $370 |
| Tennessee | $1,976 | $501 |
| Texas | $2,600 | $746 |
| Utah | $2,146 | $818 |
| Vermont | $1,491 | $329 |
| Virginia | $2,143 | $762 |
| Washington | $1,890 | $577 |
| West Virginia | $2,163 | $548 |
| Wisconsin | $1,924 | $454 |
| Wyoming | $1,760 | $265 |
| District of Columbia | $2,802 | $866 |
Minimum car insurance liability coverage
| State | Minimum liability coverage limits ($ thousands) |
| Alabama | 25/50/25 |
| Alaska | 50/100/25 |
| Arizona | 25/50/15 |
| Arkansas | 25/50/25 |
| California | 15/30/5 |
| Colorado | 25/50/15 |
| Connecticut | 25/50/25 |
| Delaware | 25/50/10 |
| Florida | 10/20/10 |
| Georgia | 25/50/25 |
| Hawaii | 20/40/10 |
| Idaho | 25/50/15 |
| Illinois | 25/50/20 |
| Indiana | 25/50/25 |
| Iowa | 20/40/15 |
| Kansas | 25/50/25 |
| Kentucky | 25/50/25 |
| Louisiana | 15/30/25 |
| Maine | 50/100/25 |
| Maryland | 30/60/15 |
| Massachusetts | 20/40/5 |
| Michigan | 50/100/10 |
| Minnesota | 30/60/10 |
| Mississippi | 25/50/25 |
| Missouri | 25/50/25 |
| Montana | 25/50/20 |
| Nebraska | 25/50/25 |
| Nevada | 25/50/20 |
| New Hampshire | 25/50/25 |
| New Jersey | 25/50/25 |
| New Mexico | 25/50/10 |
| New York | 25/50/10 |
| North Carolina | 30/60/25 |
| North Dakota | 25/50/25 |
| Ohio | 25/50/25 |
| Oklahoma | 25/50/25 |
| Oregon | 25/50/20 |
| Pennsylvania | 15/30/5 |
| Rhode Island | 25/50/25 |
| South Carolina | 25/50/25 |
| South Dakota | 25/50/25 |
| Tennessee | 25/50/25 |
| Texas | 30/60/25 |
| Utah | 25/65/15 |
| Vermont | 25/50/10 |
| Virginia | 30/60/20 |
| Washington | 25/50/10 |
| Washington, D.C. | 25/50/10 |
| West Virginia | 25/50/25 |
| Wisconsin | 25/50/10 |
| Wyoming | 25/50/20 |
Average Car Insurance Rates by Age and Gender
Your gender can also influence the cost of car insurance in states where insurers can consider it. Women are statistically less likely to have serious car accidents or DUIs than men, according to the Insurance Information Institute, so they may pay less for car insurance (although this isn’t always the case).
When all age groups are considered, women pay an average of $2,318 annually ($193 per month), according to Experian data. In comparison, men pay an average of $2,331 annually or $194 per month.
As you get older, your car insurance rates typically go down—sometimes considerably, as the chart below shows. Car insurance premiums generally decline steadily until you reach your mid-70s, when they tend to tick upwards again.
Average Car Insurance Cost by Age and Gender in the U.S.
| Under 20 | $3,246 | $3,450 |
|---|---|---|
| 20-29 | $2,684 | $2,762 |
| 30-39 | $2,395 | $2,271 |
| 40-49 | $2,293 | $2,161 |
| 50-59 | $2,022 | $1,968 |
| 60-69 | $1,746 | $1,721 |
| 70-79 | $1,720 | $1,862 |
| 80 or above | $1,810 | $2,007 |
Note: Costs above are a blended average of full and minimum coverage policies
How Your Driving Record Impacts Your Insurance Costs
Practicing safe driving habits can reduce your risk of accidents or traffic citations. This can pay off in lower insurance premiums: Drivers with a “clean” driving record that shows no incidents or violations pay an average of $2,177 annually or $181 per month for car insurance. One moving violation brings those premiums to an average of $2,512 per year.
Average Car Insurance Cost by Driving Record in the U.S.
| Driving Record | Annual Cost |
|---|---|
| Clean | $2,177 |
| 1 Incident | $2,512 |
| 1 Violation | $2,652 |
| 2 Incidents | $2,778 |
| 2 Violations | $2,639 |
| 3+ Incidents | $3,170 |
| 3+ Violations | $3,026 |
Note: Costs above are a blended average of full and minimum coverage policies
If your driving record includes moving violations or accidents (even fender-benders where you weren’t at fault), insurance companies may view you as a higher-risk driver and raise your car insurance premiums to compensate.
How to Save on Car Insurance?
Whether your current car insurance premiums are above average, below average or somewhere in between, there are several steps you can take to save on car insurance.
- One of the most direct levers is your deductible. That’s the amount you cover before insurance kicks in. Raising it lowers your monthly premium, but make sure you’d actually be able to pay it if you had to file a claim.
- Older cars with little market value are another place to rethink coverage. If your vehicle is paid off and worth only a few thousand dollars, paying for collision or comprehensive may not be worth it. You could simply cover repairs or replacement out of pocket. Extras like rental reimbursement and roadside assistance are convenient but not essential, and removing them trims cost.
- Discounts are often overlooked. Bundling home and auto, completing a defensive driving course, driving fewer miles, or even belonging to certain professional groups can all trigger savings. Employers sometimes partner with insurers too, so it’s worth asking.
- Credit matters as well. In most states, insurers use a credit-based score to help set rates. Weak credit can mean paying more. Strengthening your credit history can have a direct impact on insurance costs, lowering premiums over time.
- Never assume loyalty equals value. Shopping around remains one of the most effective ways to cut premiums. Comparing quotes online or by speaking with agents can uncover better rates for the same level of coverage.
- Saving on car insurance doesn’t mean stripping protection. It means adjusting what you pay for, taking advantage of available discounts, and making sure your financial profile works in your favor.
Methodology
Beinsure utilizes S&P, Experian and Quadrant Information Services’ data to analyze 2026 rates for all ZIP codes and carriers in all 50 states and Washington, D.C. Rates are weighted based on the population density in each geographic region.
Quoted rates for our base profile are based on the following characteristics and full coverage limits with bundling and paperless billing discounts applied.
Car insurance policies that major insurance companies underwrite tend to be less expensive. Because large insurers write millions of policies each year, they can afford to price their policies more competitively.
Additionally, the biggest insurance companies in the U.S. often have more coverage options. If you want to customize your policy with endorsements or need specialty coverage like rideshare insurance, a large provider is more likely to have those policies.
FAQ
Auto insurers are raising premium rates to offset poor underwriting results and increased loss severity, partly due to higher catastrophe-related losses and inflation affecting parts and repair costs.
The nationwide average increase for private auto insurance is 15% year-to-date in 2025, with significant variation across states. For example, Nevada has seen the highest rate increase of 27.9%.
Car insurance premiums vary due to factors like local population, crime rates, weather trends, state regulations, and the number of uninsured drivers. States with more claims or higher risks see higher premiums
Louisiana has the highest average annual premium at $2,883, while Maine has the lowest at $1,175. States like Florida and California also have high rates, while states like Vermont and Ohio are among the least expensive.
Insurance rates vary based on personalized rating factors such as location, vehicle type, driving history, and age. Even if circumstances seem similar, these factors can lead to different premiums.
If the current trend continues, the countrywide average increase will have risen by double digits in back-to-back years. States like Texas have already seen a cumulative rate increase of over 30% since 2022.
Vehicles with higher MSRPs, expensive repair costs, or fewer safety features tend to have higher insurance premiums. For example, insuring a Tesla Model 3 can cost 60% more than insuring a Subaru Outback.
……………………
Written by Nataly Kramer – Lead Insurance Editor at Beinsure Media
Fact checked by Oleg Parashchak – Editor-in-Chief at Beinsure Media