US commercial auto insurance premiums increased year over year in the first quarter of 2023, according to S&P Global Market Intelligence. The sector will see a combined ratio of 97%–98% for 2023 vs. 96% in 2022.
The sector logged 2.3%, 5.6% and 3% year-over-year growth in commercial auto liability, commercial auto physical damage and total commercial auto premiums, respectively.
The U.S. commercial lines insurance segments are being challenged by slower revenue growth, inflation-based claim uncertainty and less favorable loss reserve experience.
While commercial lines reported statutory underwriting profits in four of the last five years, net written premium (NWP) growth is likely to slow in 2023 to 6%–7% YoY, vs. 10% in 2022 and 15% in 2021.
U.S. Commercial Auto Insurance Premiums
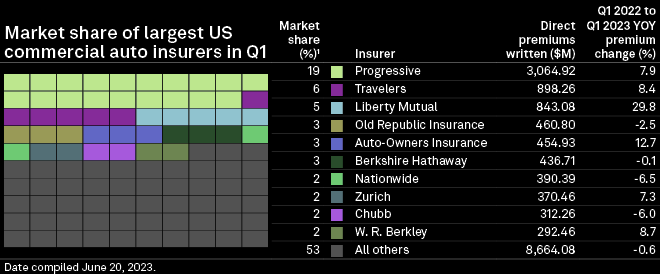
Liberty Mutual posted double-digit growth in direct premiums, written at 29.8% year over year in the first quarter.
Continued rate increases are expected to show up more meaningfully in underwriting margins
Timothy Michael Sweeney, Liberty Mutual CEO
Several Liberty Mutual subsidiaries were among the companies posting the highest rises. A spokesperson for the insurer did not respond to a request for comment regarding the factors behind the insurer direct premiums written growth.
Auto-Owners logged the second-highest increase in direct premiums written at 12.7%. Carriers benefited from resilient pricing in key commercial lines of business during the first quarter.
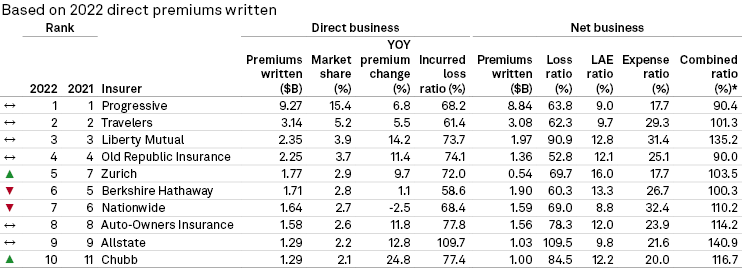
U.S. Commercial Auto Insurers Market share
TOP 10 largest insurance companies in the U.S. offer different insurance rates, customer claims experiences and features.
Car insurance policies that major insurance companies underwrite tend to be less expensive. Because large insurers write millions of policies each year, they can afford to price their policies more competitively.
Additionally, the biggest insurance companies in the U.S. often have more coverage options. If you want to customize your policy with endorsements or need specialty coverage like rideshare insurance, a large provider is more likely to have those policies.
Auto Insurers lag
Nationwide Mutual Group, Chubb, Old Republic Insurance and Berkshire Hathaway were the only US commercial auto insurers whose direct premiums written declined year over year in the first quarter.
At 6.5%, Nationwide experienced the most significant decline. The Columbus, Ohio-based insurer is aiming for disciplined growth across financial services, commercial lines and personal lines in 2023. The insurer also said that inflation drove higher claims than expected across the property and casualty industry.
Commercial Lines Direct Written Premium

Auto insurance loss ratios deteriorate
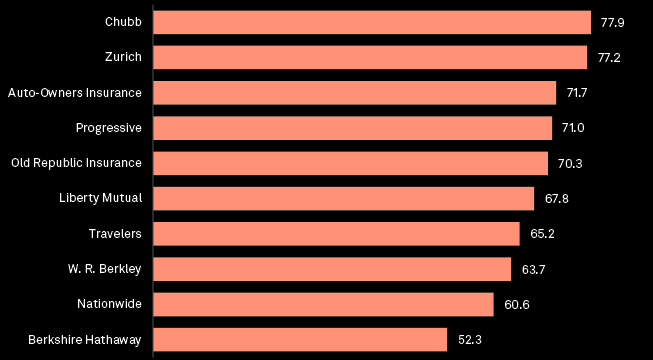
Of the top 10 commercial auto insurers, Berkshire Hathaway logged the lowest direct loss ratio during the first quarter at 52.3%.
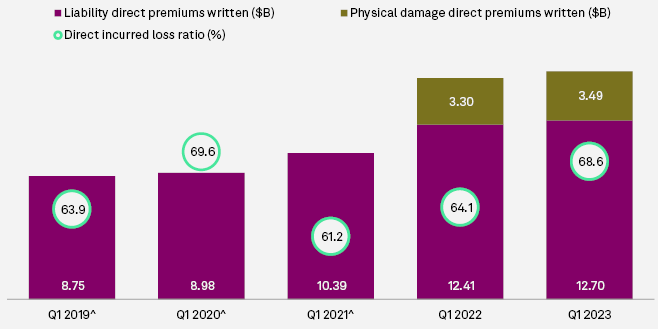
Since 2022, commercial auto business line figures have included physical damage, information that is now broken out in quarterly regulatory statements.
Previously, physical damage figures were an amalgamation of incidents across the personal and commercial auto lines, with the former accounting for the bulk of the premiums.
Total commercial auto loss ratio deteriorated to 68.6% from 64.1% in the first quarter from a year earlier.
Both Chubb and Zurich Insurance Group AG logged direct loss ratios in excess of 75% during the first quarter. Chubb’s loss ratio of 77.9% was the highest among the top 10 US commercial auto insurers, followed closely by Zurich at 77.2%.
Combined ratio on the rise
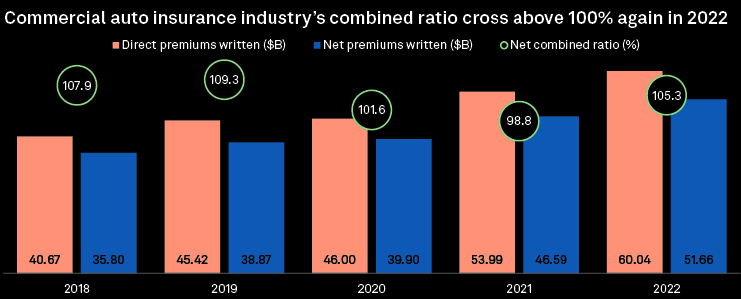
After a decline in 2021, the commercial auto insurance industry’s combined ratio exceeded 100% in 2022.
With $60 billion in direct premiums and $51.66 billion in net premiums written, 2022’s combined ratio reached 105.3%, up from 98.8% in 2021.
This is the fourth time the combined ratio has exceeded 100% in the last five years.
Personal Auto Liability Insurance
Insurance Information Institute estimate that social inflation increased commercial auto liability claims by more than $20 billion. Evidence of a similar trend is also present in two other lines of business: other liability—occurrence and medical malpractice—claims made.
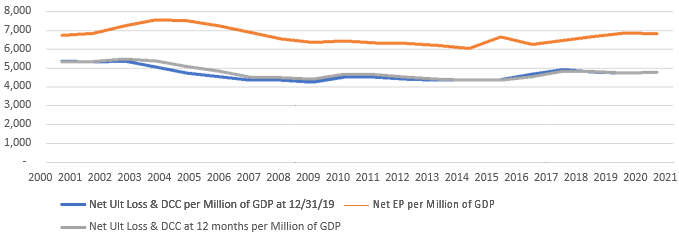

Net case incurred loss and DCC CYR 12–60 loss development factors—P&C industry
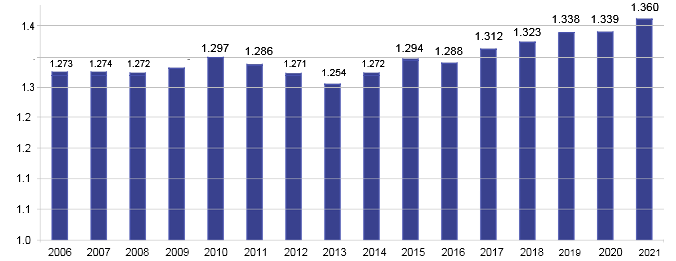
The phenomenon of social inflation has garnered a great deal of attention in the property and casualty P&C insurance industry. The term defies strict definition, though it is widely acknowledged to involve excessive growth in insurance settlements.
Why Are Auto Insurance Rates Increasing?

Auto insurers price their policies based on a number of factors. Sometimes these cost factors go up, and sometimes they go down. Your actions, as a policyholder, can affect what you pay, too (see How Much Does Auto Insurance Cost in United States?). For instance, if you add another car, or a teenaged driver to your policy, your costs will increase. Alternatively, your costs will decrease if you drop either a car or a driver from your policy.
According to Commercial Insurance and Reinsurance Market Outlook, pricing cycles in the commercial insurance and reinsurance sectors are now converging, marked by price increase moderation overall for the former, albeit with strengthening in challenged areas, and rapid acceleration (dislocation even) for the latter.
The global commercial insurance market is projected to reach $1,613.34 billion by 2030, growing at a CAGR of 9.7% from 2022 to 2030.
The convergence of geopolitical and macroeconomic shocks – war in Europe, fractured energy markets, 40-year high inflation, interest rate hikes, depleted capital – as well as the second most expensive natural disaster ever (Hurricane Ian), has introduced significant volatility into the market.
Most common reasons car insurance rates increase

One of the most common reasons car insurance rates increase is the policyholder’s driving record. If a customer has filed a claim in the past, statistics show that they’re more likely to file a claim in the future (see Auto Insurance Claims Satisfaction Study).
If a driver has a history of traffic violations, they’re demonstrating driving habits that increase their risk of being in a crash and filing a claim that costs the insurance provider money.
Insurance companies calculate premiums carefully so that they can remain competitive and solvent. They need to keep premiums down to attract customers, but they have to cover their risk of loss, so they make money and don’t go bankrupt (see Auto Insurance Performance & Underwriting Results).
When an insurance company has the risk of higher repair bills, they have to charge higher premiums to cover that risk (Global Auto Insurance Market has reached $823bn).
The added cost of home and auto repairs varies depending on the region where the policyholder lives. For example, those who live in the Northeast and Midwest have experienced higher repair costs than individuals in other parts of the U.S.
…………
AUTHORS: Hassan Javed and Tyler Hammel – S&P Global Market Intelligence analytics


