Overview
Verisk has published a report Global Modeled Catastrophe Losses on extreme event risk from a global perspective. The global risk profile is assessed by way of Verisk’s global industry exceedance probability (EP) curve, which puts into context years with high insured losses such as 2017.
The value of the insights contained in this analysis has never been greater, given the current challenges the global reinsurance industry faces in addressing recent catastrophe losses.
Over the past 5 years, actual insured losses from natural catastrophes have averaged USD 101 billion compared to an average of less than USD 70 billion over the previous 5-year period.
Climate change is often cited as the primary reason for this increase in losses, and, while climate change certainly plays a role, other factors – primarily the year-over-year growth of property exposure and ever-rising replacement values – have a far greater impact in the short term.
Evolution of Catastrophe Losses
The rise in exposure values and replacement costs is represented both by continued construction in high-hazard areas as well as high levels of inflation that are driving up repair costs and are only now starting to cool.
Other factors, including the natural inter-year variability in the occurrence of catastrophic events and the impacts of man-made loss drivers, such as social inflation and legal and insurance regulatory changes in Florida can also affect the level of global losses in a given time period – though typically to a far lesser degree.
Historical and Average Catastrophe Losses
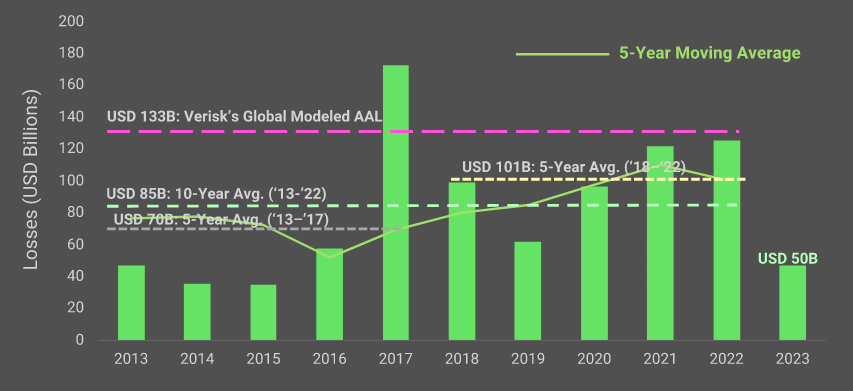
According to the analysis using Verisk’s models, the average losses of the past five years (2018 to 2022) is USD 101 Billion which is significantly more than the average losses (USD 70 Billion) of the previous five years (2013 to 2017). The trend of a 5-year average loss in excess of $100B continues again this year, and may be becoming the new normal.
Global modeled insured average annual loss from natural catastrophes is $133B, meaning the insurance industry should be prepared to experience total insured losses from natural catastrophes well in excess of $100B every year.
In this year’s iteration of the global industry EP curve, we have chosen to exclude man-made losses (i.e., losses from terrorism) to focus on the natural perils. Last year, terrorism represented approximately 4% (or $4.6B) of the global annual average loss, so when compared to last year’s figure with man-made losses excluded, the global AAL has increased by approximately $15B.
Importantly, the global AAL should be considered the baseline level of losses that can be expected, on average, every year (see Natural Catastrophes Drivers. 6 Main Lessons for Insurance Industry).
The global exceedance probability curve generated by Verisk’s suite of models provides probabilities on many different levels of loss, with significantly higher losses expected to occur with relatively high frequencies.
For example, based on Verisk’s calucations, the industry should be prepared that there is a 5% probability (i.e., 1 in 20-year chance) of experiencing a loss of more than $238B each year.
The Importance of Up-to-Date Replacement Values
Now let’s discuss each of the factors that have contributed to increases in natural catastrophe losses. The first and most significant is the rise in exposure values and replacement costs, represented both by continued construction in high-hazard areas as well as high levels of inflation that are driving up repair costs.
While reconstruction costs in the U.S. have risen by only 4.3% in the 12-month period from last July as inflation has slowed and the lumber market has stabilized, it’s important to note that even a 4.3% increase in exposure value and repair costs per year due to higher inflation would result in a more than 50% increase in losses over a 10-year period.
For this reason, it’s critically important to regularly reassess your exposures, particularly in times of increased inflation and in the urban and coastal areas that are the most vulnerable to natural hazards.
The models rely on accurate property characteristics to produce a realistic projection of potential losses, with an up-to-date replacement value playing a particularly large role in driving modeled losses.
Impact of Secondary Perils for insurance industry
While the market has in some corners adopted the terminology “secondary perils” to refer to largely non-hurricane and non-earthquake risks, the losses from severe storms and wildfires are, for many portfolios and regions, primary and significant.
All catastrophes contribute to losses, whether they are a single major event, an aggregation of smaller ones, or a combination of the two.
While some perils are responsible for far greater losses than others, these losses are all part of a spectrum, and Verisk does not categorize perils as “primary” or “secondary.”
Losses from the perils of flood, severe thunderstorm, and wildfire are well covered by Verisk models and, in many cases, models for these perils have been in place for a decade or more. Accounting for the losses from these perils should be standard practice for (re)insurers, especially as they account for a larger proportion of the overall annual losses, due to the combination of more frequent events and more valuable properties at risk.
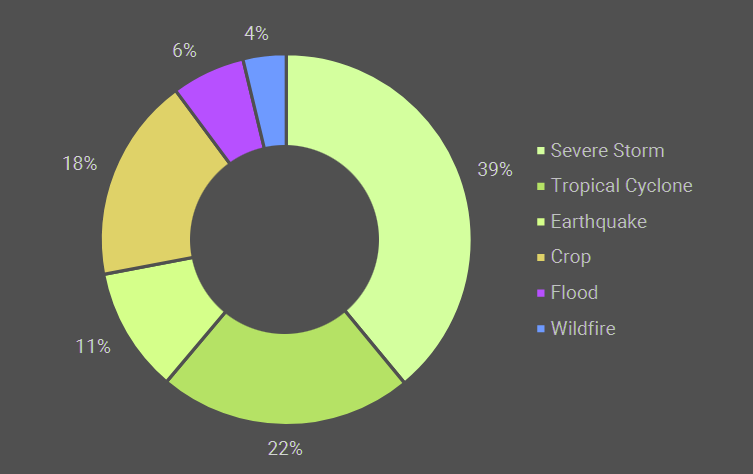
Severe thunderstorms, in particular, have been responsible for a growing proportion of the losses over the last five years and can no longer be considered an “attritional peril”.
So far, severe thunderstorms have accounted for more than 70% of insured losses, with 8 multi-billion dollar events so far, putting pressure on carriers not prepared for these levels of loss.
To further help the industry quantify future impacts of climate change, Verisk has also developed climate change projections to illustrate the impact on the U.S. and Caribbean tropical cyclone and U.S. wildfire catalogs at different SSP scenarios and different time horizons.
Global Insured Losses
The global aggregate average annual loss (AAL) and exceedance probability loss metrics for 2023 reflect changes in risk as a result of new models (Italy flood, Middle East earthquake) and updated models (U.S. Hurricane, U.S. MPCI, China Agriculture); they also comprise the updated index factors for all modeled countries.
Average annual insured losses and the metrics from the aggregate insured EP curve—for all regions and perils modeled by Verisk—have generally increased since the first white paper was published in 2012.
This is expected; the rise reflects both increases in the numbers and values of insured properties in areas of high hazard and the inclusion of regions and perils for which new models are now available.
Contribution to global Average annual insured loss by peril
Global economic losses
Global economic losses include insured losses and uninsured sources, which may include properties with no insurance, infrastructure and lost economic productivity.
Based on Verisk’s modeled global insured AAL, this would correspond to an economic AAL of more than USD 400 bn
Comparing insured losses with reported economic loss estimates for natural disasters since 1990 (as reported by Swiss Re, Munich Re, Aon, AXCO, Lloyd’s, and the Insurance Bureau of Canada), Verisk has determined that global insured losses make up less than a third of global economic losses on average, when trended to current dollars.
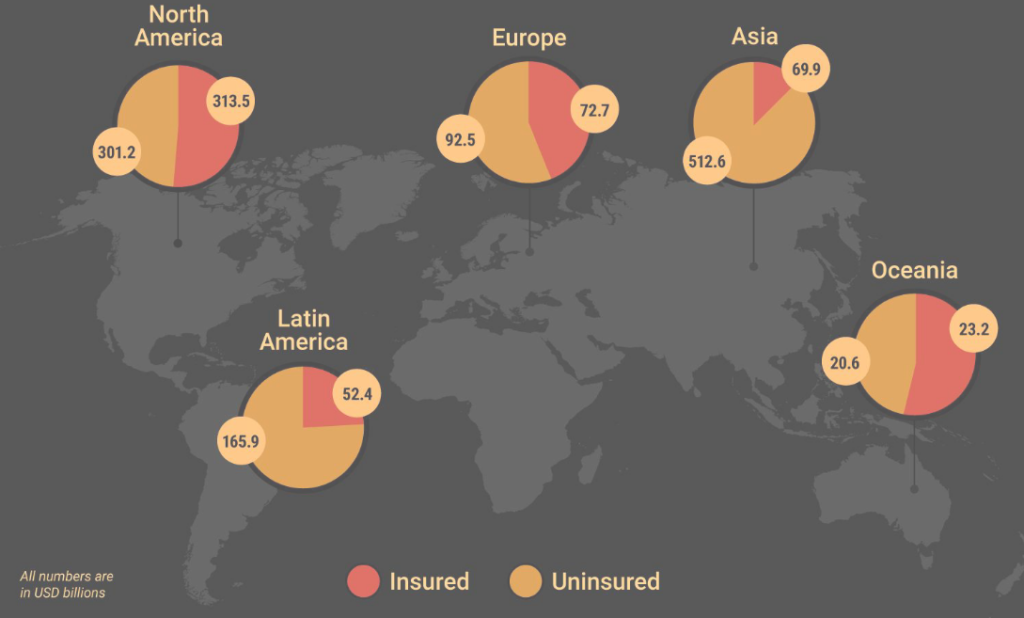
Insured and economic AAL by region
| Region | Insured AAL, $ bn | Percentage of Economic Losses, $ bn | Economic AAL, $ bn |
| Asia | 20.6 | 12% | 171.7 |
| Europe | 17.9 | 44% | 40.7 |
| Latin America | 5.7 | 24% | 23.8 |
| North America | 85.3 | 51% | 167.3 |
| Oceania | 3.5 | 53% | 6.6 |
| All exposed areas | 133 | 32% | 410 |
The sizable difference between insured and economic losses—the protection gap—represents the cost of catastrophes to society, much of which is ultimately borne by governments. Increasing insurance penetration can ease much of the burden, while providing profitable growth opportunities for the insurance industry.
In situations where insurance is not feasible or cannot be offered at an affordable price, catastrophe modeling can be used to inform emergency management, hazard mitigation, public disaster financing, risk pooling, and other government-led risk and loss mitigation initiatives to enhance global resilience.
The gap between insured and total economic losses
Industry insured losses can and do occur from perils and in regions that Verisk does not currently model. Those losses are therefore not included in Verisk’s global insured estimates.
…………………..
Edited by Oleg Parashchak by Verisk Data Report: Global Modeled Catastrophe Losses.