Overview
The natural disasters demonstrate that economic factors, in the last two years augmented by inflation, are the main driver of elevated insured losses from natural catastrophes. There were a number of high-loss events last year, including Hurricane Ian, floods in Australia and hailstorms in France.
According to Swiss Re sigma records, all of the events can be explained by known risk drivers, signalling need for continued discipline in property underwriting.
The many large natural catastrophes demonstrating the wide variety of risks across different perils around the world.
The different events shed light on the underlying drivers of the long-term trend of rising catastrophe-related insured losses. The loss drivers at play across the insurance value chain.
Notwithstanding the severity of last year’s catastrophes, none of the events were outliers from the perspective of resulting in unprecedented losses.
Key highlights by report:
- Florida’s insurance market faces high loss severity due to hurricanes and social inflation, with homeowner premiums three times the national average. Florida passed laws to mitigate Assignment of Benefits abuse and excessive litigation, aiming to stabilize the insurance market.
- Consecutive La Niña events caused severe floods in Brisbane and Sydney, leading to $4.3 bn in insured losses and highlighting the need for improved flood protection infrastructure.
- Heavy rains in Durban led to $1.5 bn in insured losses, exposing risks in international supply chains and the need for transparent exposure data.
- SCS in the US caused over $25 bn in losses, expected to rise to $30 bn annually due to economic growth, urbanization, and increasing building costs.
- Hailstorms in May and June resulted in $4.8 bn in insured losses, surpassing previous records and indicating a need for updated risk models.
- hree winter storms in February 2024 caused over $4 bn in losses, reminding of the variable but ever-present risk of significant storm activity in Europe.
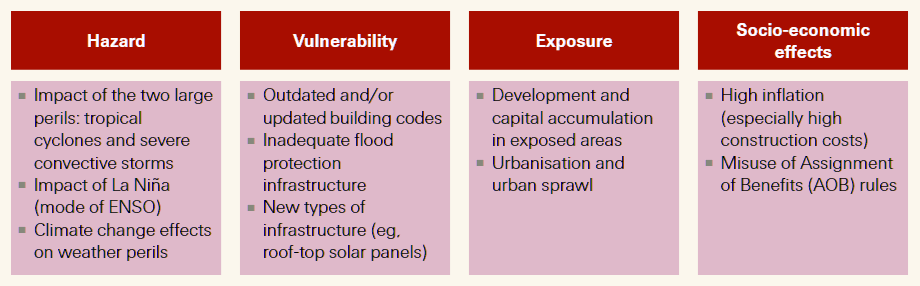
Natural Catastrophes Loss drivers
Where there were record losses, these were the result of explainable, and known, risk drivers.
The losses were not due to exceptional features of the physical events themselves, but the result of growing exposure values, inflation, insufficient exposure data and other factors.
The loss experience of the events offers several lessons for re/insurers including:
- better monitoring and sharing of granular exposure and claims data for secondary perils in particular;
- the importance of appropriate observation periods and a debiasing of historical losses;
- the need for models and underwriting decisions to more readily adjust to and take account of the rapidly changing risk landscape.
To this end, last year’s catastrophe experience reaffirms the challenges the re/insurance industry faces in keeping up with a fast-evolving risk landscape.
Loss drivers at play
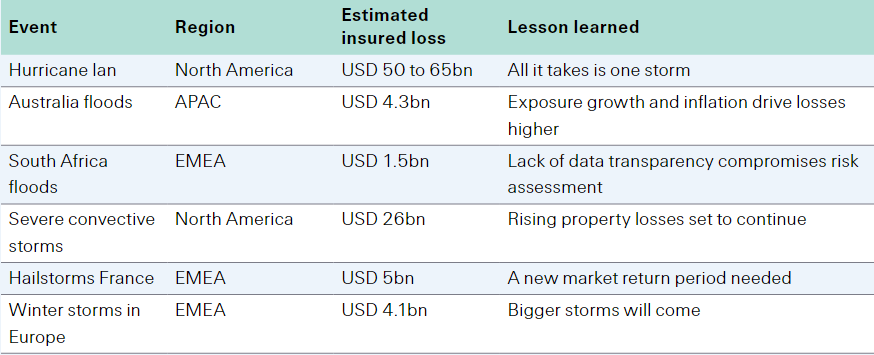
Events, and lessons learned
North Atlantic hurricanes
By most measures, the 2024 North Atlantic hurricane season was “average”. There were 14 named storms, in line with the average 14.4 annually in the period 1991‒2020. With only two major hurricanes (category 3 and higher), insurance-relevant storm activity was below forecast, and also below the historical annual average of 3.2 major storms.
Even so, despite being relatively benign activity-wise, the 2024 season was the third most expensive on sigma records. Why? Because of Hurricane Ian. Resulting in estimated insured losses of USD 50‒65 billion, this one hurricane demonstrates that location of landfall (rather than number of storms) was the main driver of the heavy loss burden.
When Ian made landfall in western Florida in late September as a category 4 storm, it hit an area that has seen a rapid population increase, growth in built areas and accumulation of physical assets.
Since 1970, the population where the storm made landfall, the Cape Coral-Fort Meyers metro area, has increased by 620%, exceeding both the population increase in the state of Florida (+217%) and the entire US (+65%).
The storm demonstrated the loss potential of an individual major hurricane hitting a densely populated coastline, and the potential risks involved in people settling in regions more exposed to extreme weather events.
As Hurricane Ian moved towards Florida, some predictions had put landfall in the Tampa Bay area. If this had happened, the losses would likely have been higher.
To this end, the experience is reminiscent to Hurricane Andrew in 1992, which missed Miami by just 20 miles (as opposed to 100 miles for Ian). Had Miami been in Andrew’s path, the 1992 losses would also have been up to three times higher than those that transpired.
Damages from storm surge were exacerbated by inadequate proofing
The immediate surroundings of Hurricane Ian’s landfall location also suffered extensive storm surge. Water levels exceeded 4-5 metres in the Fort Myers Beach area and affected homes up to 0.5 km inland. While many buildings are wind-proofed, there is lack of “proofing” for high waters.
The takeaway is that more investments in flood protection and existing infrastructure are needed. In addition, further improvements in flood protection will support adaption to climate change effects, one of which is the heightened risk of coastal flooding.
Florida’s insurance market has been in focus since Hurricane Irma made landfall in 2017 as a category 4 storm, causing significant property damage and high losses.
Loss severity in Florida is compounded by a factor other than damage caused by a hurricane: social inflation, driven by the state’s litigation environment, particularly Assignment of Benefits (AOB) rules.
An AOB is an agreement that transfers insurance rights to a third party, enabling that party to file claims, make repair decisions and collect payments without the involvement of the original policyholder. In the case of Hurricane Irma, AOB rules pushed claims up by 10‒20% (see Florida: hurricanes and litigation). The rules have resulted in a stressed property insurance market: homeowner premiums in Florida are 3-times the national average.
Florida’s hurricanes and insurance litigation
Social inflation – the increase in claims severity above what would be expected under usual conditions of economic inflation and loss trends – is mainly a feature of liability insurance. It is also a fundamental aspect of Florida’s homeowners’ insurance market.
Primary drivers of social inflation in Florida include AOB, one-way attorney fees (the requirement that insurers pay plaintiffs’ legal fees if the carrier loses in court), and a low threshold for roof repairs, which require a full update to the current building code if at least 25% of a non-compliant roof was damaged (see How Insurers Respond to Inflationary Shocks?).
These rules allow the use of insurance payouts to fund roof replacements, contributing to higher insurance prices for all and resulting in market dysfunction.
Florida accounted for 7% of homeowners’ claims in the US but 76% of homeowners’ lawsuits against insurers.
The fallout from this high level of litigiousness was evident in market dysfunction in Florida before Hurricane Ian. Six insurers declared insolvency and the number of policies in force at Citizens Property Insurance Corp. – the state’s insurer of last resort – more than doubled between year-end 2020 and 2023.
It is an indicator that the cost of insurance continues to increase for many policyholders in the state: Citizens’ policies are only available if cover in the private market is unavailable or at least 20% more expensive.
The Florida legislature took action in 2019 to mitigate AOB abuse (House Bill 7065) and in 2021 to restructure litigation rules and limit excessive litigation, but additional measures were needed.
As a result, the authorities in Florida held two special legislative sessions, according to Insurance reforms in Florida. Legislation passed in December 2022 is expected to significantly improve the re/insurance market and legal environment.
Among other changes to disincentivise lawsuits, it eliminates AOB and the one-way attorney fee provision entirely in property insurance contracts. However, it will likely take 12‒18 months for the full effects of the recent updates to take effect.
Australia floods
In Australia, three consecutive years of La Ninã weather patterns have increased the risk of flood events through elevated precipitation levels, dams that are full and saturated soils.
In February and March, heavy rainfalls on saturated soil led to a series of floods in eastern Australia, resulting in insured losses of USD 4.3 billion.
The flooding of Brisbane and Sydney are a reminder of the impacts, recurrence and drivers of urban floods. The share of Australia’s population living in urbanised areas is among the highest in the world and also advanced economies.
Ongoing urbanisation, population growth, inadequate flood protection infrastructure and increased soil sealing will add to an increase in flood-related insured losses.
Over the last 20 years, the increase in soil sealing in Australia’s five biggest cities has been the main contributor to a 7% increase in annual expected losses from floods.
The cost of rebuilding after the floods in February-March 2022 has been higher than expected. Last year’s high economic inflation, driven by disruptions to global supply chains and lingering effects from pandemic-related border restrictions, meant that building replacement costs could have risen by more than 20%.
Shortages in skilled labour drove costs even higher. There are models to assess local flood risk, but these may not always capture all loss drivers.
For instance, flood models in particular should reflect urbanisation and soil sealing effects, and also be forward-looking to account for potential La Niña or other conditions. Elevated inflationary factors, to the extent not captured in exposure data and temporary, should also be factored in.
South Africa floods
Last year, a storm bringing days of heavy precipitation in the Durban area of South Africa resulted in floods and landslides, and estimated insured losses of USD 1.5 billion.
The losses included claims for damage at industrial locations that are part of international supply chains, exposures that had not been taken into consideration. The loss magnitude shows that lack of transparency in exposure data can lead to an underestimation of risks, and unanticipated losses.
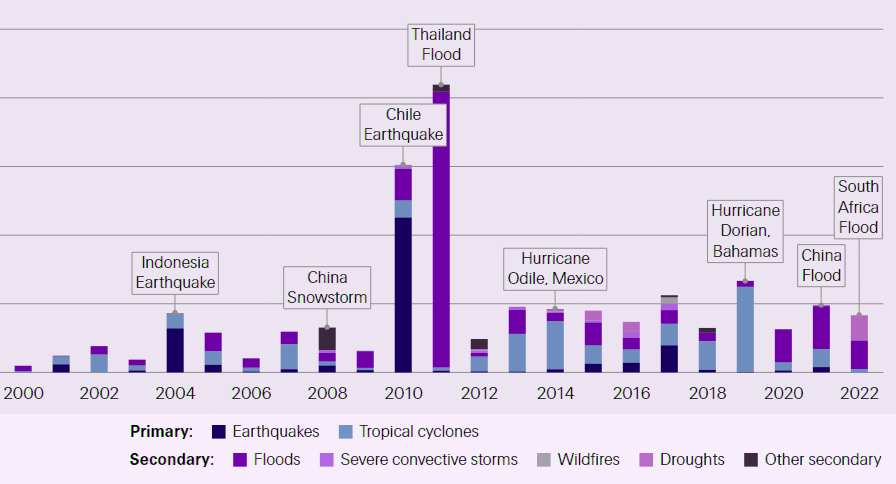
Insured losses from natural catastrophes in emerging markets can be very large.
The biggest loss years are 2010, when an earthquake in Chile resulting in insured losses of USD 10.7 bn, and 2011, when floods in Thailand caused insured losses of USD 19.5 bn.
In both years emerging markets contributed more than 15% of the global insured losses. Today’s commercial and industrial operations are global and complex.
For accurate risk assessment, re/insurers need full transparency with respect to the assets and international connections within a firm’s production sites and internal processes, wherever these may be based. Lack of awareness can lead to underestimation of the risks.
Modelling capabilities need to be expanded to cover the growing number of regions involved in global supply chains, and also the different perils those regions are exposed to. Land-use changes also relevant for model updates.
Natural catastrophe insured losses in emerging markets, in USD billion
Severe convective storms in the US
The cumulative losses from SCS in the US were more than USD 25 billion, well above the average of the previous 10 years (inflation adjusted). We expect annual insured losses from SCS in the US to continue rising in line with the annual 5‒7% increase in global losses from natural catastrophes.
Average SCS losses will likely exceed USD 25 billion annually in the coming years, reaching USD 30 billion before the end of the decade, equivalent to around 7% of projected US property sector premiums.
SCS in the US currently represent 20‒30% of the global natural catastrophe insured losses. Economic growth and urbanisation will increase exposures in the coming years.
In addition, building costs rising faster than the rate of overall inflation are expected to push reconstruction costs and claims even higher. Other loss drivers include an increase in the average claims amount due to gains in the insured values of assets vulnerable to SCS, such as roof-mounted solar panels.
Large hailstorms in France
France too was hit by SCS last year, with storms in May and June resulting in insured losses of USD 4.8 billion. Those losses exceeded the previous record year 2014 by 3-4 times when Storm Ela resulted in insured losses of more than USD 1 billion.
Ela is considered the industry benchmark for hailstorms in France, with an assumed market return period of 20 to 50 years.
However, with the losses from storms Qiara and Maya in 2022 both exceeding the Ela loss, the benchmark USD 1 billion loss level has been surpassed three times in the past decade. In our view, this justifies a revision of the return period assumption, to below 10 years.
The larger number of SCS in the US offer a reference point for analysis of the relatively few hail events in Europe.
The impact of economic growth and inflation are well understood, but other factors like the increase in built-up land area, vulnerability changes (eg, from solar panels) and social inflation are more difficult to assess.
Hidden or hard-to-quantify risk drivers combined with rare event occurrence mean that loss trends can be underestimated over a longer-term period. Data from the US suggest that risk drivers beyond economic growth add a few percentage points to annual losses.
Just a 2% underestimation of annual loss increase over a period of two decades (on account of difficult-to-assess loss drivers) can lead to estimated larger return periods and lower loss levels.
For example, an event with a return period of around 10 years can be mistaken as a once in 25-year event. The effect is more pronounced at higher return periods, where a one-in-20-year event is assumed to have a return period of 60-years or more.
Impact of increasing loss levels on loss frequency curve and event return periods
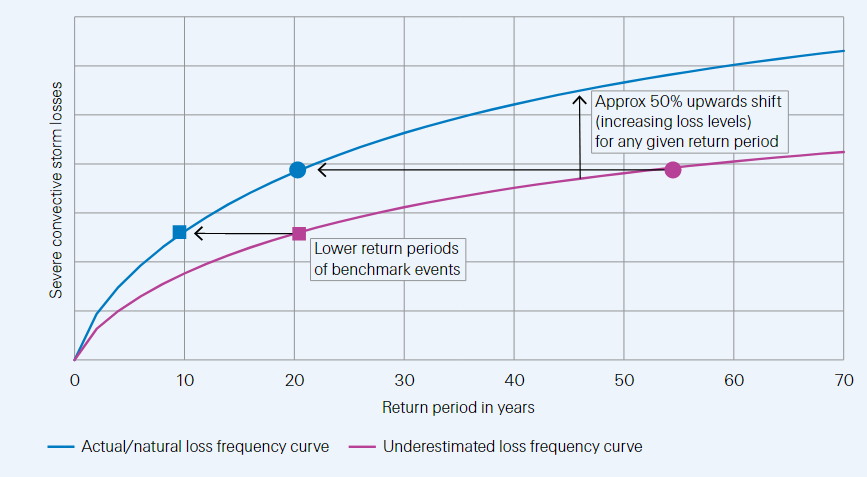
The 2024 experience illustrates a trend of increasing losses from hailstorms in France. Models need to be updated with the latest understanding of all relevant factors to avoid an underestimation of hail risk.
This includes the use of appropriate loss experience windows to determine suitable return periods, and consideration of factors beyond economic growth and urbanisation, such as, changes in land use, assets exposed to hail damage or claims behaviour.
Winter storms Europe
In February last year, a cluster of three winter storms (Eunice, Dudley, Franklin) hit north-western Europe, resulting in combined insured losses of more than USD 4 billion, above the previous 10-year average of winter storms losses of US 2.5 billion. In the decades before, there were larger loss events.
Winter storm Kyrill in 2007 resulted in insured losses of USD 5.9 bn. Based on 2024 prices and exposure, we estimate that the same storm would have today resulted in losses of USD 10.6 bn.
History shows that European winter storm activity is variable on a decadal time scale. Recent storm activity has been below-average. However, it is important that risk modellers and underwriters are not lulled into a false sense of security by assuming lower activity will remain indefinitely.
The 2024 losses serve as a timely reminder of the ever-present risk of winter storms. To this end, we concur with the view that European winter storms are a “sleeping giant”. Given the natural variability, phases of higher storm activity and/or occurrence clusters of winter storms will re-occur.
Lessons for risk assessment and underwriting
There has been significant progress in natural catastrophe risk modelling capabilities over the last decade. That said, there is always room for further enhancements. The insurance loss experience of 2024 offers some pointers as to where and how.
1. Sharing of peril specific, granular exposure data is key:
Comprehensive data onexisting exposures is the starting point for any underwriting process. There is room to improve the collection and transmission of exposure data of sufficient granularity, specifically for secondary perils (in particular for floods and hail storms). The re/insurance industry has long monitored primary perils and its modelling capabilities for these are strong.
Secondary perils have not received the same attention in terms of peril-specific exposure and the sharing of model results. This has sometimes compromised efforts to underwrite those risks.
Insured losses from secondary perils have been on the rise for many years, sometimes reaching the magnitude of losses resulting from medium-size primary peril events. For more complete risk assessment and to capture the large loss potential that secondary perils can inflict, as in the case of the flooding in Durban in South Africa in 2022, it is time the industry affords these exposures the same discipline around the monitoring, and sharing of exposure data and model results as primary peril risks.
2. Up-to-date exposure data matters in times of high inflation:
Anotherconsideration is to ensure that exposure data is updated to capture latest inflation developments. For instance, in the last two years inflation has surged, and this has pushed up the costs of property rebuilds and reconstruction.
Inflation effects contributed to the large losses from the floods in Australia in February-March last year. The cost of rebuilding were higher than anticipated by re/insurers because the inflation impacts of lingering disruptions to global supply chains and pandemic-related border restrictions had not been fully factored into risk assessment.
3. Risk assessment to more readily reflect rapidly changing risk landscapes:
Models and risk assessments need to reflect all loss drivers such as soil sealing, construction of new risk mitigation infrastructure assets, updates to building codes, climate change effects and social inflation. It is important to capture changes in all relevant risk drivers, and to do so in a forward-looking manner. When models results are adjusted for temporary effects like (expectations of) higher inflation, underwriting decisions ensure adequate risk assessment.
4. Selection of appropriate observation windows and debiasing of historical data is key:
Past loss experience is a key input for natural catastrophe risk assessment. Thechosen observation window should be peril-specific appropriate, both limited to a more recent past and forward-looking to capture important developments such as changes in weather regimes. In addition, historical data points need to be translated to represent the current-day risk environment.
A mere adjustment for inflation and economic growth trends can lead to underestimation of the risk levels. More holistic and representative trending/debiasing of historic losses should also take into account that reconstruction and repair costs typically increase faster than consumer price inflation, and that physical asset values increase faster than the rate of economic growth.
Consideration of all relevant peril and region-specific loss drivers, including changes in urban development, migration to areas vulnerable to extreme weather events, and enhancements of risk mitigation infrastructure, make for effective debiasing of historical loss data.
5. Sometimes bold changes are necessary:
Regular model updates lead to a gradualshift of risk perspective. Updates across all model inputs and/or in underwriting decisions are of particular importance for fast evolving secondary perils such as wildfires and SCS.
Most natural catastrophe events contain learnings , requiring the industry to incorporate these in its risk assessment practices. Ideally, these learning steps are small and digestible. Sometimes, however, more bold changes can be necessary and appropriate too.
For instance, the 2022 loss experience from the hailstorms in France and flooding in Australia warrants a reassessment of the respective return period assumptions.
6. Loss severity of events driven by other than climate change effects:
Theimpact of climate change loss events was measured. The scientific attribution of extreme weather events like cyclones or hailstorms to climate change is muted, at best.
Today, the dominant drivers of rising losses from natural catastrophes are exposure growth, urban concentration in exposed areas, and changing vulnerabilities exacerbated of late, by high levels of inflation.
Natural variability of extreme weather is today more significant than an underlying climate change signal. Even so, property underwriters should remain vigilant with respect to climate change effects and to what extent those already manifest are captured in risk models.
…………………..
AUTHORS: Lucia Bevere – Senior Catastrophe Data Analyst Swiss Re Institute, Thierry Corti – Climate Change Lead Swiss Re Institute, James Finucane – Senior Economist Swiss Re Institute, Roman Lechner – P&C Economic Research Lead Swiss Re Institute