Follow Beinsure
- Wall Street forecasts further S&P 500 gains into 2027
- Why Warren Buffett favored low-cost S&P 500 investing
- VOO’s biggest risk is its concentration in technology stocks
- VOO versus VYM: dividend yield does not determine total returns
- DGRO offers dividend growth with lower technology concentration
- VT provides global diversification beyond the S&P 500
- VOO forecast to 2036: three long-term return scenarios
- What will determine VOO’s returns over the next decade
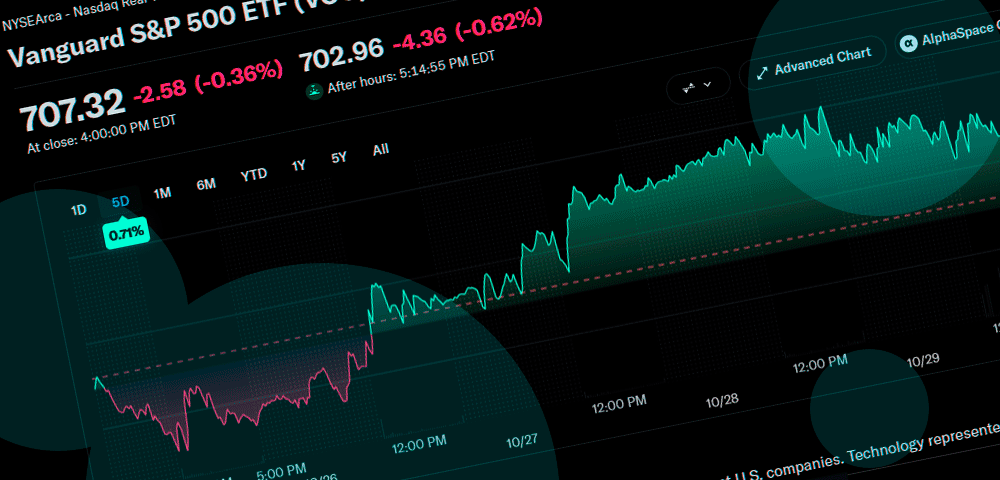
The Vanguard S&P 500 ETF (NYSE Arca: VOO) closed at $707.32 on October 29, 2026, down 0.36% for the session. The fund remains close to its recent highs, supported by resilient US corporate earnings and sustained investment in artificial intelligence.
The ETF tracks the S&P 500, providing exposure to approximately 500 leading US companies through a market-capitalization-weighted portfolio. Its expense ratio is just 0.03%, making it one of the cheapest ways to invest in the index.
- Goldman Sachs, Morgan Stanley and UBS expect further S&P 500 gains into 2027, supported by corporate earnings growth.
- VOO’s low expenses and strong historical returns contrast with unusually high exposure to a small group of technology companies.
- Dividend and global equity ETFs offer alternatives to VOO’s concentration, although their performance and income characteristics differ substantially.
However, VOO’s composition has changed substantially as technology stocks have increased their market value. Its largest holdings now account for an unusually high share of the portfolio, leaving future returns more dependent on the earnings and valuations of a relatively small number of companies.
That concentration is central to the fund’s outlook for 2027 and the following decade.
Wall Street forecasts further S&P 500 gains into 2027
Investment banks generally publish forecasts for the S&P 500 rather than individual price targets for ETFs tracking the index. Those projections provide a useful reference for VOO, although differences in fund expenses, distributions and tracking performance prevent them from being treated as direct ETF targets.
- Goldman Sachs expects the S&P 500 to reach 8,700 over the 12 months following its September 2026 forecast. Its strategists anticipate continued earnings growth without substantial expansion in valuation multiples.
- Morgan Stanley has a target of 8,300 for mid-2027, supported by expectations that corporate profits will continue increasing as business investment and economic activity remain resilient.
- UBS expects the index to reach 8,400 by June 2027. Its outlook assumes that earnings growth can offset some of the pressure from elevated interest rates.
With the S&P 500 closing at 7,720.39 on October 29, these forecasts imply further index appreciation of approximately 8% to 13%, depending on the institution and investment horizon. Vanguard Industrials ETF (VIS) forecast: Wall Street sees upside, but valuations remain high.
Applied mechanically to VOO’s closing price, and assuming the ETF maintains its current relationship with the index, the forecasts correspond to approximately $760 under Morgan Stanley’s projection, $770 under UBS’s estimate and $797 under Goldman Sachs’ outlook.
These are calculated index-equivalent values, not price targets issued by the banks for VOO. They also exclude future dividend distributions.
The main difference between the forecasts concerns the strength and durability of earnings growth.
Goldman Sachs projects S&P 500 earnings per share of $415 in 2027, compared with UBS’s estimate of $400. Both expect corporate profits to expand, but their assumptions differ on the magnitude of that improvement.
Goldman Sachs estimates that AI-related investment has contributed nearly half of the index’s earnings growth in 2026. Its research expects that contribution to diminish over time, making productivity improvements increasingly important.
UBS is also monitoring interest rates. Its October outlook anticipates additional Federal Reserve tightening, which could constrain equity valuations even if company earnings remain strong.
For VOO, these forecasts suggest that further appreciation will depend increasingly on profit growth rather than investors paying higher multiples for existing earnings.
Why Warren Buffett favored low-cost S&P 500 investing
Warren Buffett’s 2013 Berkshire Hathaway shareholder letter remains one of the clearest endorsements of low-cost index investing. He recommended that the trustee overseeing his wife’s inheritance allocate 90% to a low-cost S&P 500 index fund and the remaining 10% to short-term US government bonds.
Buffett specifically suggested Vanguard as a provider, although his recommendation concerned the investment strategy rather than VOO alone.
The reasoning was straightforward: broad ownership of major American companies, minimal expenses and a long investment horizon can offer advantages over high-cost active management.
VOO applies that approach through an index that adjusts its holdings as the composition of the US equity market changes.
Companies that dominated the market decades ago, including AT&T and General Motors, have been displaced by businesses such as Nvidia, Apple and Microsoft.
The index’s market-capitalization methodology allows successful companies to become larger portfolio holdings without requiring investors to identify future winners individually.
VOO also became the first ETF to surpass $1 tn in assets in June 2026, reflecting sustained demand for inexpensive exposure to US equities.
Its scale and low fees support efficient index tracking, but they do not eliminate market risk or guarantee positive investment returns.
VOO’s biggest risk is its concentration in technology stocks
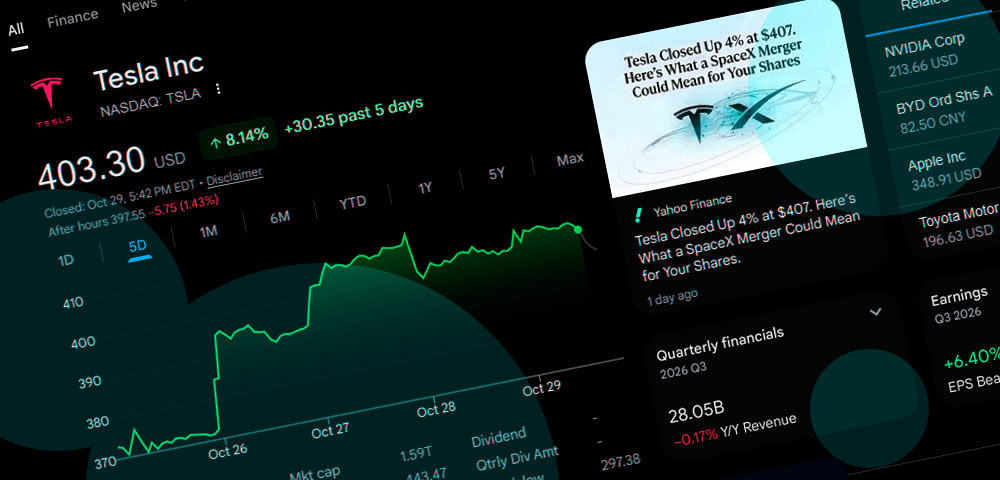
The 10 largest positions in VOO represented 39.1% of its portfolio at the end of September 2026. Nvidia was the largest holding at 8.39%, followed by Apple at 7.38% and Microsoft at 5.78%. Other major positions included Amazon, Alphabet, Broadcom, Meta Platforms, Micron Technology and Tesla.
The fund’s information technology allocation was already approximately 38% in mid-2026. Exposure to companies closely associated with AI and digital services is even higher when relevant businesses in communication services and consumer discretionary are included.
This creates a significant difference between the number of stocks VOO holds and the diversification it actually provides.
Although the ETF owns hundreds of securities, movements in the largest technology companies can exert disproportionate influence on its performance. That exposure has been beneficial during periods of strong growth in cloud computing, semiconductors and AI infrastructure. It also increases sensitivity to changes in capital spending, earnings expectations and valuation multiples.
If major technology companies continue delivering earnings growth above the broader market, their large index weights could support further gains.
However, disappointing results from a handful of dominant businesses could depress VOO even when most other S&P 500 constituents perform reasonably well.
Concentration has reached levels comparable with those seen in the mid-1960s. Subsequent decades included periods of weaker US equity returns, although the historical relationship does not establish that concentration itself caused the underperformance.
The current risk is more specific: investors have become increasingly dependent on sustained profit growth from companies already carrying substantial valuations.
VOO versus VYM: dividend yield does not determine total returns
The Vanguard High Dividend Yield ETF (VYM) offers a different approach to US equity investing. It tracks the FTSE High Dividend Yield Index, emphasizing established companies with relatively high dividend yields while excluding real estate investment trusts.
VYM held 593 stocks at the end of September, with financial companies accounting for approximately one-fifth of the portfolio. Its technology allocation was significantly lower than VOO’s, reducing exposure to the largest growth-oriented businesses.
VYM offered a dividend yield of approximately 2.4%, compared with around 1.1% for VOO. Its expense ratio was 0.04%.
Despite the higher income, VYM has generated lower total returns over important historical periods. For the five years ended September 2026, VOO returned 13.8% annually, compared with 11.6% for VYM.
Over 10 years, the respective annualized returns were 15.3% and 11.3%, including reinvested distributions.
VOO benefited from the strong performance and earnings growth of large technology companies, while VYM’s emphasis on dividend-paying businesses produced a more value-oriented portfolio.
Recent comparative data showed substantially faster earnings growth among VOO’s holdings, approximately 24.5% versus 8.9% for VYM.
The valuation difference is also meaningful. VOO’s portfolio traded at approximately 24.7 times earnings in the supplied comparison, against 19.5 times for VYM.
A prolonged slowdown in technology profits could narrow that valuation advantage, while stronger performance from financial, industrial and other dividend-oriented businesses could improve VYM’s relative returns.
For income-focused investors, VYM provides higher current distributions. For investors prioritizing capital appreciation, VOO has historically offered stronger growth.
Neither outcome establishes which fund will outperform over the next decade.
DGRO offers dividend growth with lower technology concentration
The iShares Core Dividend Growth ETF (DGRO) provides another alternative. Rather than selecting stocks primarily for high yields, DGRO focuses on companies with established records of increasing dividends. Its index methodology requires at least five years of dividend growth, positive earnings growth forecasts and a payout ratio below 75%. It also excludes the highest-yielding 10% of otherwise eligible stocks.
In September 2026, information technology represented approximately 16% of DGRO, while financials and healthcare accounted for larger individual weights.
Historical research from Ned Davis Research and Hartford Funds provides some support for dividend-growth strategies.
From 1973 through 2025, companies that initiated or increased dividends delivered an average annualized total return of approximately 10.2%, compared with 4.2% for non-dividend payers and 7.7% for an equal-weighted S&P 500 index. These figures describe historical groups of companies rather than a forecast for DGRO. They also do not guarantee that dividend growers will outperform a capitalization-weighted index dominated by profitable technology businesses.
The investment distinction is that DGRO emphasizes dividend sustainability and earnings quality, while VOO follows market capitalization regardless of dividend policy.
VT provides global diversification beyond the S&P 500
The Vanguard Total World Stock ETF (VT) addresses a different limitation of VOO: its exclusive focus on US-listed large-cap companies.
VT tracks the FTSE Global All Cap Index and held more than 10,000 securities at the end of September 2026. Its portfolio includes developed and emerging markets, with approximately 37% invested outside the United States.
The fund’s expense ratio is 0.06%.
VT still holds substantial positions in American technology companies, but it also provides exposure to international businesses such as Taiwan Semiconductor Manufacturing, Samsung Electronics, SK Hynix and ASML. These companies play important roles in semiconductor manufacturing, memory and advanced chipmaking equipment.
Following SpaceX’s June 2026 initial public offering, Vanguard’s global and broader US market funds began building relatively small positions in the stock.
VOO cannot add SpaceX until the company meets the S&P 500’s eligibility requirements.
In June, S&P Dow Jones Indices decided against relaxing its existing rules for newly public megacap companies. The methodology generally requires at least 12 months of eligible public trading before a company can be considered for S&P 500 inclusion.
Consequently, June 2027 is the earliest potential entry date for SpaceX, subject to the remaining eligibility criteria and the index committee’s decision.
This illustrates a structural difference between the funds. VOO follows established S&P 500 inclusion rules, while VT can gain exposure to companies through a broader global index.
International diversification may reduce dependence on US market valuations, although currency movements, geopolitical risks and foreign market performance introduce additional sources of volatility.
VOO forecast to 2036: three long-term return scenarios
VOO’s historical performance provides context for long-term projections, but the exceptionally strong returns of the past decade should not automatically be extended into the future.
The S&P 500 has historically delivered roughly 9% to 10% annualized total returns over very long periods. Recent performance has been stronger, supported by technology companies that have increased earnings faster than the broader market.
Current concentration and valuations create a reasonable basis for considering more moderate outcomes.
The following scenarios illustrate how a $10,000 investment in VOO could develop over 10 years, assuming dividends are reinvested and annual returns are compounded. They are illustrative calculations, not forecasts issued by investment banks.
| Scenario | Assumed annual total return | Investment value in 2036 |
|---|---|---|
| Bear case | 3% | $13,439 |
| Base case | 7% | $19,672 |
| Bull case | 11% | $28,394 |
The bear case assumes slower corporate earnings growth, pressure on valuation multiples and weaker performance from the largest technology holdings.
A prolonged period of high interest rates could reinforce that outcome by making future earnings less valuable relative to current profits.
The base case assumes that US companies continue growing earnings while the pace of multiple expansion remains limited. Technology remains an important contributor, but returns broaden across other industries.
The bull case requires sustained productivity improvements, stronger earnings growth and valuations that remain supportive despite the index’s concentration.
These outcomes include reinvested dividends and are not direct forecasts of VOO’s future share price. Actual results could fall outside the illustrated range, including a negative return over the decade.
What will determine VOO’s returns over the next decade
Three developments are likely to have the greatest influence on VOO’s long-term performance.
- The first is whether AI investment continues producing earnings growth at a rate sufficient to justify the valuations of the index’s largest holdings.
- The second is the trajectory of interest rates and inflation. Higher bond yields can reduce the multiples investors are willing to pay for equities, particularly companies whose valuations depend heavily on future growth.
- The third is market breadth. Stronger earnings across industrials, healthcare, financials and other sectors could reduce dependence on a small group of technology stocks.
VOO remains an efficient vehicle for investing in large US companies, but its low fees should not be confused with low investment risk.
At current valuations, the difference between a strong and disappointing decade will depend substantially on whether corporate profits continue expanding faster than the market’s already elevated expectations.