Overview
Worldwide, natural disasters caused overall losses of around $131 bn in the first half of 2025 (previous year, adjusted for inflation: $155 bn), of which $80bn was insured (in 2024: $64 bn).
Both overall losses and insured losses were significantly higher than the average for the previous ten years and the previous 30 years (adjusted for inflation: overall losses of $101/79 bn, insured losses of $41/26 bn).
Insured losses in H1 2025 were the second-highest in the first half of any year since our records began in 1980.
Only in the first half of 2011 were insured losses even higher, attributable to a severe earthquake and destructive tsunami in Japan, according to Munich Re. Beinsure analyzed the report and highlighted the key points.
Severe Natural Catastrophes
- High overall losses of around $131 bn slightly lower than last year – but well above long-term average
- Fires on the outskirts of Los Angeles in January cause highest wildfire losses of all time
- Very high claims expenditure for insurers: Almost $80 bn, mainly driven by wildfires in the United States
- Insured losses were the second-highest in the first half of any year since 1980
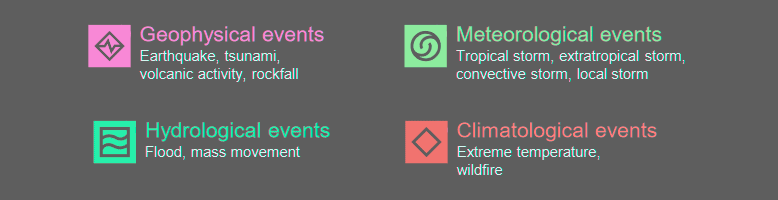
Weather disasters caused 88% of overall losses and 98% of insured losses, while earthquakes accounted for 12% and 2% respectively.
Climate Change is a Fact and is Changing Life on Earth
Disasters like the one in Los Angeles have become more likely due to global warming and they teach us a very important lesson: people, authorities and companies must all adapt to new circumstances.
The best way to avoid losses is to implement effective preventive measures, such as more robust construction for buildings and infrastructure to better withstand natural disasters.
Thomas Blunck, Member of the Board of Management
Such precautions can help to maintain reasonable insurance premiums, even in high-risk areas. And most importantly: to reduce future exposure, new building development should not be allowed in high-risk areas.
Global Summary of Natural Disasters – H1 2025
| Category | 2025 H1 | 2024 H1 (adj.) | 5-yr avg (2020–2024) | 10-yr avg (2015–2024) | 30-yr avg (1995–2024) |
| Overall losses in $bn | 131 | 155 | 125 | 101 | 79 |
| Insured losses in $bn | 80 | 64 | 53 | 41 | 26 |
| Fatalities | 7100 | 4600 | 16500 | 11300 | 22400 |
Top 5 Natural Disasters by Overall Losses – H1 2025
| Date | Country/Region | Event | Fatalities | Overall losses ($bn) | Insured losses ($bn) |
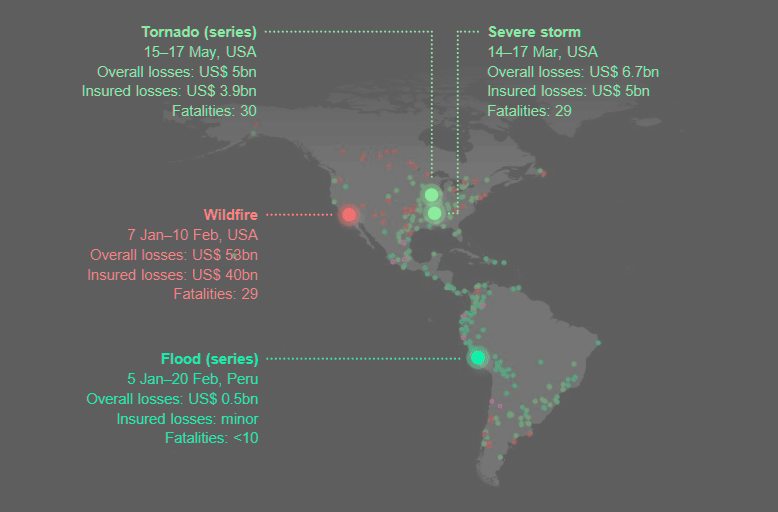
| 7.1–10.2.2025 | United States | Wildfire | 29 | 53 | 40 |
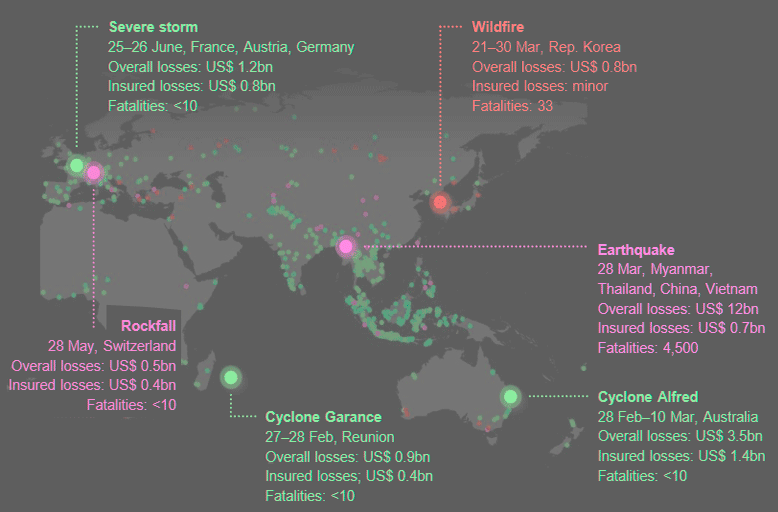
| 28.3.2025 | Myanmar, Thailand, China, Vietnam | Earthquake | 4500 | 12 | 0.7 |
| 14–17.3.2025 | United States | Severe storm | 29 | 6.7 | 5.0 |
| 15–17.5.2025 | United States | Tornado (series) | 30 | 5.0 | 3.9 |
| 2–7.4.2025 | United States | Severe storm | 23 | 4.0 | 2.8 |
Wildfires in Los Angeles Mark Most Costly Disaster
The wildfires that swept through the Los Angeles region in January 2025 caused an estimated $53 bn in total economic losses, with $40 bn covered by insurance. This event stands as the most expensive natural disaster globally in the first half of the year.
The fires claimed 29 lives and surpassed all previous wildfire loss records. Insured and total losses from this single event were nearly double the figures seen during 2018, previously the worst wildfire year on record.
Unusually, the fires erupted in winter—a season that typically brings rainfall to Southern California. But in late 2024, the region experienced an extended dry period following years of above-average precipitation.
This earlier rainfall had accelerated vegetation growth, which later dried into dense, flammable brush. Combined with strong seasonal Santa Ana winds, conditions aligned for rapid fire spread once ignition began on 7 January.
High winds acted as accelerants, carrying embers across long distances and igniting homes and commercial structures. Firefighters faced extreme challenges as flames leapt across highways and moved unpredictably through suburban areas.
California’s Wildfire Season Extends
According to chief climate scientist Tobias Grimm, California’s wildfire season now extends further into the year due to decreased precipitation in cooler months, creating a frequent overlap between drought conditions and windstorms.
While strong Santa Ana winds are not unusual, their alignment with extreme dryness significantly increases fire risk. He warned that in such scenarios, a single spark can result in widespread destruction.
Research institutions continue working on solutions. Munich Re has supported the Institute for Business and Home Safety (IBHS) in the U.S. for years. IBHS tests fire-resistant construction methods aimed at reducing building-to-building ignition and improving resilience in fire-prone regions.
Climate Researchers Attribute the Frequency
Climate researchers attribute the frequency and intensity of recent disasters to long-term environmental trends.
According to NOAA, global average temperatures in the first half of 2025 were 1.4°C above pre-industrial levels, marking it as the second-warmest January–June period on record. This follows a record-breaking 2024.
Myanmar Earthquake Causes $12bn in Losses
A 7.7-magnitude earthquake struck central Myanmar on 28 March 2025, killing an estimated 4,500 people. The quake’s epicentre lay near the cities of Sagaing and Mandalay, both densely populated with over one million residents combined.
It stands as the second-costliest natural disaster in H1 2025, with economic losses estimated at $12 bn. However, insured losses remain minimal due to low coverage rates in the region.
The earthquake occurred along the active Sagaing Fault, which runs north to south through Myanmar. Its force reached as far as Bangkok, 1,000 km away.
While structural damage in the Thai capital was limited, soft alluvial soil under the city magnified and prolonged the shaking, increasing risk to older buildings and infrastructure.
Seismic risk in this region remains high
Seismic risk in this region remains high, and infrastructure vulnerabilities persist. The quake highlighted the urgent need for updated building codes and better emergency preparedness in urban areas along known fault lines.
Natural Catastrophe Loss Worldwide. Regional Overview
Economic & Insured Losses per Continent – H1 2025
| Continent | Overall losses ($bn) | Insured losses ($bn) | Fatalities |
| North America (incl. Central America, Caribbean) | 95 | 72 | 258 |
| South America | 2.0 | 0.12 | 226 |
| USA | 93 | 71 | 192 |
| Asia-Pacific / Africa | 29 | 4.9 | 6,600 |
| Europe | 4.9 | 2.8 | 21 |
Europe Records $5bn in Weather-Related Losses
Europe faced several damaging weather events in the first half of 2025, but overall losses remained lower than in the previous year. Total economic losses reached approximately $5 bn, with more than half covered by insurance.
The most costly event was a cluster of severe thunderstorms in June
Hailstorms swept across France, Austria, and Germany, damaging vehicles, homes, and infrastructure. Insured losses totaled around $800 mn, while total losses reached $1.2 bn.
In Switzerland, a catastrophic landslide struck the Loetschental valley in the canton of Valais on 28 May. Triggered near the Kleines Nesthorn—an alpine peak rising over 3,300 meters—the landslide released millions of tonnes of debris and glacial ice from the Birch Glacier. The village of Blatten, which had been evacuated in advance, was nearly buried under the avalanche. Total losses were just under $500 mn, with insurers covering about $400 mn.
Geologists warn that these events could become more frequent
Melting glaciers and thawing permafrost, both linked to rising temperatures, are destabilizing mountain slopes and increasing the risk of high-altitude landslides across the Alps.
Americas Record $19 bn Losses, $14.6 bn was Insured
The USA accounted for by far the largest share of natural disaster losses in the first half of the year – particularly due to the wildfires around Los Angeles.
In addition, there were once again numerous severe thunderstorms in the United States that triggered heavy rainfall and tornadoes.
The four most expensive series of storms, including severe tornado outbreaks, occurred in March, April and May – resulting in overall losses of around $19 bn, of which $14.6 bn was insured.
Overall, losses from these kinds of storms (known as severe convective storms) in the United States totalled $34 bn in the first six months of 2025. Around $26 bn of the losses were insured.
Asia-Pacific and Africa Record $29bn in Disaster Losses
Natural disasters across Asia-Pacific and Africa caused an estimated $29 bn in total losses in the first half of 2025.
Insured losses amounted to just $5 bn, underscoring the persistent protection gap in both regions. This figure came in slightly below the ten-year average, despite multiple high-impact events.
In Australia, Cyclone Alfred ranked as the second-most severe event in the region after the Myanmar earthquake. The storm briefly intensified to Category 4 strength and brought torrential rain across Queensland and New South Wales.
Flooding caused widespread disruption, leaving over 500,000 residents without power for days. Total losses reached $3.5 bn, with insurers covering $1.4 bn.
What made Alfred unusual was its track
The cyclone moved far south into a non-tropical area east of Brisbane, raising concerns among meteorologists.
Climate models indicate that tropical systems may strike these regions more often as warming ocean temperatures expand storm-prone zones.
Taiwan also sustained major losses
A magnitude-6 earthquake struck Tainan on 21 January, a city at the core of the country’s high-tech manufacturing corridor.
The quake led to $1.3 bn in damage, with insured losses estimated at $600 mn. Much of that came from business interruption coverage within the semiconductor sector.
Manufacturing in cleanroom environments is highly sensitive—any disruption often results in unusable products, driving up costs.
Indian Ocean cyclones
In the southwest Indian Ocean, two cyclones contributed $1.5 bn in total losses. In February, Cyclone Garance lashed the French island of Réunion with winds reaching 180 km/h and heavy rain. The storm cut off power and water supplies across much of the island.
Two weeks later, another cyclone hit Mozambique and Madagascar. Damage was severe, especially in Mozambique, where low-quality housing and bridges collapsed.
Réunion accounted for roughly $400 mn in insured losses. In contrast, coverage in Mozambique was negligible.
These events again highlight the vulnerability of developing regions and the urgent need for expanded insurance penetration, particularly in countries where infrastructure remains fragile and disaster recovery resources are limited.
FAQ: Global Natural Catastrophes
Global natural disasters caused $131 bn in total losses during H1 2025, with $80 bn covered by insurance. Though lower than the inflation-adjusted $155 bn in 2024, the figures remain significantly above the 10- and 30-year averages.
The January wildfires in the Los Angeles area caused $53 bn in overall losses, with $40 bn insured. This marks the costliest wildfire event ever recorded and the most expensive global disaster in H1 2025.
Insured losses of $80 bn rank as the second-highest for any first half-year since 1980. Only the first half of 2011, which included Japan’s earthquake and tsunami, recorded higher insured losses.
Weather events accounted for 88% of total losses and 98% of insured losses globally. Earthquakes contributed 12% of the overall figure and just 2% of insured losses.
These regions recorded $29 bn in total losses and $5 bn in insured losses. Key events included Cyclone Alfred in Australia, the Myanmar earthquake, and two cyclones in the southwest Indian Ocean.
Insurance penetration remains limited in parts of Asia and Africa. In Myanmar, Mozambique, and Madagascar, most of the economic losses were uninsured due to lack of coverage infrastructure and affordability constraints.
Experts such as Thomas Blunck and Tobias Grimm emphasize structural improvements, better planning, and restricting new development in high-risk areas. They also stress the need for climate adaptation as changing conditions increase disaster frequency.
………………
QUOTTES: Thomas Blunck – Munich Re’s Member of the Board of Management, Tobias Grimm – Head of Climate Advisory and Natcat Data with Munich Re’s Climate Change Solutions Department
Edited by Nataly Kramer