Overview
- US Hurricanes: Economic Loss Leaders
- US Hurricanes: Insured Loss Leaders
- U.S. Hurricane: Evaluating Economic and Insured Damage Losses
- Economic vs. Insured Losses of Major U.S. Hurricanes (2016–2025)
- Number of United States Hurricane since the 1850s
- North Atlantic Tropical Storms and Hurricanes
- US Hurricane Records: A Decade of Storms (2015-2025)
Hurricanes are not merely meteorological events; they are social and economic stress tests for the United States. Each major storm reveals the fragile intersection of human settlement, infrastructure, and financial systems. Beinsure analyzed US Hurricanes economic and insured losses since 2015 and highlighted the key points.
Since 2015, the nation has endured a series of record-breaking hurricanes—Harvey, Irma, Maria, Michael, Laura, Ida, Ian, Beryl, and Helene—that collectively reshaped how we measure and manage risk.
The data speak clearly: losses once considered exceptional now occur with unsettling frequency. Hurricanes and floods drive $100 bn insured losses.
Economic damage routinely crosses the $50 bn threshold, while insured losses regularly exceed $20 bn.
- Hurricane Harvey demonstrated the vast gulf between economic and insured costs—over $80 bn in damage but only $19 bn covered—exposing structural underinsurance, especially for flood risk.
- Ian, by contrast, generated $42–63 bn in insured payouts, destabilizing Florida’s already strained insurance market.
These contrasts illustrate that the financial burden is distributed unevenly, with governments and households often absorbing what insurers cannot.
Global insured losses from natural catastrophes reach $80 bn in H1 2025. This is almost double the 10-year average and more than half of the $150 bn, according to Global Natural Catastrophe Insured Losses Review.
Key Highlights
- Hurricane Ian (2022) and Helene (2024) both exceeded $110 bn in economic losses, showing that $100 bn events are no longer rare outliers but recurring benchmarks.
- Harvey (2017) caused more than $80 bn in economic damage but only $19 bn was insured, underscoring the persistent underinsurance of flood risk in the U.S.
- Ian (2022) generated $42–63 bn in insured losses, destabilizing Florida’s property insurance system and forcing several carriers into insolvency.
- Despite growth in private flood coverage, only about 4% of U.S. homeowners carry flood insurance. This leaves most households unprotected against flooding, the leading cause of hurricane losses.
- International reinsurers, along with NFIP catastrophe bonds, now back billions in U.S. hurricane exposure, reflecting how global capital is critical to absorbing systemic catastrophe risk.
US Hurricanes: Economic Loss Leaders
Among U.S. hurricanes since 2015, Hurricane Ian (2022) and Hurricane Harvey (2017) stand out for total economic destruction. Ian caused about $112 bn in overall losses, fueled by catastrophic storm surge, destroyed coastal towns, and widespread infrastructure damage across Florida.
Harvey, while lower in insured payouts, produced $81–100+ bn in economic damage due to unprecedented flooding in Texas. Hurricane Helene (2024) also joined the top tier, with losses near $110 bn, demonstrating that inland states remain vulnerable when tropical systems stall and release record rainfall.
These storms reveal how population growth, aging infrastructure, and climate trends magnify financial exposure well beyond insured coverage.
US Hurricanes: Insured Loss Leaders

The storms that generated the largest insured claims differ slightly from those with the biggest economic footprint.
Hurricane Katrina (2005) remains the record at $104.5 bn (2024 adjusted), but in the modern era, Hurricane Ian (2022) ranks highest, with insured losses between $42–63 bn. Hurricane Irma (2017) and Hurricane Maria (2017) followed, each driving around $30 bn in insured payouts.
By contrast, Harvey produced smaller insured losses (~$19 bn) despite its enormous economic toll, highlighting the gap in flood insurance participation (see Most Severe Natural Disasters in 2025).
This discrepancy shows that while insurers face rising catastrophe risk, much of the financial burden still falls on governments and households outside private insurance programs.
U.S. Hurricane: Evaluating Economic and Insured Damage Losses
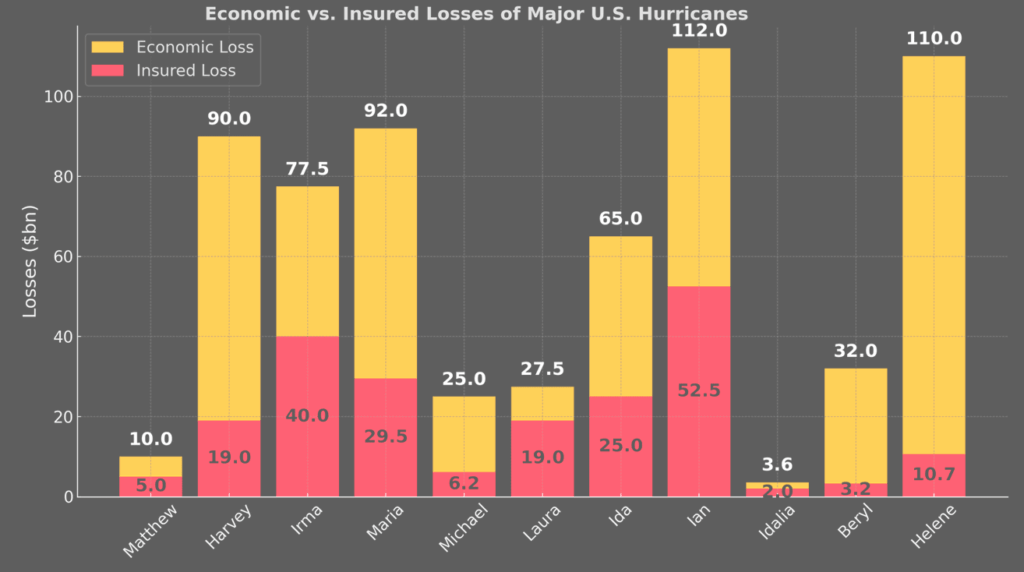
| Hurricane | Year | Estimated Economic Loss | Insured Loss |
| Matthew | 2016 | $10 bn | $3-6.8 bn |
| Harvey | 2017 | $81–100+ bn | ~$19 bn |
| Irma | 2017 | $60-95 bn | $30-50 bn |
| Maria | 2017 | ~$92 bn | ~$29.5 bn |
| Michael | 2018 | $25 bn | ~$6.2 bn |
| Laura | 2020 | $25–30 bn | ~$19 bn |
| Ida | 2021 | $65 bn | $15–35 bn |
| Ian | 2022 | ~$112 bn | $42–63 bn |
| Idalia | 2023 | ~$3.6 bn | $2 bn |
| Beryl | 2024 | ~$32 bn | $2-4.5 bn |
| Helene | 2024 | ~$110 bn | $6.4-15 bn |
Economic vs. Insured Losses of Major U.S. Hurricanes (2016–2025)
The U.S. private flood insurance market has expanded in recent years, supported by technology, analytics, and federal policy changes. From 2020 to 2024, private residential flood policies grew at a 20% annual rate, while federal policies declined.
Despite this growth, penetration remains low: only 4% of U.S. homeowners have flood coverage, leaving the majority exposed.
Economic flood losses far exceed insured losses, as shown in Texas flooding in 2025 with $18–22 bn in damage, most of it uninsured.
The National Flood Insurance Program (NFIP) continues to dominate, especially in high-risk areas where mortgages require coverage. However, NFIP faces frequent short-term congressional extensions and low limits of $250,000 for homes. These constraints undermine its effectiveness. Congress recently debated another extension to prevent expiration in March 2025.
Private carriers benefit from advances in flood mapping and risk-based pricing, offering broader options to homeowners and businesses.
By 2024, $0.5 bn in private residential flood premiums and $750 mn in commercial flood premiums were written. Underwriting results have generally been favorable, with direct loss ratios below 50% in most years.
The only major loss year was 2017, when hurricanes, particularly Harvey, pushed private flood combined ratios near 188%.
Number of United States Hurricane since the 1850s
| Decade | Number of hurricanes |
| 1850s | 16 |
| 1860s | 15 |
| 1870s | 19 |
| 1880s | 25 |
| 1890s | 22 |
| 1900s | 17 |
| 1910s | 21 |
| 1920s | 15 |
| 1930s | 18 |
| 1940s | 23 |
| 1950s | 18 |
| 1960s | 13 |
| 1970s | 12 |
| 1980s | 16 |
| 1990s | 14 |
| 2000s | 19 |
| 2010s | 13 |
| 2020s | 15 |
Global reinsurers, including Lloyd’s syndicates, Munich Re, and Swiss Re, have supported the U.S. market with capital, modeling, and turnkey flood products. The NFIP itself has secured over $3 bn of reinsurance through catastrophe bonds and traditional placements since 2018.
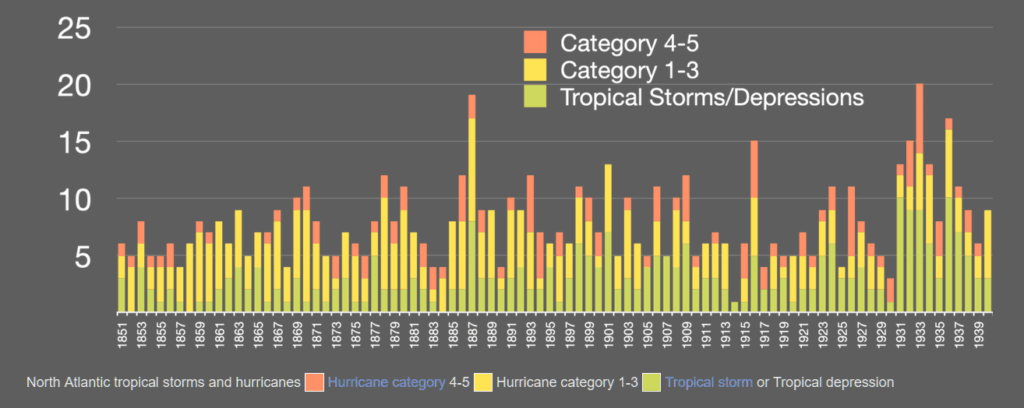
North Atlantic Tropical Storms and Hurricanes
North Atlantic tropical storms and hurricanes represent one of the most persistent and damaging natural hazards for the United States and surrounding regions.
Records maintained by NOAA since the mid-19th century show clear variability in storm frequency across decades, but recent years reveal a notable increase in both the number of named storms and the intensity of major hurricanes.
Warmer ocean surface temperatures, rapid coastal development, and higher value concentration in urban areas all contribute to escalating financial and social consequences.
US Storms and Hurricanes (1851–1940)
US Storms and Hurricanes (1941–2021)
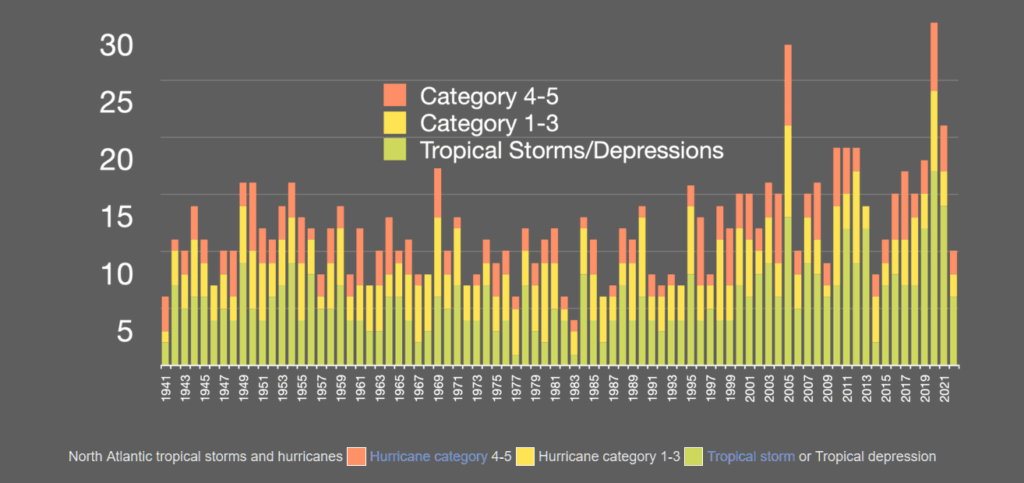
Historically, the late 19th century and mid-20th century registered active storm periods, but the modern era has surpassed them in terms of destructive power.
From 2015 to 2025, hurricanes such as Harvey, Irma, Maria, Ian, and Helene have each inflicted tens of billions of dollars in damage, with several surpassing the $100 bn threshold in economic losses.
This reflects not only stronger storms but also growing exposure of populations and infrastructure.
US Hurricane Records: A Decade of Storms (2015-2025)

Hurricane Matthew (2016)
Hurricane Matthew struck the southeastern U.S. in October 2016, bringing storm surge, extreme rainfall, and winds that battered Florida, Georgia, South Carolina, and North Carolina.
The storm caused catastrophic flooding in North Carolina, damaging tens of thousands of homes.
At least 47 people died in the U.S. Economic losses were estimated around $10 bn. Insured losses were significant but varied by state (from $2,2 to $6,8 bn), with property damage, crop destruction, and business interruption driving claims.
Matthew highlighted the vulnerability of inland areas to flooding, reinforcing the importance of flood insurance in regions not traditionally considered high risk.
Hurricane Harvey (2017)
Harvey made landfall in Texas in August 2017 as a Category 4 storm, stalling over the Houston metro area and unleashing unprecedented rainfall. Some neighborhoods recorded more than 50 inches of rain, creating widespread flooding that inundated hundreds of thousands of homes.
At least 107 people died, and millions were displaced. Total economic damage estimates ranged from $81 bn to over $100 bn, making Harvey one of the costliest U.S. hurricanes.
Insured losses totaled roughly $19 bn, largely driven by auto, home, and commercial property claims. Harvey also exposed limitations in flood insurance availability and FEMA’s capacity for large-scale disaster recovery.
Hurricane Irma (2017)
Hurricane Irma, a powerful Category 4, hit Florida in September 2017 after sweeping through the Caribbean. It caused extensive wind damage, storm surge flooding, and widespread power outages, leaving millions without electricity for days. Florida’s agriculture sector suffered huge losses, particularly citrus crops. Irma killed at least 92 people in the U.S.
Hurricane Irma caused an estimated $50 bn in insured losses in the United States, primarily in Florida, making it the costliest hurricane in the state’s history at the time. Total economic losses were significantly higher, ranging between $60 and $95 bn when including the wider impact on the Caribbean.
Irma revealed how statewide evacuation orders strained transportation and emergency systems. It underscored the need for resilient grid infrastructure and diversified catastrophe reinsurance programs.
Hurricane Maria (2017)
Hurricane Maria, a Category 4 storm, devastated Puerto Rico in September 2017, causing widespread destruction of housing, energy, and health systems. The entire island lost power, with some communities waiting months for restoration.
Maria caused thousands of deaths directly and indirectly, largely from prolonged infrastructure collapse.
Economic losses were estimated at about $92 bn, with insured losses near $29.5 bn (2024 adjusted). Limited insurance penetration in Puerto Rico left many households and businesses unprotected, complicating recovery.
Maria demonstrated how fragile infrastructure and weak preparedness planning can multiply the human and financial toll of severe hurricanes in U.S. territories.
Hurricane Michael (2018)
Hurricane Michael struck the Florida Panhandle in October 2018 as a rare Category 5 storm with sustained winds near 160 mph. It flattened entire communities, destroyed Mexico Beach, and caused catastrophic wind and storm surge damage across Florida, Georgia, and the Carolinas.
Michael killed at least 74 people and caused total U.S. damages estimated at $25 bn. Insured losses amounted to around $6.2 bn, with residential and commercial property claims driving most of the cost.
The storm highlighted the risks of rapid intensification, leaving residents and insurers little time to prepare, and emphasized gaps in resilient construction in coastal communities.
Hurricane Laura (2020)
Hurricane Laura, a Category 4 storm, struck southwest Louisiana in August 2020, producing catastrophic winds, storm surge, and flooding.
It caused at least 81 deaths and leveled parts of Lake Charles, while damaging petrochemical plants, refineries, and utilities. Economic damages ranged from $25–30 bn. Insured losses were estimated at $19 bn, making Laura one of the costliest Louisiana storms since Katrina.
The hurricane forced insurers to rethink exposure in Gulf Coast petrochemical corridors and revealed challenges in providing affordable coverage for high-risk properties.
Laura also underscored the vulnerability of power infrastructure, with widespread outages persisting for weeks after landfall.
Hurricane Ida (2021)
Hurricane Ida struck Louisiana in August 2021 as a strong Category 4, with winds topping 150 mph. It caused widespread damage to homes, businesses, and critical energy infrastructure, temporarily halting Gulf oil production.
The storm then moved northeast, bringing catastrophic flooding to New York and New Jersey subways and highways.
Hurricane Ida caused an estimated $65 bn in total damage across the United States, with a significant portion of that damage being insured.
Louisiana alone experienced over $13 bn in paid or reserved insurance claims, and many insurers faced insolvency due to the financial strain. The total economic impact, including uninsured losses, was substantial, with thousands displaced and widespread power outages across the affected regions
At least 91 people died across affected states. Insured losses ranged from $15 bn to $35 bn.
Ida highlighted the challenge of managing multi-regional events, where initial landfall damages compound with inland flooding, overwhelming insurers, FEMA, and state disaster response systems.
Hurricane Ian (2022)
Hurricane Ian hit southwest Florida in September 2022 as a Category 4 storm, producing a massive storm surge that devastated coastal towns like Fort Myers Beach. Inland flooding further destroyed homes, infrastructure, and agricultural land.
Ian caused at least 161 deaths, the deadliest U.S. hurricane since Katrina. Economic losses reached $112 bn, while insured losses ranged between $42–63 bn, with some catastrophe models projecting higher totals.
Ian disrupted Florida’s property insurance market, driving several insurers into insolvency. The disaster also fueled debates over climate change, rising coastal risk, and the long-term sustainability of Florida’s reinsurance-dependent insurance system.
Hurricane Idalia (2023)
Hurricane Idalia made landfall in Florida’s Big Bend region in August 2023 as a Category 3 storm, bringing storm surge up to 16 feet in some coastal areas.
Though less deadly than Ian, Idalia killed 12 people and caused widespread flooding, property damage, and agricultural losses, particularly in rural communities.
Hurricane Idalia caused an estimated $3.6 bn in damage in the United States, according to a National Hurricane Center report.
This total includes losses from storm surge, widespread flooding, and severe impacts on Florida’s agricultural sector, with initial assessments placing agricultural losses at over $447 mn in Florida alone.
Hurricane Idalia caused estimated insured losses of less than $2 bn, which was lower than initially expected for a Category 3 hurricane.
This was attributed to the lower average replacement cost of homes in the affected areas of Florida and Georgia compared to other hurricane-prone regions
Idalia reinforced how smaller coastal towns face outsized risks, as limited infrastructure and insurance availability hinder recovery. It also tested Florida’s fragile insurance market already weakened by the financial aftershocks of Hurricane Ian.
Hurricane Beryl (2024)
Hurricane Beryl hit Texas in July 2024, intensifying quickly before landfall and catching many residents by surprise.
It killed at least 36 people, destroyed thousands of homes, and left millions without power during intense summer heat. Damage estimates climbed to $32 bn, with insured losses not yet fully calculated but expected to be substantial.
Estimates for insured losses from Hurricane Beryl, which impacted the Caribbean, Yucatán Peninsula, and U.S. Gulf Coast in 2024, range from $2 bn to $4.5 bn according to multiple sources.
These losses are spread among primary insurers, with some economic losses potentially triggering parametric coverages
Beryl underscored the challenge of forecasting rapid intensification in Gulf waters, where warm sea surface temperatures can turn weaker systems into major storms in less than 24 hours.
The storm placed new pressure on Texas insurers already grappling with high reinsurance costs and climate-related volatility.
Hurricane Helene (2024)
Hurricane Helene, striking in September 2024, caused catastrophic flooding and wind damage across the Southeast and Tennessee Valley.
With at least 52 deaths reported, Helene became one of the deadliest recent storms outside of Florida and Texas. The storm caused nearly $110 bn in total damage, making it one of the costliest U.S. hurricanes ever recorded.
Total estimated insured losses for Hurricane Helene vary by source and peril, with early estimates placing overall insured losses between $6.4 bn and $15 bn, while the National Flood Insurance Program (NFIP) specifically recorded losses between $6.4 bn and $7.4 bn by February 2025. The CoreLogic estimate for total insured losses, including both wind and flood, ranged from $6 bn to $11 bn.
Helene overwhelmed power grids, flooded highways, and exposed vulnerabilities in inland infrastructure not built for tropical systems. The scale of economic losses reignited debates over national flood insurance reform and the rising costs of climate risk.
FAQ
Hurricanes expose weaknesses in infrastructure, insurance systems, and disaster response. They reveal how communities, governments, and insurers handle simultaneous shocks to housing, energy, transportation, and finance. Each storm uncovers systemic vulnerabilities that extend far beyond weather impacts.
Hurricane Ian (2022) caused ~$112 bn in losses, followed by Hurricane Helene (2024) at ~$110 bn, and Hurricane Harvey (2017) at ~$81–100+ bn. These events show how climate patterns and rapid urbanization drive escalating financial risk.
Ian leads recent history with $42–63 bn in insured payouts. Irma (2017) and Maria (2017) each caused about $30 bn in claims. Harvey produced $19 bn in insured losses despite $80 bn+ in economic damage, exposing flood insurance gaps.
Flood risk remains heavily uninsured in the U.S. Only 4% of homeowners carry flood coverage, leaving most damage uninsured. Programs like the National Flood Insurance Program (NFIP) have coverage caps and limited uptake, widening the gap.
Private flood insurance has grown since 2020, supported by better flood mapping, analytics, and risk-based pricing. By 2024, premiums reached ~$0.5 bn for residential and ~$750 mn for commercial policies, but penetration remains low compared to need.
Reinsurers like Munich Re, Swiss Re, and Lloyd’s syndicates provide capital and catastrophe models. Since 2018, the NFIP itself has transferred over $3 bn of risk to reinsurance markets through catastrophe bonds and traditional placements.
NOAA data shows a rising frequency of named storms and major hurricanes, especially since the 1990s. Between 2010–2020, 13 hurricanes were recorded per decade, compared with 23 in the 1940s and 25 in the 1880s. Climate change, warmer oceans, and denser coastal populations amplify the damage today.
…………………………..
AUTHORS: Nataly Kramer and Yana Keller — Lead Insurance Editor of Beinsure Media