Overview
In fact, to close out the first quarter on March 31st, NOAA Storm Prediction Center has confirmed 138 tornadoes which would rank as the 3rd most recorded in a 24-hour period since 1950.
BMS iVision accumulated severe weather frequency for wind gusts of 60 mph or greater, hail 1”+, and the occurrence of tornadoes for the first quarter of 2024.
The areas that have seen an unusual amount of severe weather this year include areas around Dallas and Fort Worth into the southeast and up into the Middle Mississippi River Valley.
U.S. insurance industry will be a costly
There is no doubt that the first quarter of the U.S. insurance industry will be a costly one. The insurance industry is struggling to adapt to a new normal in which losses fueled by climate change are now regularly exceeding $100 bn a year.
Insured losses from natural disasters hit about $120 bn in 2024, most of which was weather related, according to data compiled by Munich Re.
Q1 2025 severe weather insured losses should come in at a range of $7 bn to $9.5 bn of insured severe thunderstorm storm losses from hail, tornado, and thunderstorm wind gusts.
According to industry claims data and estimates by BMS Re, losses are still developing, but the initial estimates provide a large aggregate loss that has occurred over 12 severe weather events since January 1st.
Climate Forcers of Severe Weather Causing High Losses
The main loss driver is expected to be three $1 billion-plus events in March, including the Rolling Fork, MS, and Little Rock, AR, tornado weather systems that impacted a much larger area than these specific tornado tracks (see Top 10 Global Economic & Insured Loss Events).
With the understanding that the insurance industry is already in a heightened inflation era, even CPI loss adjustments must be taken with a grain of salt. Still, on a CPI-adjusted basis, the January – March first quarter U.S Severe weather losses appear to be at or close to a modern-day record.
he most recent benchmark years for severe weather in terms of severe weather reports have been 2008 and 2011 (see Natural Catastrophes Drivers). However, what makes this year stand out is the noticeable steady or even downward trend in the occurrence of severe weather in recent years for perils like hail.
Main Ingredient Needed for Severe Weather
First, we need to understand the main feature atmospherically that drives severe weather to occur in the central plains and into the eastern half of the U.S.
This feature is an upper-level trough of low pressure that combines with an active jet stream across the Western U.S. State that ejects and allows for the formation of surface low pressure into the central plain states.
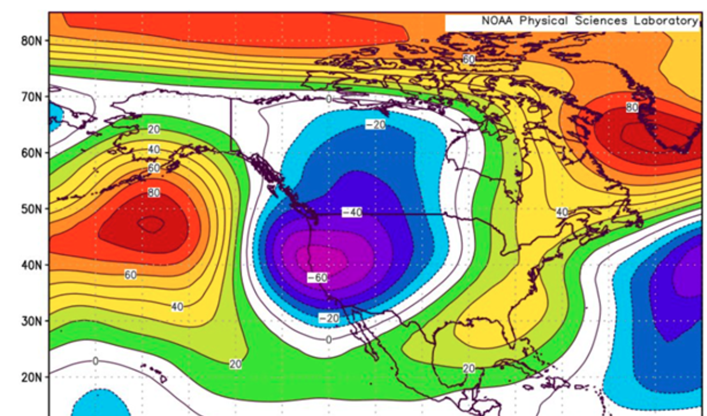
The chart that best explains the last four months across the U.S. weatherwise might be this 500mb height anomaly, which shows that the overall pattern of a trough of low pressure has been prevalent in the western U.S. (see Global Insured Losses from Natural Catastrophes).
As a result, many likely experience the best ski season in a lift time and a ridge of high pressure along the East Coast, which has provided all the snowbirds in the southeast with great mid-winter heat. This pattern has modulated extremes on both sides of the nation.
This overall pattern of a trough along the west coast and ridge along the east coast could also be enhanced by the sea surface conditions that are occurring in the Pacific Ocean.
The Central Pacific Ocean is coming out of a rare multi-year La Niña which, in general, tends to provide an active jet stream across the U.S. during the winter months and tends to lead to higher occurrences of severe weather across the U.S.
Now, the overall pattern that has been occurring is not entirely driven by the weakening La Niña in the Central Pacific.
Overall, the climate forcers explained above match closely with other active severe weather years like the 2011 season, which was very busy in April and May and resulted in the 2011 Tuscaloosa and Joplin tornado events.
Therefore, due to these climate forcers, the 2024 severe weather season has been enhanced and will likely continue into later April after a brief pattern change in the central U.S. with a temporary ridge of high pressure that will provide the first warm-up to the upper Midwest and put a lid on Central Plains severe weather for a week or so.
In summary, severe weather losses will be a function of where the severe weather occurs and the overall exposure it impacts.
Hail remains the primary driver of annual U.S. thunderstorm losses. Still, media attention will always be drawn to the significant impactful tornadoes, which tend to drive the tail losses for most insurance portfolios.
It is impossible to forecast how the spring severe weather season will unfold and where severe weather will strike in detail. Still, it does appear that the dice are loaded for a higher occurrence of severe weather this spring season.
……………………….
AUTHOR: Andrew Siffert – Senior Vice President, Senior Meteorologist at BMS Group