Overview
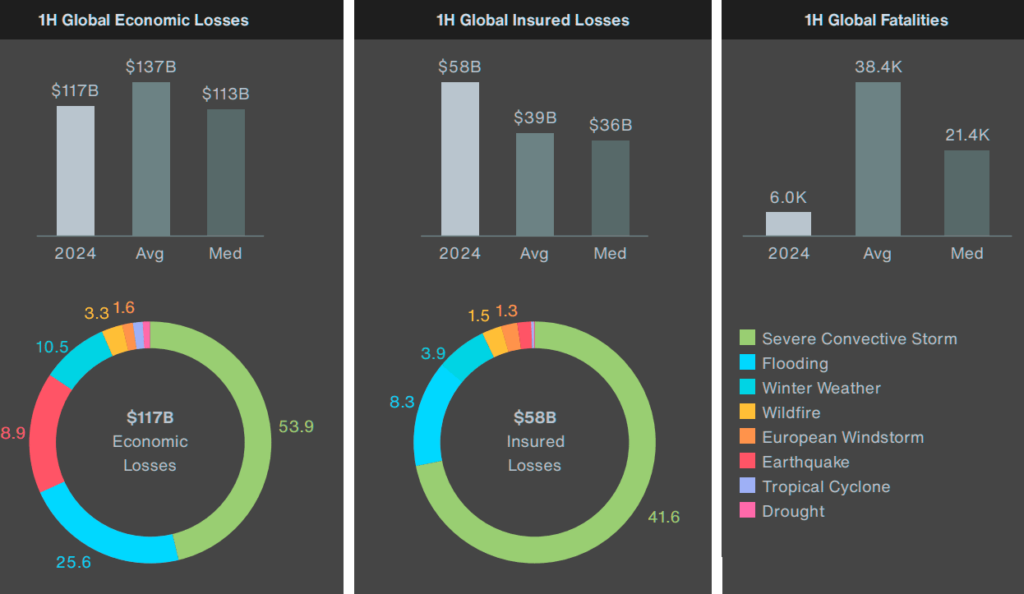
1H 2024 saw multiple notable natural catastrophe events, which drove total year-to-date economic losses above at least $117 bn. This was lower than the 21st-century 1H average of $137 bn andsignificantly lower than losses in the first half of 2023 ($226 bn).
According to Aon`s Global Catastrophe Recap report, the second quarter was marked not only by multiple costly severe convective storm events in the United States, but also by a number of significant flood events in Germany, Brazil, United Arab Emirates and China.
Insured losses in the first half of 2024 are expected to reach at least $58 bn, well above the 21st-century average of $39 bn.
It is nevertheless lower than in the previous three years, which all saw global losses exceeding $60 bn by the end of June at current price levels (see Top 10 Costliest Insured Events).
Insurance protection gap
However, outlook for the next six months is marked by heightened expectations of potentially costly hurricane season, as well as continuing convective storm activity in the United States and Europe. By early July, the second named storm of the season, Hurricane Beryl, already resulted in potentially multi-billion-dollar losses.
The insurance protection gap is estimated at 50%, one of the lowest on record for the first half of the year.
This is due to the higher contribution of SCS insured losses. Fatalities are estimated at over 6,000, the lowest since 2020 and below long-term averages.
The global re/insurance industry is moving towards more stable market conditions, with some uncertainty due to the ongoing hurricane season and secondary peril losses. Insurers are expected to retain a higher proportion of losses in many regions.
Natural Catastrophe Economic Losses
Global reinsurer capital reached record levels in Q1, with both traditional and alternative capital hitting new highs. Inflation rates are declining globally but remain above 3% in the US.
Global economic losses from natural disasters in the first half of 2024 are estimated at $117 bn, about 15% lower than the long-term average of $137 bn since 2000, and slightly above the median of $113 bn.
There were 30 billion-dollar events, with 22 in the US, two in South America, four in Asia, and two in EMEA. These numbers may change as loss estimates evolve over time. Weather-related events drove $130 bn losses.
Global Economic Losses


The Noto earthquake on January 1 remains the costliest event of the year, with over $17 bn in direct damage. Significant severe convective storms in the US, and extensive flooding in southern Germany and China, also rank among the top even.
Top 5 Costliest Economic Loss Events in 1H 2024
| Date | Event | Location | Fatalities | Economic Loss ($ bn) |
|---|---|---|---|---|
| 01/01 | Noto Earthquake | Japan | 299 | 17.9 |
| 06/09-07/14 | South & Central China Floods | China | 150 | 6.3 |
| 03/12-03/16 | Severe Convective Storm | United States | 3 | 5.9 |
| 06/01-06/07 | South Germany Floods | Germany | 6 | 5.4 |
| 05/06-05/10 | Severe Convective Storm | United States | 6 | 5.0 |
Preliminary estimates show that economic losses in the United States were well above their long- and short-term averages, primarily due to severe convective storm activity.
In contrast, all other regions recorded below-average losses in the first half of the year. Notably, the EMEA region experienced approximately $15 bn in economic losses so far in 2024, a significant decrease from last year’s extremely costly earthquake in Turkey and Syria.
Economic Losses by Region

Natural Catastrophe Insured Losses
Global insured losses from natural disaster events in the first half of 2024 are estimated to reach at least $58 bn, which was significantly higher than average since 2000 ($39 bn) and median of the same period ($36 bn).
It is nevertheless a slight decrease compared to the costly years of 2021-2023, which all saw losses exceeding $60 bn in the 1H.
The financial toll of the first six months was dominated by the severe convective storm peril with roughly three quarters of the total, yet flooding and winter weather were also responsible for a notable part of the aggregated loss.
Global Insured Losses


Natural disasters in the United States accounted for nearly 80% of global insured losses in the first half of 2024, reaching nearly $46 bn. This figure is more than 90% higher than the long-term 1H average since 2000.
In EMEA, insured losses were about 12% higher than average, while insurers in APAC and the Americas regions faced lower-than-average losses.
Updated Hurricane Season Forecasts
Several groups and institutions have updated their long-range forecasts for the upcoming North Atlantic Hurricane season, with many adjusting their already high predictions further upwards. All forecasts suggest that 2024 will be very active, with an average of 11-12 hurricanes expected.
Selected 2024 Hurricane Season Forecasts
| Forecast Source | Named Storms | Hurricanes |
| Colorado State University | 25 | 12 |
| Tropical Storm Risk | 26 | 13 |
| University of Arizona | 23 | 10 |
| NOAA | 17-25 | 8-13 |
| UK Met Office | 22 | 12 |
| NC State University | 15-20 | 10-12 |
| ECMWF | 23 | 13 |
| Average (NOAA) | 14 | 7 |
El Niño typically aids storm formation by reducing wind shear, which hinders tropical cyclone development. Above-average sea surface temperatures (SST) also play a key role, as warm seawater enhances tropical cyclone formation and potential rapid intensification.
Insured Losses by Region

According to NOAA, the Atlantic hurricane season may coincide with an above-average west African monsoon, which often produces storm clusters that progress into the Atlantic, serving as seeds for future tropical cyclones.
……………
AUTHORS: Michal Lörinc – Aon’s Head of Catastrophe Insight, Ondřej Hotový – Catastrophe Analyst, Antonio Elizondo – Aon’s Senior Scientist, Tomas Cejka – Aon’s Catastrophe Analyst