Overview
- Q1 2025 fires trigger second highest H1 NatCat insured losses
- Total economic and insured losses in H1 2025 and H1 2024
- Global insured losses from natural catastrophes in 1H
- Non-seasonal wildfires account for half of the January-June losses
- Global annual insured losses from wildfires
- Severe convective storm losses remain high though below trend
- Lingering warming effects of a major heat dome
Global insured losses from natural catastrophes reach $80 bn in the first half of 2025. This is almost double the 10-year average and more than half of the $150 bn (in 2025 prices) projected for the full year, following the long-term annual growth trend of 5–7%, according to Swiss Re Institute’s report. Beinsure analyzed the report and highlighted the key points.
With natural catastrophe activity typically higher in the second half of the year, total insured losses for 2025 could therefore exceed the projection.
Wildfire risk is evolving amid settlement trends and lengthening of fire seasons, with changing climates compounding the loss threat that fires present. This adds volatility to global natural catastrophe losses, making the latter more difficult to predict.
Key highligths
- Global insured losses from natural catastrophes reached $80bn in the first half of 2025, nearly double the 10-year average and second only to 2011. The January wildfires in Los Angeles County alone caused $40bn in insured losses, accounting for nearly 70% of Q1 totals. This marks the fifth consecutive year with H1 insured losses above $50bn.
- Two fires in LA—Palisades and Eaton—destroyed over 16,000 structures and burned 40,000 acres. Together, they drove the highest-ever global insured wildfire losses for a six-month period, topping even previous full-year peaks. Wildfires now make up 7% of insured natural catastrophe losses globally, up from 1% a decade ago.
- A magnitude 7.7 earthquake struck Myanmar in March, killing around 3,900 people and causing an estimated $14bn in economic damage. Although insured losses were likely low due to limited insurance uptake in the region, the event highlighted seismic risks in densely populated areas.
- Severe convective storms (SCS) brought hail and tornado outbreaks across the US between March and June. Insured losses reached $31bn, the fourth costliest H1 total for this peril. Construction cost inflation—up 35.6% since 2020—and rising asset exposure (e.g. rooftop solar) contributed to the high claims.
- Historically, 60% of insured natural catastrophe losses occur in the second half of the year. With hurricane season peaking in September and record-warm Mediterranean waters increasing flood risk, 2025 is on track to exceed $150bn in insured losses. Forecasts predict up to five major hurricanes, and one landfall in a densely insured region could heavily skew totals. Swiss Re warns that total losses could surpass projections if Q3–Q4 activity intensifies.
In the second half, the Atlantic hurricane season approaching its peak remains a key swing factor for catastrophe activity although other perils, including wildfire, may also add to the full-year insured loss total.
Worldwide, most natural disasters caused overall losses of around $131 bn in the first half of 2025 (previous year, adjusted for inflation: $155 bn), of which $80bn was insured (in 2024: $64 bn).
Both overall losses and insured losses were significantly higher than the average for the previous ten years and the previous 30 years (adjusted for inflation: overall losses of $101/79 bn, insured losses of $41/26 bn).
Insured losses in H1 2025 were the second-highest in the first half of any year since our records began in 1980.
Only in the first half of 2011 were insured losses even higher, attributable to a severe earthquake and destructive tsunami in Japan, according to Munich Re.
Q1 2025 fires trigger second highest H1 NatCat insured losses
Swiss Re Institute’s preliminary estimates see global insured losses from natural catastrophes reaching $80 bn in the first half of this year.
The main drivers were the wildfires that swept through parts of Los Angeles (LA) County in January, these alone accounting for close to 70% of the global insured losses in the first quarter, according to WTW’s Natural Catastrophe Review.
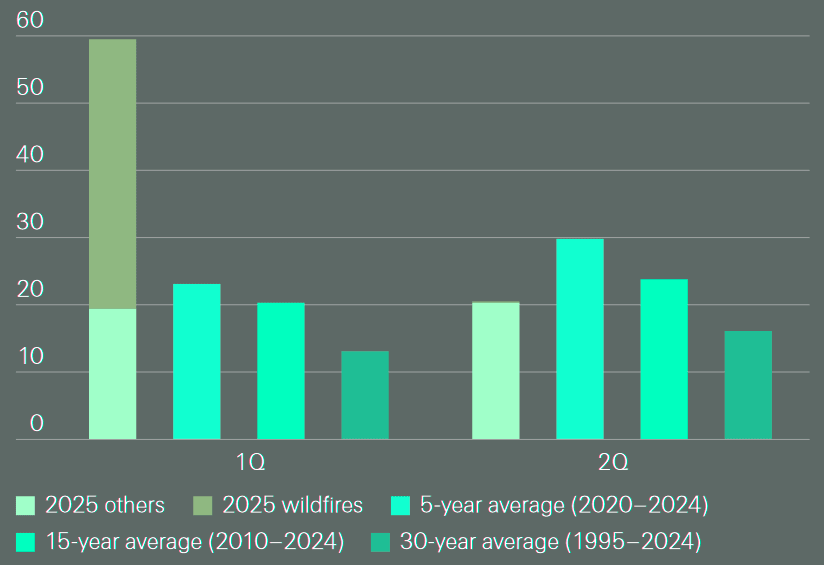
Most of the first-half losses came in January-March, mounting to more than double the first-quarter average of the previous five years.
Losses moderated to below historical average in the second quarter, but not enough to offset the severe first quarter outcome.
Total economic and insured losses in H1 2025 and H1 2024
| Losses | H1 2025 | H12024 | 10-y avg | % change vs 10-y avg |
| Economic losses, $ bn | 143 | 130 | 106 | 35% |
| Nat cat | 135 | 123 | 99 | 36% |
| Man-made | 8 | 8 | 7 | 14% |
| Insured losses, $ bn | 87 | 69 | 47 | 85% |
| Nat cat | 80 | 62 | 41 | 95% |
| Man-made | 7 | 7 | 6 | 17% |
Global insured losses from natural catastrophes in 1H
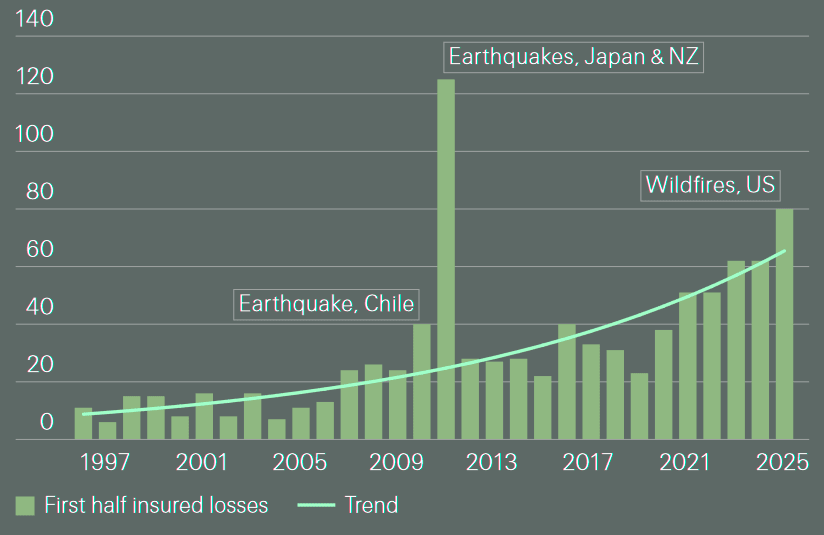
First-half insured losses of $80 bn would make for the industry’s second highest first-half loss tally ever after 2011, when earthquakes (EQ) in New Zealand (February) and Japan (March) triggered record high claims in the first six months of that year.
Global insured losses from natural catastrophes in 1Q and 2Q 2025 and previous years averages
It will also make 2025 the fifth in succession in which first-half insured losses have exceeded USD 50 billion. There were no other major insured loss-making events in the first half and absent the unseasonal LA County fires, global insured losses would have been well below trend.
With changing climates, unexpected and unseasonal weather conditions may occur more frequently, making loss outcomes more volatile and difficult to predict.
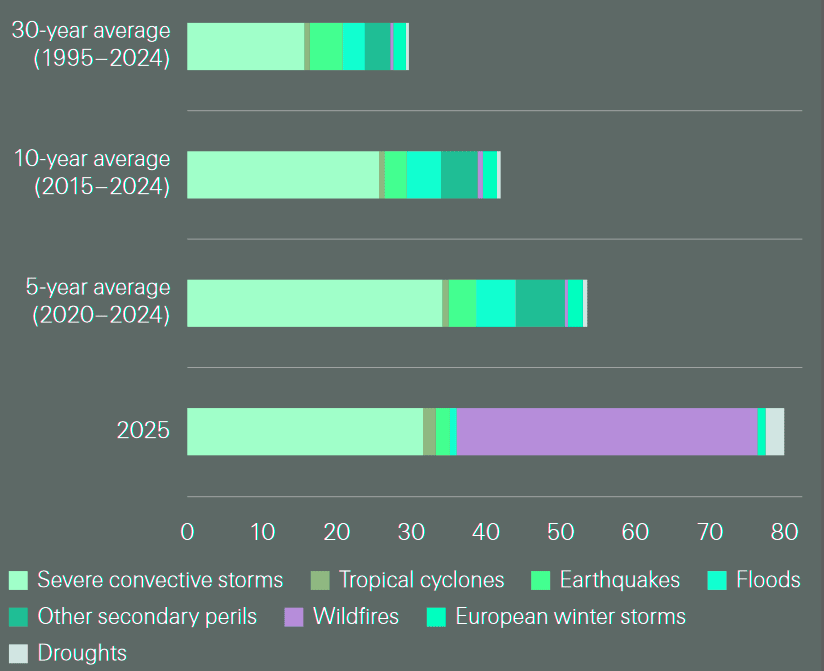
The Palisades and Eaton wildfires in LA County were the costliest events of the first half, resulting in combined insured losses of $40 bn (preliminary estimates).
That’s half of global first-half losses insured losses. For all other major perils, also severe convective storms (SCS), losses were instead mostly below the January-June average of the previous five years.
Global insured losses from natural catastrophes by peril in 1H 2025 and previous half-year averages
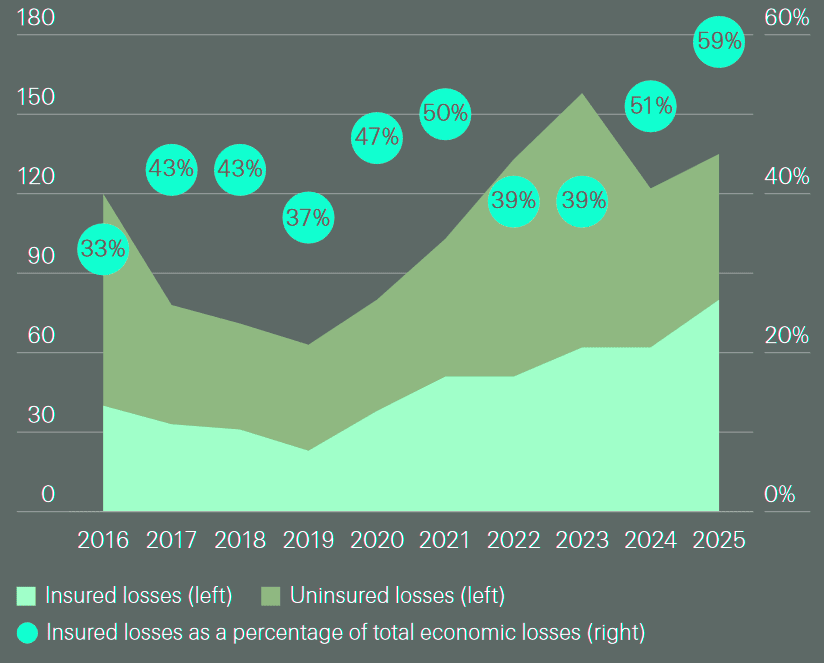
Economic losses from natural catastrophes in the first half of 2025 were $135 bn, of which insurance covered about 59%. That’s higher than the previous 10-year average of 42% and reflects that much of the damage caused by disasters was in US and other regions of relatively high insurance penetration, and also that wildfire is widely covered in personal property covers.
The LA County fires were not the only major disaster in the first half
Another catastrophe was the magnitude 7.7 earthquake that struck Myanmar in March, claiming around 3 900 human lives, more than any other disaster.
The quake struck densely populated regions of the country including Mandalay, its second largest city, and total economic losses are estimated to have been around $14 bn.
There is no information on insured losses but, with low insurance penetration, these will likely be low relative to regions of higher risk protection uptake. The shock waves from the earthquake were felt as far away as in India, China and Thailand. In Bangkok, the seismic shakes caused a high-rise building under construction to collapse, claiming more lives.
Global annual insured and uninsured losses fromnatural catastrophes in 1H 2025
Bangkok sits on a basin of soft sediment that acts like as amplifier, increasing the intensity and duration of shaking and making even far-off earthquakes feel intense. For this reason, even though far away from active faults, Bangkok is exposed to loss potential from seismic activity.
Preliminary estimates from the Thai General Insurance Association indicate insured losses in the country of $1.5 bn as a result of the earthquake.
With earthquakes, location and ground conditions matter as much as magnitude with respect to damage caused. Many cities around the world including Mexico City, Los Angeles, Beijing and Tokyo are built on sedimentary basins and face elevated seismic risk on account of potential for amplified ground motions.
Without proper building codes and adequate enforcement thereof, the increased shaking can cause severe structural damage and loss of life.
Modern seismic hazard assessment including localised effects is needed to accurately assess the resilience of buildings to ground shakes, and the stringency of building codes required. Strong building codes reduce damage but are not always rigorously enforced. Risk models must account for basin effects to avoid underestimating loss potential.
Non-seasonal wildfires account for half of the January-June losses
In January 2025, two major wildfires burned close to 40 000 acres in LA County and destroyed more than 16 000 structures in the Palisades and Eaton neighbourhoods.
A prolonged and dry Santa Ana wind with gusts reaching speeds of almost 100 mph, coupled with a lack of rainfall, created unseasonal and extreme fire-fuelling weather conditions.
The area affected by the Palisades fire contains some of the densest concentration of high-value single-family residential property in the US. The resulting fires covered locations of high exposure, leading to exceptional losses.
A very large number of structures were destroyed, more than 400% of the 5-year average, causing high losses in what was otherwise in terms of physical events an unremarkable fire season.
For instance, in year to 19 June 2025, the number of acres burned in the California and the number of fire outbreaks were just 5% and 38% of the respective 5-year averages.
Global annual insured losses from wildfires
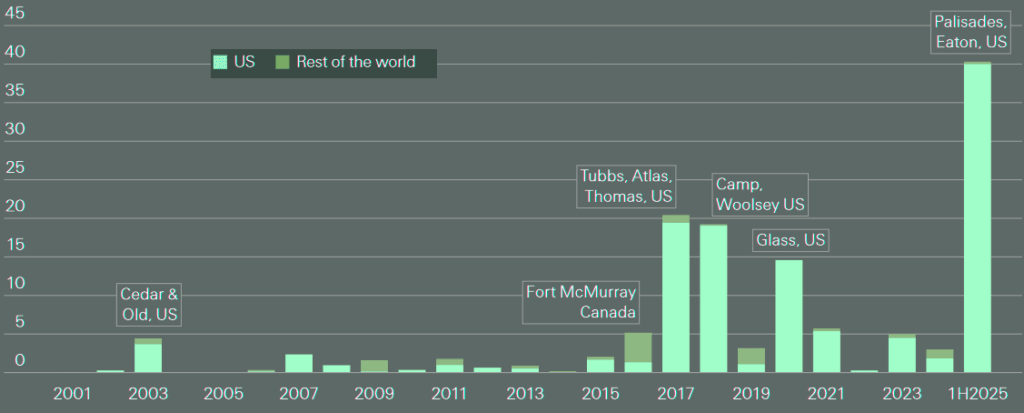
According to Swiss Re estimates, as of July 2025 combined insured losses from the Palisades and Eaton firestorm(s) were $40 bn, by far the largest global insured wildfire loss event(s) to date, and among the top 10 costliest natural catastrophe insured loss events of all perils on sigma records.
Total first-half insured losses for wildfire were the highest ever, surpassing even the previous full-year peaks for this peril by a significant margin.
Losses from wildfires have increased sharply over the past decade
Before 2015, wildfires accounted for roughly 1% of insured losses from all natural disasters globally. Over the last 10 years, this figure has climbed to 7%.
The most damaging periods were 2017–2018 and, to a lesser extent, 2020. After adjusting for inflation, 8 of the 10 most expensive wildfire-related insurance loss events have occurred in the past decade.
The rise in insured losses stems mainly from growing exposure in high-risk areas. Wildfires are common in dry, vegetation-rich regions, particularly in North America. The US—especially California—continues to dominate global wildfire-related insurance claims due to rapid development in high-risk zones.
Since 1990, exposure in wildland-urban interface (WUI) areas has grown 1.8 times faster than in non-WUI zones across the US, and 1.9 times faster in California.
In southern California, wildfires typically follow extended dry spells, often driven by strong, desiccating winds
While forest fires serve ecological functions—such as clearing decaying matter and enabling plant regeneration—they can become highly destructive when spreading into built environments. Suburban expansion into forest-adjacent zones significantly increases the risk of large-scale property damage.
Structures located near dense vegetation are more susceptible to ignition from nearby embers or direct flame contact. This pattern has increased the vulnerability of suburban communities. Furthermore, the spread of WUI development introduces more potential ignition sources, including utility infrastructure, equipment sparks, recreational fires, and deliberate acts.
The 2025 fires give the measure of the scale of devastation and loss potential when all ingredients for major conflagration come together:
- weather (drought and winds);
- dense urban or suburban environment;
- fuel (flammable structures and dry grassland that connects the structures, providing a pathway of fire).
There have been large wildfire-loss events outside of the US in recent years too, such as in Australia (as in 2019 and 2009), Canada (as in 2016), and also Europe (eg, Portugal in 2017), with all ingredients for urban conflagration present.
Droughts are becoming more frequent in Europe also, extending the wildfire season and exacerbating water shortages, which hinder firefighting efforts.
Severe convective storm losses remain high though below trend
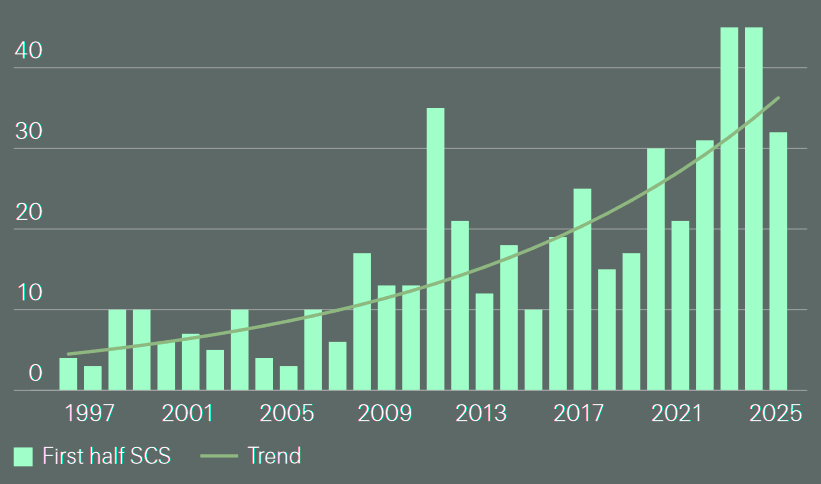
Between March and June, a number of severe thunderstorms with large hail and tornado outbreaks in the US led to global SCS-related insured losses of $31 bn in the first half of 2025.
Though below the trend estimate of $35 bn and also the first-half loss tallies for this peril in 2023 and 2024, those SCS losses are still the 4th costliest ever. Only a decade ago insured losses triggered by SCS were trending at around $20 bn.
Global insured losses from SCS in 1H
For example, in the US, construction costs rose by 35.64% from January 2020 to June 2025, directly impacting property claims costs.
There is also evidence that SCS activity has been increasing in specific regions and another factor contributing to losses is vulnerability of exposed assets.6 Like solar power systems on roof tops, the number of installations of which have risen rapidly, increasing exposure vulnerability.
Although SCS losses have so far been below trend in 2025, there is no reason to believe that they will not continue to rise over the long run.
Global insured losses from SCS in 1H and 2H, %
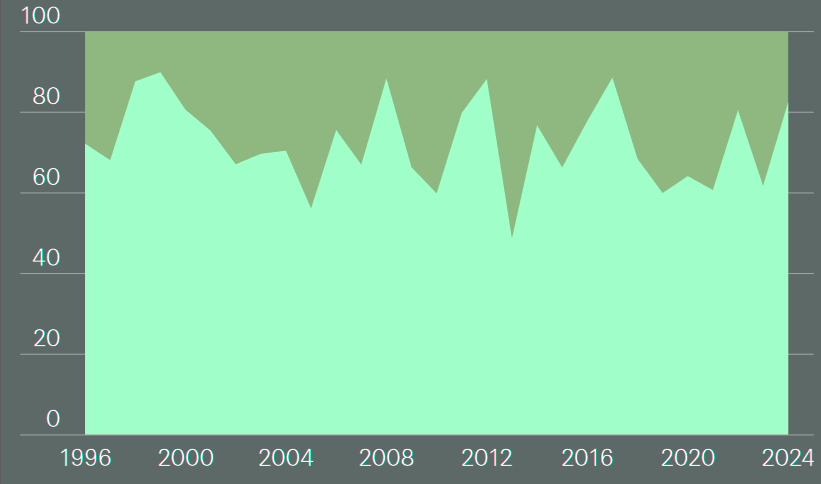
June marks the end of the peak of severe thunderstorm activity across the central US. On average at least 70% of the losses from this peril originate in the first half of the year and historically, first-half losses from SCS have never been below 50% of the full-year total.
That said, significant severe weather activity might continue through the year and large events can happen in the second half too, also outside of the US.
The US is particularly prone to SCS due to its geography, but large-scale cost events can happen in Europe too, as in the case of Italy in July 2023.
Lingering warming effects of a major heat dome
The second half of the year started with the lingering warming effects of a major heat dome that in late June brought temperatures in excess of 40°C in western and central Europe.
These led to wildfire outbreaks in many countries, also going into the second half. Meanwhile, torrential rains in the US led to catastrophic flash flooding in central Texas in July, another signal of what severe weather conditions could bring in the second half of the year.
With the US season for SCS past its peak, the focus for the second half shifts to the North Atlantic hurricane season (TCNA), the high point typically coming in early September.
Average global insured loss per year ($ bn), and share of losses (%), from natural catastrophes by quarter and peril
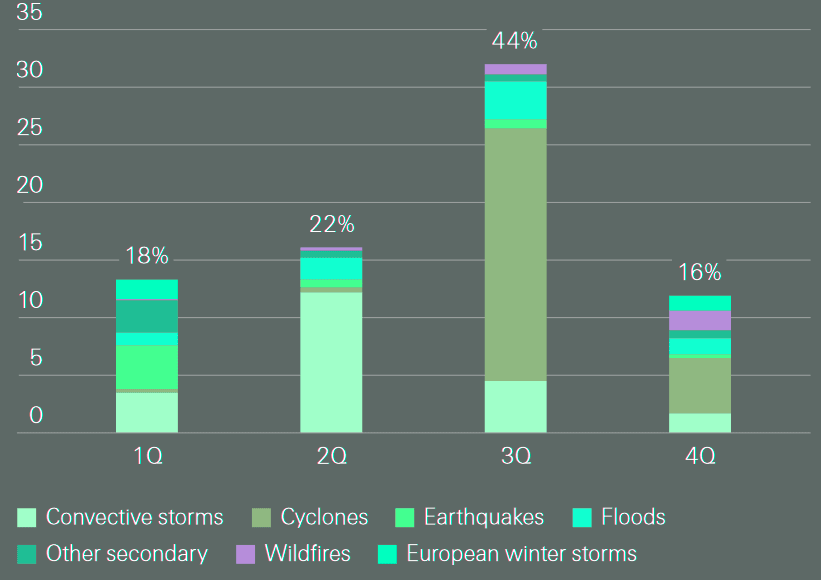
Historically, second-half year insured losses have been higher but also more volatile than in the first. In the past 30 years, 60% of the total natural catastrophe insured losses originated in the second half on average, mostly on account of costly TCNA activity in the third quarter (2004, 2005, 2008 and 2017 and 2022).
Global insured losses from natural catastrophes have been growing at a long-term trend rate of 5‒7% annually in real terms.
If this trend holds, we estimate that insured losses from natural disasters this year will approach $150 bn, in 2025 prices.
Our estimate of the first-half loss is past the mid-point of this outcome. With first-half insured losses above trend and catastrophe activity typically higher in the second half, total insured losses for the full year could exceed our projection.
Second-half losses can deviate from trend
Second-half losses can deviate from trend in any year depending foremost on the intensity of storms in the TCNA season. Latest meteorological forecasts predict near- to above-average activity in 2025, with three to five major (Saffir-Simpson Category 3 and above) hurricanes, compared to a long-term average (since 1950) of 3. Generally speaking, higher activity increases the chance of a severe hit.
However, for insurers (and exposed communities), the key factor determining the scale of losses is where a hurricane hits.
A storm that hits coastal locations with high value concentration can happen in any season, regardless of how much activity is predicted.
And it can take just one severe event to cause significant damage, as was the experience with Hurricane Andrew in 1992, a year of otherwise limited activity.
This year’s 20th anniversary of Hurricane Katrina serves as a further reminder that tropical cyclones, in particular major hurricanes, pose substantial risk to the east and Gulf Coasts of North America, as well as the Caribbean.
But that is not all that can lead to deviation from trend. There could be major losses from the full spectrum of perils, such as summer/autumn large scale floods across the world.
Current Mediterranean sea surface temperatures are 3°C above the historic average, the warmest on record. This could lead to higher-than-usual rainfall levels in autumn, potentially triggering large-scale floods. There may also be more wildfires in North America and in other regions.
FAQ
Insured losses reached $80 bn in H1 2025, nearly double the 10-year average and the second-highest first-half figure on record. This spike stems mainly from wildfires in Los Angeles County, which alone accounted for $40 bn. Preliminary estimates suggest total annual losses could exceed $150 bn due to continued risks in H2, particularly from hurricanes.
The Palisades and Eaton fires in January destroyed over 16,000 structures across nearly 40,000 acres. Unseasonal conditions, including strong Santa Ana winds and prolonged drought, drove extreme fire behavior. The area includes some of the US’s highest-value residential properties, creating outsized insured losses in a typically low-activity fire season.
Wildfires now account for around 7% of global insured natural catastrophe losses, up from 1% before 2015. Eight of the ten costliest insured wildfire events (adjusted for inflation) occurred in the past 10 years. Rapid development in high-risk zones, especially in California, is a key driver of this trend.
A 7.7 magnitude earthquake struck Myanmar in March, killing nearly 3,900 people and causing estimated economic losses of $14 bn. Insured losses were limited due to low insurance penetration. The quake also triggered structural failures in Bangkok, where preliminary insured losses stand at $1.5 bn.
From March to June, SCS events—including large hailstorms and tornadoes—generated $31 bn in insured losses, mostly in the US. While below the trend estimate of $35 bn, this still marks the 4th costliest SCS half-year. Increased vulnerability of rooftops (e.g. solar panels) and rising construction costs have amplified losses.
Historically, 60% of annual insured catastrophe losses occur in H2 due to peak Atlantic hurricane season. Forecasts indicate above-average tropical cyclone activity, including up to five major hurricanes. Even a single landfalling event in a densely populated coastal area could drive losses significantly above trend.
More frequent non-seasonal events—like January wildfires and March earthquakes—create greater uncertainty. Variables such as heat domes, sea surface temperatures, and regional development trends complicate loss forecasting. Swiss Re notes that adapting risk models to include urban density, land-use change, and infrastructure exposure is now critical.
…………………..
AUTHORS: Dr Thomas Holzheu – Chief Economist Americas at Swiss Re Institute, Dr Jerome Jean Haegeli – Head Swiss Re Institute and Swiss Re Group Chief Economist, Dr Chandan Banerjee, Lucia Bevere, Dr Shilpa Gahlot, Dr Mahesh H Puttaiah