Overview
Global reinsurance dedicated capital totaled USD 638 bn, a decline of 12%. When reported on an economic basis, solvency not only remained strong but in fact generally increased during the year, according to Gallagher Re Reinsurance Market Report.
The decline in reported Return on Equity (ROE) masks a notable improvement in underlying performance, to the point where the reinsurance industry’s underlying ROE exceeded its cost of capital for the first time since at least 2013.
Property reinsurance rates rose significantly at the January 2023 renewals. The losses from Hurricane Ian last year were a contributory factor, but signals for a market correction had already been mounting.
Demand for catastrophe-related insurance has risen on evidence of more peril activity since 2017. This is one factor behind today’s hard market in re/insurance. So too are the geopolitical and economic storms the world faces. In particular, fallout from the decade long zero-to-negative interest rate environment, the pandemic, and war in the Ukraine has included high inflation and rising costs in the construction sector in 2022.
This has increased the value of insured property assets and associated claims for damage caused by weather and other events. High inflation rates have also had financial market impacts given the need for central banks’ to hike policy rates rapidly (see How Global Reinsurance Market Endured a 2023 Renewals?).
Global INDEX reinsurance companies
Focusing on the INDEX reinsurance companies, which contribute more than 80% of the industry’s capital:
- The INDEX companies’ reported capital declined by 14% (though this was slightly offset by 2% growth in alternative capital) (see Reinsurance Rates for Property Catastrophe Forecast 2023).
- This drop is entirely explained by a decline in the value of investments across all major asset classes — equities, government bonds and corporate bonds.
- While rising interest rates depress the value of investments, they normally improve economic measures of capital and solvency, and this was indeed the case for most of the large European reinsurers where Solvency 2/Switzerland’s SST disclosure is available. Gallagher Re’s view is that most (re)insurers make decisions based more on economic views of capital than on accounting measures. In our view, the global reinsurance industry’s capital position remains robust.
- There was also a conspicuous absence of new capacity, despite the potential attraction of much-tightened pricing and terms and conditions.
- While capital, or ‘supply’, is healthy in our view, demand also increased sharply in 2022 FY, principally due to inflation.
According to Swiss Re sigma records, the re/insurance industry has experienced poor underwriting results following the step-up in natural catastrophe loss severity since 2017, new risk drivers and fallouts from the pandemic and war in Ukraine, including inflation raising the value of insured property assets.
The elevated natural catastrophe insured losses of the past six years reaffirm the 5‒7% uptrend in average annual losses established over the last 30 years.
The growth has been and will be largely driven by rising loss severity of individual catastrophes. This is the result of rising exposures that comes alongside economic development, urbanisation, and population growth, often in areas exposed to natural hazards.
According to Reinsurance Underwriting Results, underwriting cycle is characterised by periods of soft (falling/stable premium rates, coverage readily available) and hard (rising rates, cover less available) market conditions.
The driver is re/insurer competition, affected by claims trends, interest rates, industry capital and catastrophe losses. Swiss Re attribute most of the current step up in prices to uncertainty around claims trends and the effect of inflation and interest rates on industry capital and demand.
Risk appetite and alternative sources of capital affect overall capacity and the speed with which prices adjust to updated risk assessments.
Recent underwriting experience affects the supply of existing industry capital and also influences expectations of future profits, both of which affect capacity decisions.
Reinsurance dedicated capital
Global reinsurance capital declined by 12% in 2022 FY to USD 638 bn, similar to the 11% drop recorded in the first half of 2022.
The drop is entirely explained by a decline in the value of investments across all the major asset classes — equities, government bonds and corporate bonds.
Just over 80% of global reinsurance capital comes from the INDEX companies, among which capital declined by 14%. This was slightly offset by 2% growth in alternative capital, to USD 96 bn. The expansion of alternative capital was driven by net inflows and investment returns, which more than offset natural catastrophe losses and USD strengthening.
Total reinsurance dedicated capital (USD bn)
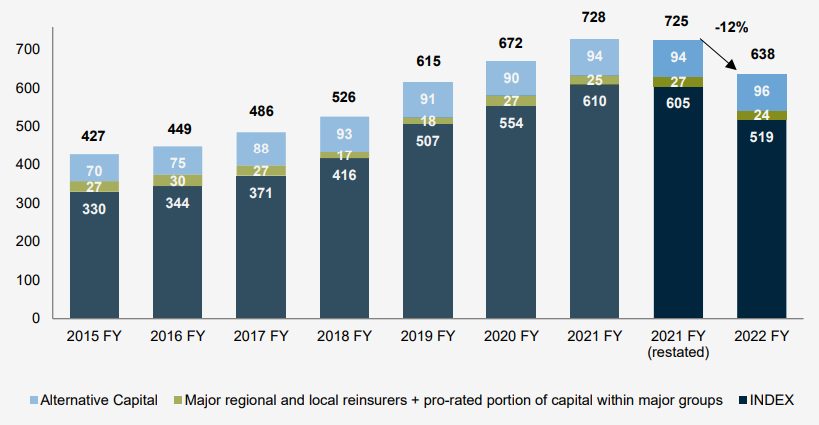
The first full-year drop in reinsurers’ accounting capital since at least 2015. Investment losses more than explain the drop in INDEX capital. We have re-stated year-end 2021 capital from USD 728 bn to USD 725 bn, following our annual review of constituents.
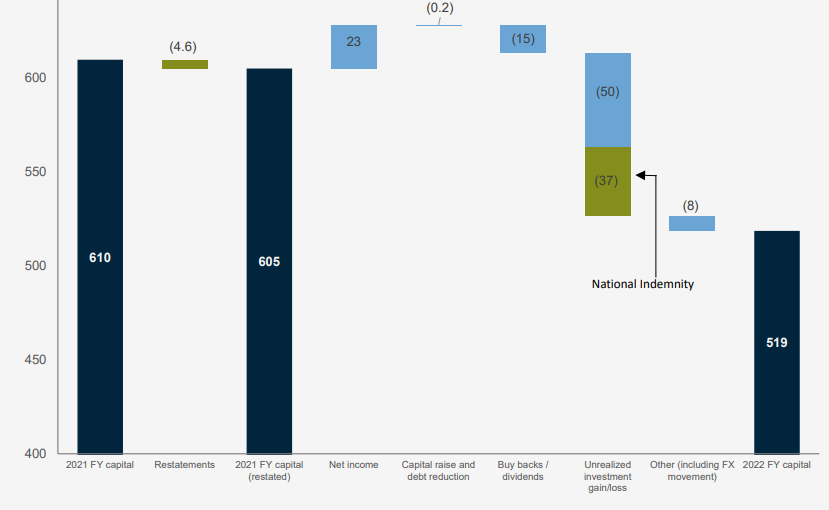
Capital analysis for the INDEX (USD bn)
While global reinsurance capital has dropped as measured on an accounting basis (US GAAP and IFRS), it is a very different picture when measured on an economic basis. While rising interest rates (and therefore falling bond prices) are a negative for accounting measures of capital, they are usually a positive for economic measures.9 This is the case for the EU’s Solvency 2 and Switzerland’s SST.
From 2023 IFRS is also changing to an economic basis, with IFRS 17 being implemented to replace IFRS 4.
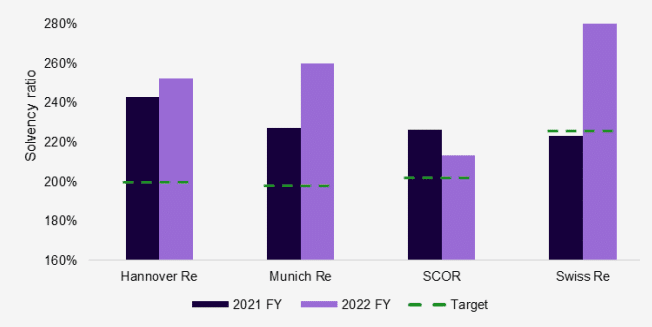
The EU’s Solvency 2 and Switzerland’s SST measures of regulatory solvency improved for three of the European big four reinsurers last year. SCOR’s Solvency 2 ratio, while declining slightly, remains comfortably above its target (see The Role of Insurance & Reinsurance in Minimizing Risks of the War`s Impacts).
Rating agency measures of capital fall between US GAAP and IFRS 4 on the one hand, and Solvency 2 and SST on the other.
European reinsurers solvency ratios
Generally, the agencies so far have taken a benign view of the impact of rising interest rates on reinsurers’ capital positions, provided they deem the reinsurer to have adequate liquidity and therefore not be a forced seller of securities at a loss.
Many (re)insurance management teams, in setting their capital key performance indicator (KPI), also adjust headline shareholders’ equity to strip out unrealized gains/losses.
Gallagher Re’s view is that economic views of capital are more relevant than pure unadjusted accounting measures and that they are more relevant for management decision-making at most (re)insurers. In our view, the global reinsurance industry’s capital position remains robust.
Global Reinsurers’ Underwriting Performance
Drilling further into profitability, for the SUBSET of companies within the INDEX that provide the relevant disclosure:
- Premium growth remained strong in 2022 FY at 12.3%, supported by rate increases and exposure growth.
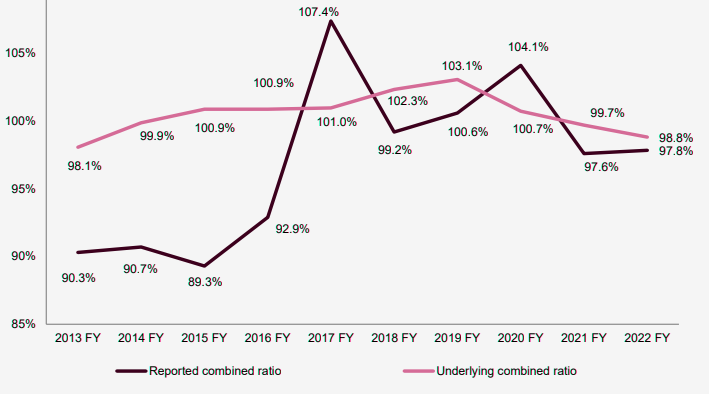
- The reported combined ratio was broadly stable at a healthy 97.8%. Within that, though, the ex-nat cat accident year loss ratio deteriorated by 2.0 percentage points as price increases failed to keep pace with claims inflation. This was offset by a lighter load of nat cat losses and an improved expense ratio. Prior year reserve development, which provided significant support for reported combined ratios in the past, has been more subdued over the past three years.
- On an underlying basis, the combined ratio improved for the third year in a row, from 99.7% to 98.8%, driven by the better expense ratio and a lower load of normalized natural catastrophes.
- The average ROE on a reported basis declined from 11.4% to 6.8% because of a reversal of investment gains (a strong tailwind in 2021 FY, a strong headwind in 2022 FY).
The underlying ROE has been steadily improving in recent years (2020 FY: 1.3%, 2021 FY: 6.3% and 2022 FY: 11.2%) to the point where underlying ROE now exceeds the industry’s cost of capital (see TOP 50 Largest Global Reinsurance Groups in the World).
This improvement has been driven by better underwriting results, stronger running investment income, and for 2022 FY, more operating leverage (i.e., a smaller denominator of shareholders’ equity).
Top 25 Reinsurers by Net Written Premium, $ mn
| Rank | Reinsurers | 2022FY | 2021FY |
| 1 | Munich Re | 66 710 | 65 254 |
| 2 | Swiss Re | 43 917 | 4 322 |
| 3 | Great West Lifeco | 40 573 | 42 124 |
| 4 | National Indemnity | 35 070 | 34 348 |
| 5 | Hannover Re | 31 489 | 29 384 |
| 6 | Fairfax | 22 272 | 18 278 |
| 7 | MAPFRE | 20 941 | 21 097 |
| 8 | QBE | 15 081 | 14 474 |
| 9 | RGA | 13 078 | 12 513 |
| 10 | Everest Re | 12 344 | 11 446 |
| 11 | Arch Capital | 11 077 | 9 018 |
| 12 | WR Berkley | 10 004 | 8 863 |
| 13 | Markel | 8 203 | 712 |
| 14 | Renaissance Re | 7 196 | 5 939 |
| 15 | Korean Re | 5 586 | 524 |
| 16 | Axis Capital | 5 263 | 4 927 |
| 17 | Transatlantic Re | 4 734 | 5 014 |
| 18 | Sirius Point Re | 2 549 | 1 735 |
| 19 | QIC | 2 150 | 2 336 |
| 20 | General Re | 2 078 | 4 974 |
| 21 | SCOR | 1 679 | 16 952 |
| 22 | RSUI Indemnity | 1 435 | 1 235 |
| 23 | Milli Re | 1 312 | 1 058 |
| 24 | WMIG Ark | 1 195 | 906 |
| 25 | Lancashire | 1 188 | 816 |
| Index aggregate | 382 235 | 368 268 | |
| Subset aggregate | 255 279 | 238 332 |
Top 40 Reinsurers by Total Capital, $ mn
| Rank | Reinsurer | 2022FY | 2021FY |
| 1 | National Indemnity | 207 276 | 239 470 |
| 2 | Munich Re | 27 733 | 40 942 |
| 3 | Great West Lifeco | 23 953 | 24 167 |
| 4 | Swiss Re | 20 520 | 31 389 |
| 5 | Fairfax | 20 336 | 21 316 |
| 6 | Pacific LifeCorp | 17 005 | 17 005 |
| 7 | China Re | 14 874 | 16 149 |
| 8 | Hannover Re | 13 331 | 17 893 |
| 9 | AXA XL | 13 139 | 13 139 |
| 10 | Markel | 13 128 | 14 718 |
| 11 | Arch Capital | 12 910 | 13 546 |
| 12 | General Re | 12 739 | 13 927 |
| 13 | QBE | 11 730 | 12 144 |
| 14 | MAPFRE | 10 673 | 12 270 |
| 15 | Everest Re | 8 659 | 10 363 |
| 16 | SCOR | 8 302 | 10 216 |
| 17 | Partner Re | 8 101 | 8 101 |
| 18 | WR Berkley | 7 777 | 7 675 |
| 19 | GIC India | 7 255 | 7 903 |
| 20 | RGA | 5 654 | 14 133 |
| 21 | Renaissance Re | 5 325 | 6 624 |
| 22 | Axis Capital | 5 061 | 5 831 |
| 23 | WMIG Ark | 4 119 | 3 891 |
| 24 | Transatlantic Re | 3 875 | 5 066 |
| 25 | Validus Re | 3 548 | 3 548 |
| 26 | CCR, France | 3 331 | 3 545 |
| 27 | Aspen | 2 775 | 2 775 |
| 28 | DEVK Re | 2 553 | 2 717 |
| 29 | QIC | 2 455 | 3 081 |
| 30 | Convex | 2 400 | 2 400 |
| 31 | Korean Re | 2 305 | 2 149 |
| 32 | R&V Versicherung | 2 298 | 2 445 |
| 33 | Sirius Point Re | 2 083 | 2 503 |
| 34 | Fidelis | 2 078 | 2 078 |
| 35 | Hamilton Re | 1 744 | 1 744 |
| 36 | Lancashire | 1 714 | 1 859 |
| 37 | Toa Re | 1 527 | 1 741 |
| 38 | RSUI Indemnity | 1 510 | 1 851 |
| 39 | Peak Re | 1 470 | 1 470 |
| 40 | African Re | 1 001 | 1 001 |
| Index aggregate | 518 638 | 605 088 | |
| Subset aggregate | 166 709 | 205 120 |
Top 25 Reinsurers by Income, $ mn
| Rank | Reinsurer | 2022FY | 2021FY |
| 1 | National Indemnity | 9 185 | 10 054 |
| 2 | Munich Re | 3 608 | 3 467 |
| 3 | Great West Lifeco | 2 473 | 2 495 |
| 4 | Hannover Re | 1 479 | 1 456 |
| 5 | Arch Capital | 1 436 | 2 093 |
| 6 | WR Berkley | 1 381 | 1 022 |
| 7 | Fairfax | 1 147 | 3 401 |
| 8 | WMIG Ark | 793 | -275 |
| 9 | QBE | 770 | 750 |
| 10 | MAPFRE | 675 | 905 |
| 11 | RGA | 623 | 617 |
| 12 | Everest Re | 597 | 1 379 |
| 13 | Swiss Re | 472 | 1 437 |
| 14 | General Re | 467 | 258 |
| 15 | Axis Capital | 193 | 588 |
| 16 | RSUI Indemnity | 143 | 191 |
| 17 | Korean Re | 136 | 155 |
| 18 | Milli Re | 52 | 55 |
| 19 | Lancashire | -3 | -62 |
| 20 | Transatlantic Re | -129 | 446 |
| 21 | QIC | -178 | 169 |
| 22 | Markel | -250 | 2 389 |
| 23 | SCOR | -316 | 539 |
| 24 | Sirius Point Re | -403 | 45 |
| 25 | Renaissance Re | -1 097 | -73 |
| Index aggregate | 23 253 | 335 |
Top 15 Reinsurers by Combined ratio, %
| Rank | Reinsurer | 2022FY | 2021FY |
| 1 | Milli Re | 144.1% | 136.0% |
| 2 | SCOR | 113.2% | 100.6% |
| 3 | Sirius Point Re | 105.6% | 116.3% |
| 4 | Swiss Re | 102.4% | 97.1% |
| 5 | Korean Re | 100.4% | 100.3% |
| 6 | Hannover Re | 99.8% | 97.7% |
| 7 | Axis Capital | 99.1% | 99.0% |
| 8 | MAPFRE | 98.0% | 97.5% |
| 9 | Renaissance Re | 97.7% | 102.1% |
| 10 | Lancashire | 97.7% | 107.3% |
| 11 | Everest Re | 96.4% | 98.1% |
| 12 | Munich Re | 96.2% | 99.6% |
| 13 | Fairfax | 94.7% | 95.0% |
| 14 | QBE | 94.2% | 93.7% |
| 15 | Arch Capital | 92.2% | 94.2% |
| Index aggregate | 98.6% | 98.0% | |
| Subset aggregate | 97.8% | 97.5% |
Global reinsurance market has faced a very late, complex and in many cases frustrating renewal 1/1 2023. As anticipated before negotiations commenced, the two areas of most constraint were peak-zone US property catastrophe capacity and coverage for strikes, riots & civil commotion and war. As renewals approached the end of the year, the market became more bifurcated.
The consequent environment at renewals led to the most acute, cyclical price increases since the 2001-2006 period, if not before.
Combined ratio for the SUBSET
Reported and underlying combined ratios remain sub-100%; underlying continues to improve. Reported combined ratio strong, despite higher ex-nat cat accident year loss ratio.
The normalized natural catastrophe load is the five-year moving average of the SUBSET’s natural catastrophe losses (excluding COVID-19 losses), calculated on the basis of annual results.
Reported and underlying combined ratio for the SUBSET
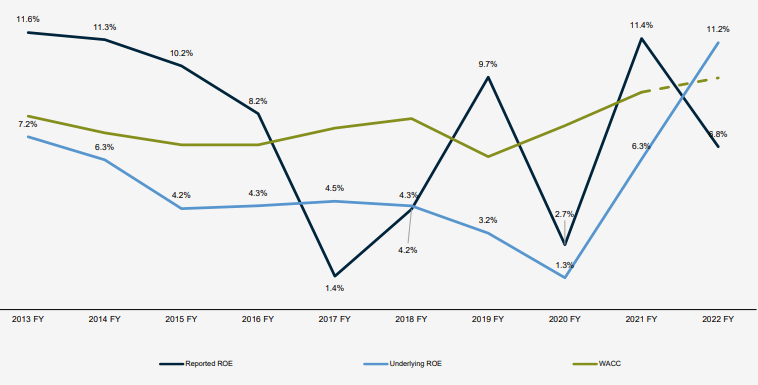
Underlying ROE for the SUBSET
Significant improvement in underlying ROE. Underlying ROE exceeds WACC for the first time in ten years.
S&P estimated WACC (weighted average cost of capital) figures. Underlying ROE excludes investment gains/losses for 2018 FY onward. 2022 FY WACC is Gallagher Re estimated, by taking the S&P WACC for 2022 HY and adjusting it for the change in risk-free rates.
ROE analysis for the SUBSET
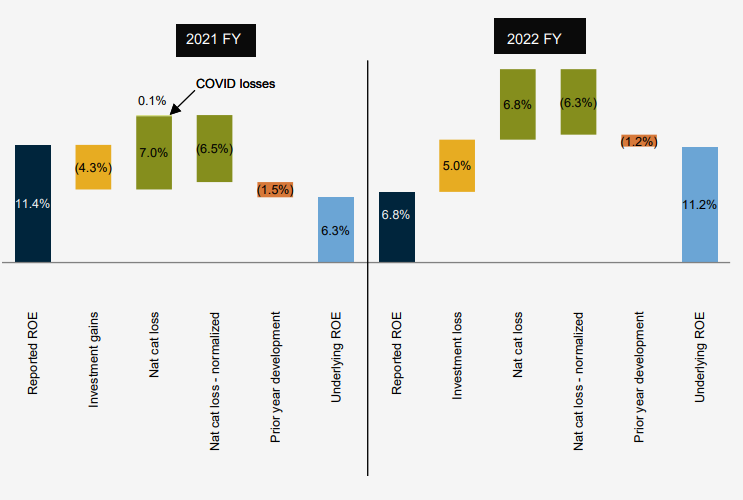
ROE for the SUBSET
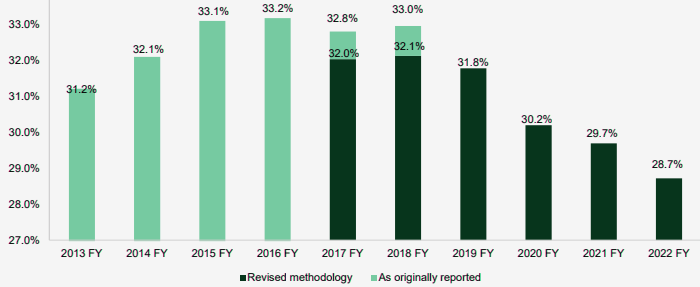
Expenses for the SUBSET
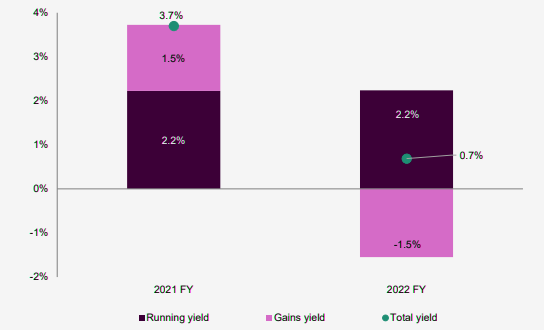
Expense ratio reduces further as premium growth exceeds expense growth. Investment income reduces due to negative gains yield; running yield stable. The revised methodology has introduced with report produced a discontinuity in our time series of SUBSET expense ratios.
Several of the companies removed from our constituent list, particularly Lloyd’s companies, have high expense ratios.
Therefore, revised methodology expense ratios for 2017 and 2018 are approximately one percentage point lower than the ratios we originally reported.
Weighted average expense ratio for the SUBSET
Investment yield for the SUBSET
Running yield captures items such as bond coupons, equity dividends and interest income.
One of the most talked-about features of the January renewals was the absence of new capacity, despite the potential attraction of much tightened pricing and terms and conditions. There was virtually nil equity raising and the balance of debt issuance/redemptions almost exactly netted to zero (-USD 0.2 bn). Moreover, no start-ups entered analysis, whether as an INDEX company or as a major regional or local market player.
The drop in overall INDEX capital was mirrored nearly across the board with the individual INDEX companies.
The reinsurers who saw the biggest drops in capital were the ones with the highest ratio of assets/equity and whose investment portfolios had the longest duration.
For example, the long-duration and asset-intensive life portfolio of RGA drove its significant drop in reported capital. As mentioned above, on an economic basis we would expect to see a very different, and potentially opposite. As noted, Hannover Re, Munich Re and Swiss Re also recorded improvements in their regulatory solvency position in 2022.
Only 4 reinsurers recorded an increase in capital. Milli Re led the way as a depreciation in the Turkish Lira led its non-Lira investments to increase in value when translated back into Lira.
Return of reinsurance capital
Return of capital stabilized in 2022, both as a percent of net earnings and of equity. The payout ratio as a percentage of earnings, by its nature, can be volatile given the variability of earnings.
Changes or trends in the payout as a percent of equity should therefore be more telling.
As a percent of equity, the payout hump over 2019–2020 is largely due to a single company — Berkshire’s National Indemnity. Excluding National Indemnity, the total payout declined slightly, from 5% in 2021 to 4.6%.
Return of capital (as a percent of opening shareholders’ equity) and payout ratio for the INDEX
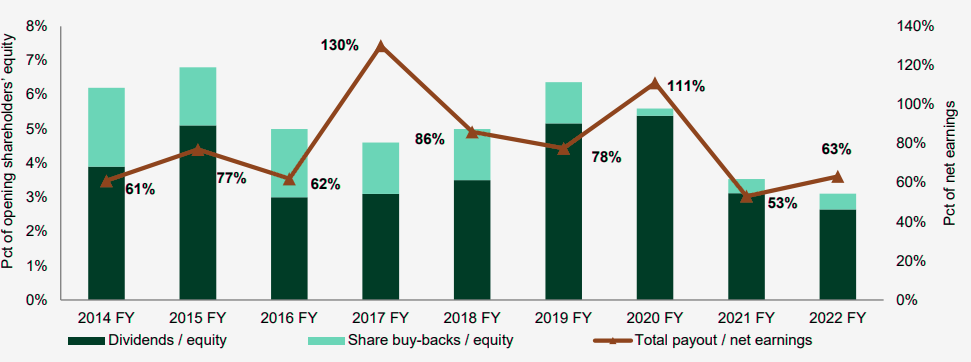
Notwithstanding the lack of capital raises to take advantage of firming reinsurance market conditions, this decline in payout was likely driven by reinsurers seeking to keep more deployable capital for the renewals.
Expense ratios
Expense ratio reduces further as premium growth exceeds expense.
The average expense ratio for the SUBSET further improved to 28.7%, continuing its downward trend since 2018 FY.
This improvement reflects strong premium growth which has exceeded the growth in absolute expenses. Premium growth in 2022 FY was 12% compared to growth in absolute expenses of 8%.
Lower expense ratios provide important support to combined ratios, particularly given the increased ex-nat cat accident year loss ratio and less support from reserve relea
Weighted average expense ratio for the SUBSET
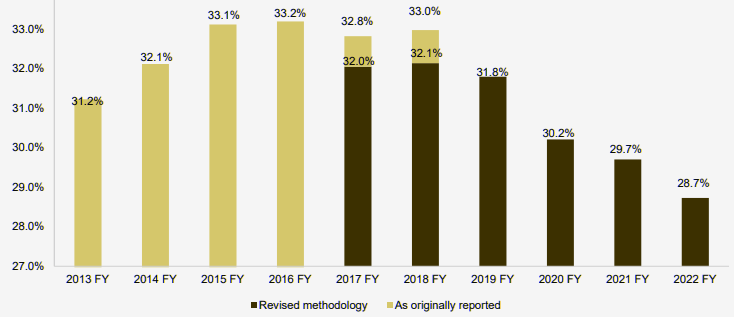
The revised methodology we introduced with our half-year 2019 report produced a discontinuity in our time series of SUBSET expense ratios. Several of the companies removed from our constituent list, particularly Lloyd’s companies, have high expense ratios. Therefore, our ‘revised methodology’ expense ratios for 2017 and 2018 are approximately one percentage point lower than the ratios we originally reported.
……………………
Edited & fact-checked by Oleg Parashchak – Editor-in-Chief Beinsure Media, CEO Finance Media Holding.