Overview
The past year and half have seen major changes in the global Reinsurance Property Catastrophe (CAT) market. In the recent reinsurance renewals we have seen robust price improvements, increased net retentions and much tighter terms and conditions, according to Swiss Re report “The State of the Reinsurance Cat market”.
The briefing below looks to provide valuable insights into the current trends in the reinsurance property CAT market and we hope it will be a useful resource to CFOs, reinsurance buyers and reinsurance brokers.
Backed with data from the Swiss Re Institute, we explored the state of the Reinsurance Property CAT market and found that:
- Insured losses exceeding USD 100bn p.a. globally are likely here to stay, and will grow further fuelled by economic value growth, urbanisation, and climate change.
- Insurers and reinsurers leveraged capital positions have rapidly unwound as the volume of alternative capital has declined.
- Balance between capital supply and increasing demand yet to find its footing.
- While the 2024 renewals have provided significant strides towards a new pricing equilibrium, investor trust in the reinsurance segment will be fully earned through delivery of sustainable economic returns.
- Strong partnerships and innovative reinsurance structures and solutions will be key to managing volatility and re-establishing financial results in line with market expectations.
Natural Catastrophe exposures on the rise due to economic growth
The latest sigma report from the Swiss Re Institute highlighted that global insured losses from natural disasters increased to USD125 billion. The fourth highest year for insured losses on sigma records, eclipsed only by the losses in 2005 (USD155 billion), 2011 (USD158 bn) and 2017 (173bn).
Annual variability of the annual losses is considerable, while an underlying growth trend is obvious. Commentators now opine that the expected annual catastrophe insured loss burden in a ‘normal’ year is likely to be in the triple digit billions of dollars.
This is supported by the sigma findings, which highlight that in the five-year period from 2017 to 2022 the average annual insured losses stood at USD110bn.
Insured Natural Catastrophe losses
USD bn
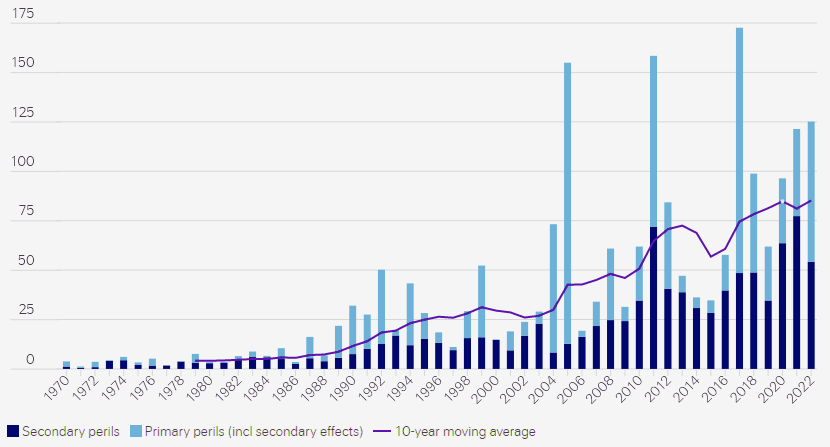
The catastrophic losses of 2017 looked like a one-off outlier at the time, flattered by a benign period from 2012 to 2016, but another five years of data reveals a clear trend of increasing losses returning to a normal growth pattern of insured losses.
Observed over three decades, the growth rate net of inflation amounts to 5-7% per annum, or close to doubling every 10 years.
There is no reason to expect this trend to revert, even more so if economic inflation and climate change provide additional fuel.
The sigma research also finds that rather than the physical destructive force of natural catastrophes themselves, the main drivers of resulting high losses are economic growth, accumulation of asset values in exposed areas, urbanisation and rising populations, often in regions susceptible to natural perils.
The sigma data also illustrates how insured losses seem to rise faster than the number of events, which is significantly changing the loss patterns, also affecting the exposure of risk transfer instruments like CatXL.
Severity and frequency of NatCat events
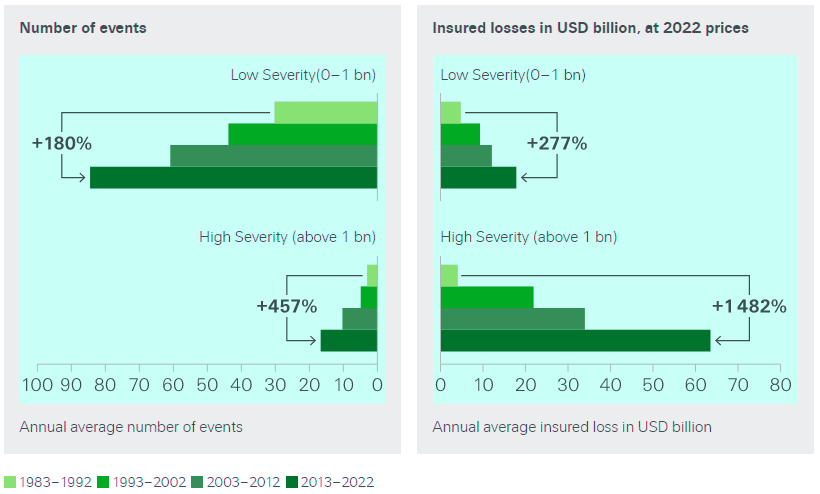
The magnitude of climate change impact on the growth of natural catastrophes in frequency and severity is not explicitly quantifiable yet, whereas property value growth and urbanisation are reasonably understood risk drivers.
For example, we see two diametrically opposed influences where people and property values move into harm’s way. Globally, but most notably in the developing world, we see more and more people moving from rural areas to concentrated urban areas.
This is illustrated by the development of 33 mega-cities across the globe of which 26 are in developing countries as will be nine of the 10 megacities that will be created by 2030.
Next to their sheer size, most megacities develop around a historical core of cities close to waterways, coastal or riverine – ingredients towards wind, storm surge and river flood exposure.
Conversely, in the developed world, we see more and more people living in the urban-bush interface and coastal areas, such as in Australia and the U.S., areas that are more vulnerable to dangers from wildfires and severe flooding.
A striking example of the potential risks accompanied by people settling in regions more exposed to extreme weather events was last year’s Hurricane Ian. Here, the storm hit an area that has seen rapid population growth, expansion of built areas and accumulation of physical assets.
Changes in buil-up land in the Ian landfall area growth statistics
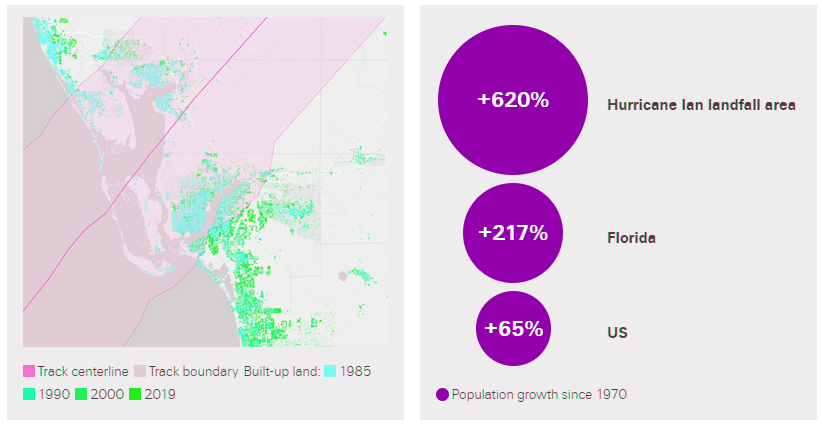
Some had predicted that Ian would make landfall in the Tampa Bay area – had that been the case the insured loss would likely have far exceeded the estimated range of USD50-65 billion.
The experience isn’t likely to be a one off and is reminiscent of Hurricane Andrew in 1992, which missed Miami by just 20 miles.
Next to economic value growth and urbanisation, the inflation spike post the Covid-19 outbreak further added fuel to nominal growth of insured losses.
Since the start of the pandemic, all property insurance exposures – the nominal value of buildings, motor vehicles, and other fixed assets that insurers cover – have grown faster than headline inflation and real GDP growth.
The fastest rising prices have been in sectors such as construction and vehicle sales, directly impacting claims costs in some of the largest lines of insurance.
The good news in this growing risk landscape is the fact the industry has built strong and robust risk assessment and pricing tools, in particular for peak risks in the industry like Hurricane in the North Atlantic.
The past six years have clearly highlighted the potential of these less well monitored perils for surprises in severity, like winter storm Uri in 2021 with well above USD 10bn of insured losses, as well as in the frequency dimension, where severe convective storms are regularly contributing 25% and more of the annual insured losses.
This is a call for more disciplined uses of modelling assets for a broader set of perils, and with complete and up-to-date exposure data along the value chain.
A leveraged marketplace to alternative capital
Over the last two decades, low interest rates have contributed to an increase in financial markets risk appetite, with an increasing share of the capital to support catastrophe risk sourced from alternative capital markets, in the form of cat bonds and other insurance linked securities.
The balance sheets of reinsurers, by extension, have become increasingly leveraged to other sources of capital than their own equity and debt, creating a vulnerability to short term capital flows.
In effect, the reinsurance market for catastrophic business went from being a self-supported funding model to one that is heavily reliant on continued availability of external capital leverage (see Global Reinsurance Capital in 2023). The barriers to exit of this alternative capital are also much lower than if you are running your own balance sheet.
Much of this alternative capital came online during 2011 to 2016, which was a very benign natural catastrophe period. This leveraged capital then stayed constant after 2017 until the recent renewals in 2023.
Reinsurance capital vs price cycle 1994-2022
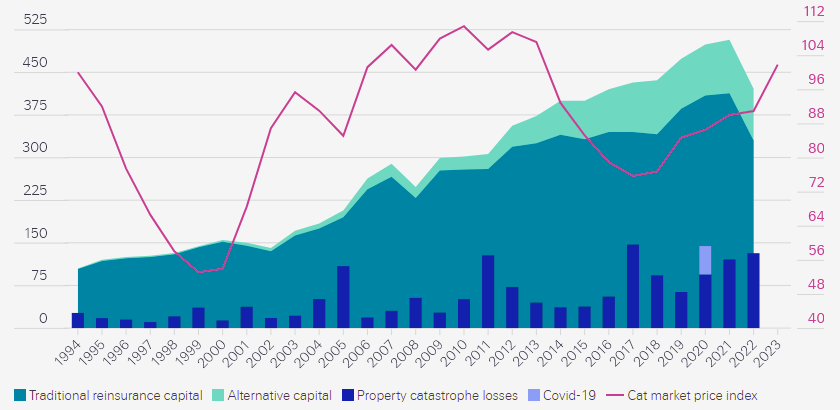
Risk and return – a perfect storm for capacity
With more risk and more exposure to leveraged capital from outside of their own balance sheets, reinsurers retained earnings have been insufficient to bear their cost of capital, let alone build stronger balance sheets to cater for an increasing risk landscape.
Since 2017, the re/insurance industry has paid out USD 650 billion (in 2022 prices) for weather-related natural catastrophes claims.
However, premium income has not kept pace with events or exposure growth – whether proxied by GDP or more targeted measures – the result being steadily declining profits. Natural catastrophe losses affect industry capacity directly; while making societies financially more resilient, the payments to policyholders reduce profitability and capital supply.
They also have indirect impact as re/insurers and investors update risk assessments. Perceptions about whether risks are priced adequately is key in determining the supply of capital and capacity available for underwriting.
The historically elevated catastrophe and claims activity since 2017 has created doubts on the part of re/insurers and investors, which slowed the capital supply response.
Profitability of insurers vs reinsurers
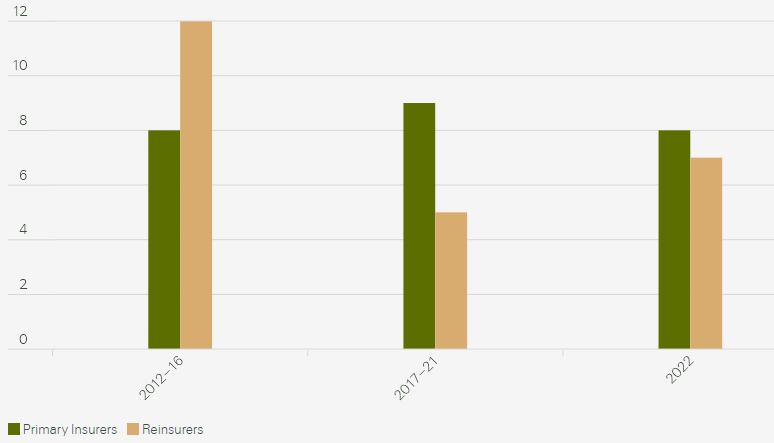
Leveraged positions unwind in the face of record secondary peril losses
Over the period of 2017 to 2022 we’ve seen a significant increase in the frequency and severity of losses coming from so-called secondary perils or weather-related catastrophes.
Surging secondary perils have created losses to the re/insurance industry that were very different to what traditional industry loss models had predicted.
Uncertainties around modelling discipline and the adequacy of premium levels to deal with increasing loss costs and emerging secondary perils have also led to reduced risk appetite on the part of providers of capital.
At the same time as the emergence of secondary perils, the reinsurance market was in a protracted soft market due to historically good results.
This allowed primary insurers to become heavily leveraged to very low attaching levels of reinsurance protection. And, as the balance of risk, and therefore claims, shifted between insurer and reinsurer it meant that the insurance market was more and more leveraged to the reinsurance market, which, in turn, was leveraged to the capital markets.
This came to a head at the beginning of this decade, as reinsurers have also been forced to absorb several systemic and macro-economic risks that had not been adequately priced.
This began with Covid-19, and the related infectious disease business interruption losses, and was rapidly succeeded by the impacts of the Ukraine war, both on insured losses, but also as a key driver of an inflation shock which still has us in its grasp. Swiss Re economists expect higher inflation to persist for 2023 and beyond.
The outlook for the property cat market
With inflation starting to moderate, but expected to remain elevated for some time to come, continued revaluation of insured assets is expected to continue to drive increased demand for catastrophe reinsurance.
At the same time bruised investor appetite is unlikely to recover fully until catastrophe underwriters are again able to demonstrate a consistent track record of returns commensurate with the riskiness of our business and which outperform other assets classes.
To put the increase in demand for catastrophe reinsurance into perspective, we think there is approximately USD 200 billion of demand from the U.S.
With the risk drivers of climate change, demographic change and inflation remaining unchanged we expect that demand will see an increase of 10-15% between 2023 and 2024.
Swiss Re and the reinsurance industry generally are starting to see this demand coming through from personal lines insurers as sums insured are being updated to match the true rate of inflation.
Swiss Re expect to see significant revaluation coming from the commercial lines carriers, a development that will create fresh demand.
This will be further compounded by our expectation of the industry taking a more disciplined approach towards under-declared assets or lagging ITV adjustments, by adhering more strongly to average or margin clauses and other instruments refining re/insurance contracts.
Both the inflation spike, as well as a soft market, had strongly reduced the industry discipline to deal with such factors in contract wordings.
…………………..
AUTHORS: Mohit Pande – Chief Underwriting Officer, Property, P&C Reinsurance at Swiss Re, Mike Mitchell – Senior Underwriting Advisor, P&C Reinsurance at Swiss Re