Overview
IAIS collected data on the global reinsurance market through annual Global Reinsurance Market Survey covered Top 50 reinsurers based in 9 jurisdictions: Bermuda, France, Germany, Japan, Luxembourg, Spain, Switzerland, the UK and the US. The participating reinsurers remained largely consistent throughout those years.
The survey captured data from reinsurers with gross unaffiliated reinsurance premiums of more than $800 mn or unaffiliated gross technical provisions of more than $2 bn.
The IAIS continued the annual reinsurance data collection using the SWM reinsurance component as part of the Global Insurance Market Report.
Reinsurance data collection
Reinsurance data was provided by 22 jurisdictions from the following regions:
- Asia and Oceania: Australia; China; China, Hong Kong; Chinese Taipei; Japan; Malaysia and Singapore;
- Europe and Africa: Croatia, France, Germany, Luxembourg, the Netherlands, Portugal, Spain, South Africa, Switzerland and the UK; and
- Americas: Bermuda, Brazil, Canada, Mexico and the US.
The SWM reinsurance component collects aggregate jurisdictional reinsurance data that cover all reinsurance entities in a jurisdiction on a solo entity level, as is the case in the other components of the SWM.
For some jurisdictions, the component includes reinsurance data of primary insurers who conduct reinsurance activity, if this reinsurance activity can be separated from the primary insurance activity.
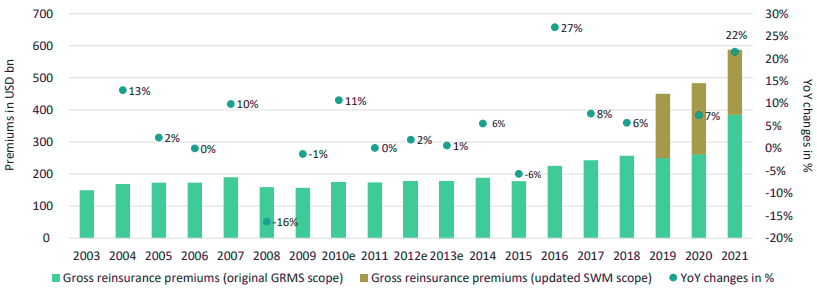
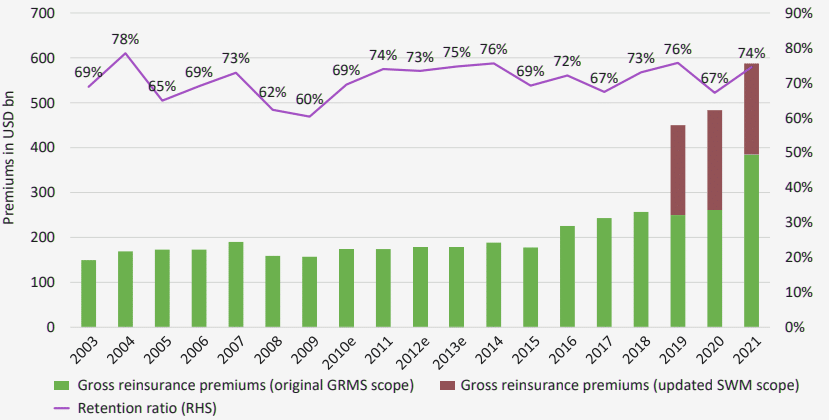
According to Reinsurance Market Dynamics, reported gross reinsurance premiums increased by more than 20%. This is substantially more than the growth of the global insurance market (covering both primary and reinsurance markets), which is reported at 8% (see Commercial Insurance and Reinsurance Market Outlook).
Gross reinsurance premiums
Net reinsurance premiums
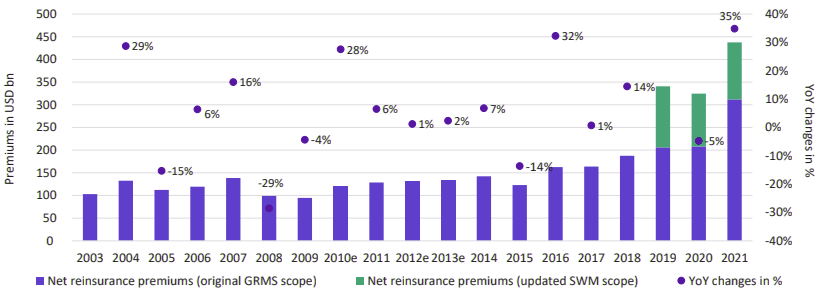
The decrease in net reinsurance premiums was driven by the Americas region. The strong growth in net and gross premiums in 2021 is explained by a combination of developments in the Americas, Europe and Africa.
As mentioned above, the data collection scope was adjusted and included more than 30 new UK (re)insurers. However, even if these new UK (re)insurers are excluded, gross reinsurance premiums increased by 16% and net premiums by 34% relative to the previous year, so the impact on net premiums was not significant.
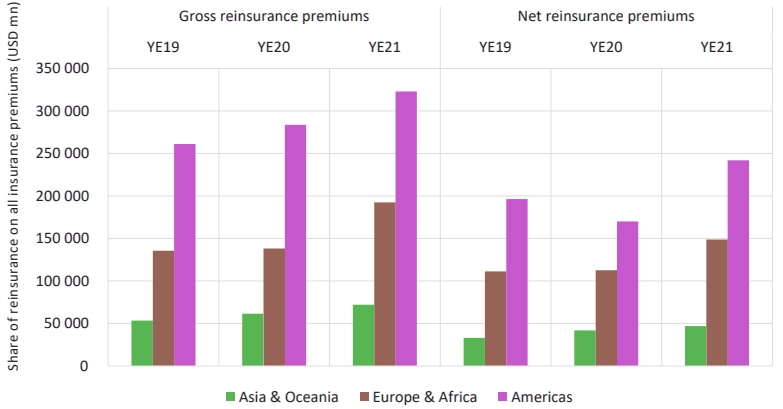
Regional view on net and gross reinsurance premiums
The IAIS also monitors the amount of retrocession taking place in the reinsurance market.
Retrocession is a contract between a retrocession provider (the reinsurer) and an original reinsurer (the reinsured) that assumed premiums in a contract with a primary insurer (the insured)
According to Beinsure Global Reinsurance Market, retrocession is placed to provide additional capacity to the original reinsurer or to reduce the original reinsurer’s risk of loss. Globally, approximately 32% of all gross reinsurance premiums originate from retrocession contracts, based on the SWM data.
There are material differences in the reported usage of retrocession across regions:
- Asia and Oceania: 9.4%
- Europe and Africa: 14.2%
- Americas: 47.2%
The IAIS also monitors the size of the global reinsurance market as a share of the total global insurance market.
For the purpose of this monitoring, the global insurance market estimate covers both primary (direct) and secondary (reinsurance) premiums, whereas the reinsurance market is a subset of the global insurance market (capturing the secondary premiums only).
Reinsurance Market – a Hardest Market for Last 30 Years. The global gross insurance market covered by the SWM data was approximately $7.28 trillion, with approximately 45% located in the Americas. The size of the global gross reinsurance market covered by the SWM was approximately $588 billion, with approximately 55% located in the Americas.
Share of reinsurance market on the global insurance market
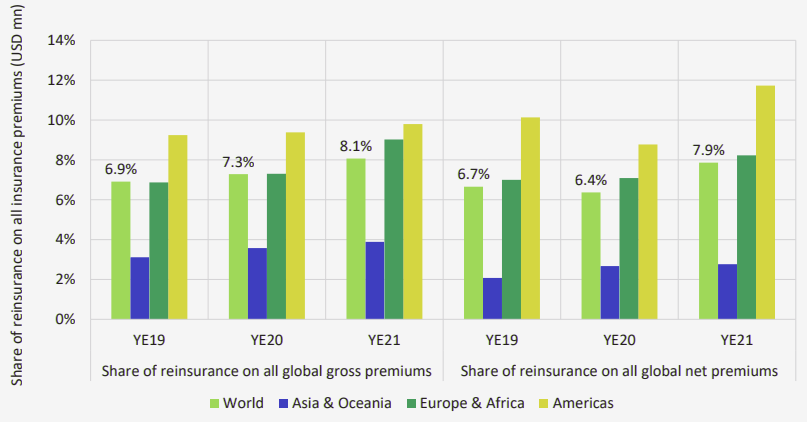
The usage of reinsurance differed across regions, with the lowest levels reported in Asia and Oceania (4% of gross premiums) and the highest levels reported in the Americas (10% of gross premiums) (see about Bermuda Reinsurance Market).
The reinsurance market grew substantially quicker than the global insurance market in terms of gross premiums in 2022 (21.5% compared to 8%).
The global net insurance market covered by the SWM was approximately $5.57 trillion. The size of the global net reinsurance market covered by the SWM was approximately $438 billion. In total, reinsurance accounted for about 8% of all global net insurance premiums covered by the SWM.
Reinsurance premiums: life & non-life sectors
Retention ratios indicate the percentage of gross premiums that is not reinsured or retroceded and forms the ratio of net premiums to gross premiums (see How Global Reinsurance Market Endured a Renewals?).
Reinsurance retention ratios were comparable for the reinsurance market and the overall insurance market (74.5% for reinsurance compared to 76.4% for direct insurance).
The highest reinsurance retention ratios were reported in Europe and Africa. Reinsurance retention ratios indicate the extent of retrocession, which represents secondary reinsurance (when a reinsurer buys insurance). The 2022 increase was mainly driven by retention increases in North America.
Reinsurance retention ratios
IAIS data shows the structure of reinsurance gross written premiums over the last 10 years. Non-life premiums account for more than 60% of all reinsurance gross premiums, based on the SWM data.
Composition of gross reinsurance premiums
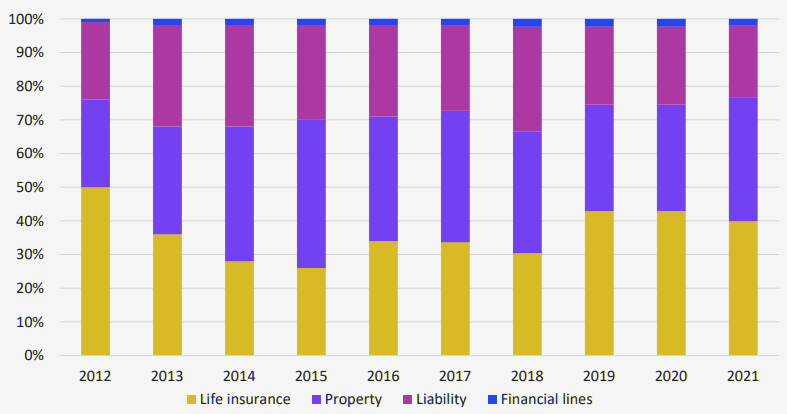
The share of life reinsurance premiums as reported in the SWM has been stable over the last three years. No significant jurisdictional developments for life reinsurance were identified.
Regional distribution of the reinsurance market
Jurisdictional distribution
IAIS shows the jurisdictional distribution of reinsurance gross premiums in the last three years. Based on the SWM data collection, the five largest reinsurance markets are the US, Bermuda, Germany, the UK and Switzerland.
However, the IAIS notes that the different reporting approaches applied in different jurisdictions (ie sample of companies approach compared to full population approach) may limit the comparability (eg the US, Germany, Switzerland, Japan, France, Luxembourg and Spain did not report the full population of their reinsurance markets, whereas other jurisdictions did).
Share of global reinsurance gross premiums
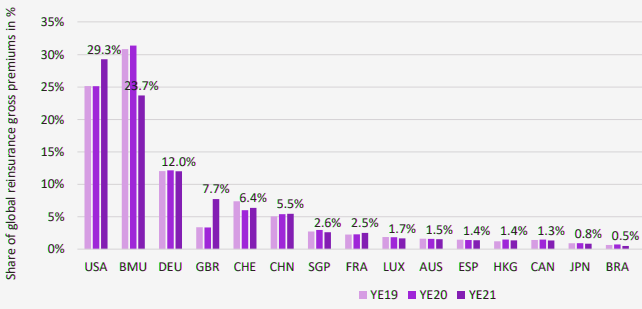
A significant increase in US market share in 2021 was driven by increases in non-life and life premiums assumed in the US rather than any change in reporting scope. These increases are explained by the Covid-19 pandemic and its related effects.
Share of reinsurance net premiumsby jurisdiction
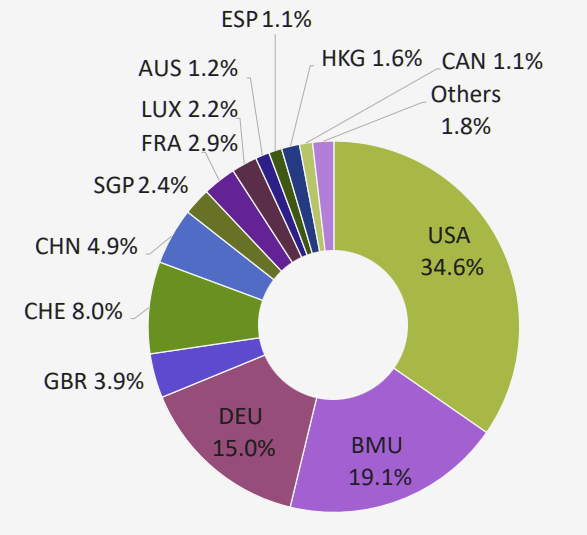
The US represents the largest reinsurance market, covering more than one third of all global net reinsurance premiums, based on TOP 30 Reinsurance Companies in the United States. Bermuda, Germany, Switzerland and China complete the top five, based on net premiums.
Regional premium transfers
The North America region accounted for the majority of reported gross reinsurance premiums. The grey bars relate to the change in scope of the data collection when some jurisdictions provided limited information on the origins of reinsurance premiums (see Reinsurance Rates Movements & Pricing Trends).
The North America region accounts for more than 45% of the global reinsurance market, followed by the European region that accounts for more than 20% of the global reinsurance market.
More information was available and, currently, the IAIS has insight into the origins of about 87% of assumed reinsurance premiums.
Gross reinsurance premiums by region of ceding entity
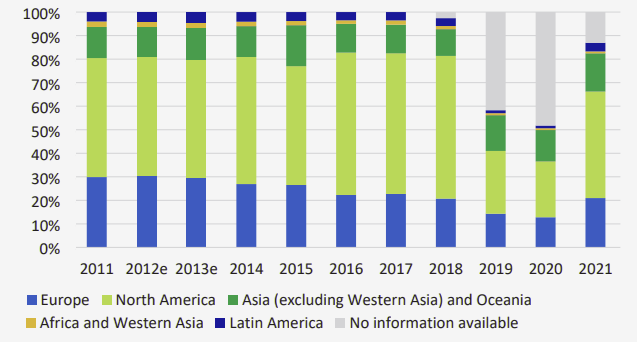
Based on the data, the North America region accounts for more than 45% of the global reinsurance market, followed by the European region that accounts for more than 20% of the global reinsurance market.
Reinsurance premium region of origin
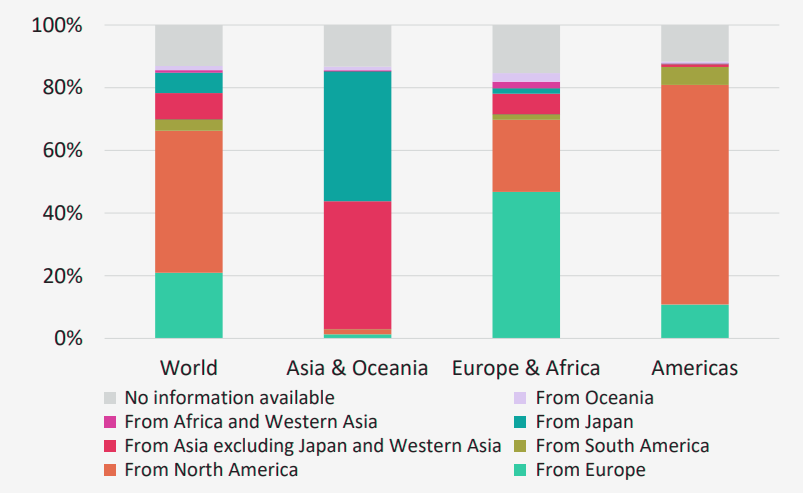
Figure shows the reinsurance risk transfers between regions, namely the origins and destinations of premiums by region. The grey bars indicate the percentage of premiums for which there is limited information available.
A majority of premiums assumed in the Americas was assumed from either North or South America. For Asia and Oceania, limited cross-regional transfers are observed, as a vast majority of premiums was assumed from the same region.
Reinsurers in Europe and Africa reported the highest degree of cross-regional activity, with approximately 50% of intra-regional premiums.
Reinsurance premium region of destination
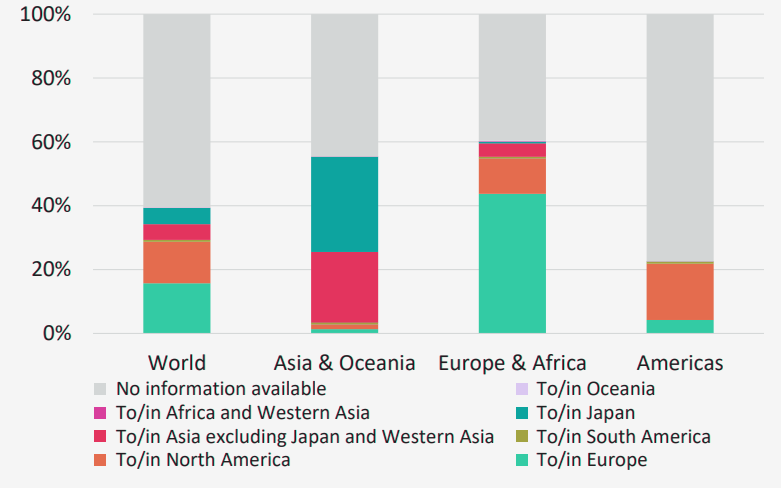
The information provided on the origins of premiums substantially improved in 2022. The data collection shows that there is limited information available on the destinations of premiums. The IAIS will continue to make refinements in the SWM 2023 data collection.
Reinsurance asset allocation
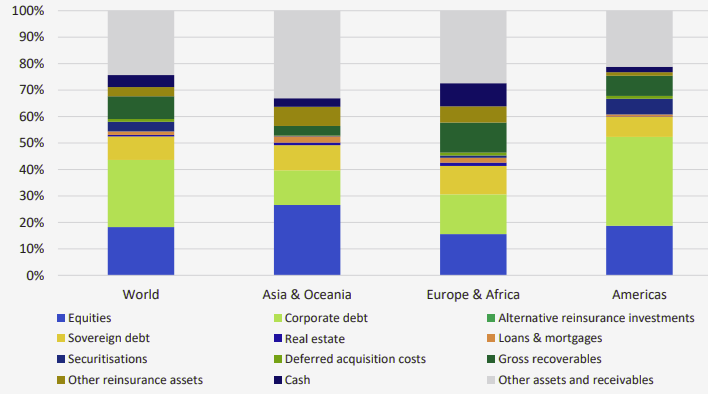
IAIS data illustrates the split of reinsurers’ asset allocations, by region, as reported in the SWM 2022. The distribution is roughly similar across regions. Key asset classes are equities and corporate bonds in all regions. The largest relative shares of sovereign debt securities are held in the Europe and Africa region. Reinsurers hold limited investments in L&M and real estate.
In comparison to the overall insurance market, the following main differences were identified, based on SWM reporting:
- Higher shares of equities (18% compared to 11%);
- Lower shares of sovereign debt (9% compared to 20%);
- Lower shares of L&M (1% compared to 6%); and
- Higher shares of recoverables (9% compared to 4%).
The main changes were identified:
- Slightly higher shares of securitisations in reinsurance (by 4%);
- Slightly higher shares of sovereign debt in reinsurance (by 2%); and
- Increase of other assets in the Europe and Africa region (by 22%).
Asset allocation reinsurance sector
Reinsurance solvency and capital
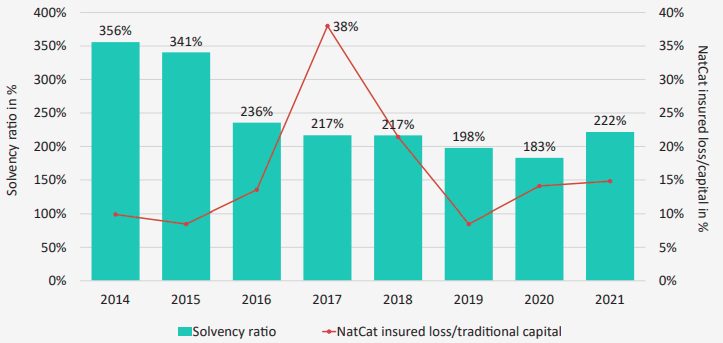
The data shows that the average reinsurance solvency ratios have been well above 100% since 2014. The decline in reinsurance solvency ratios in 2019–2020 was consistent with a decline in the general insurance sector solvency ratios over the same period.
The increase in the overall reinsurance solvency ratio in 2022 is aligned with developments in the overall insurance sector.
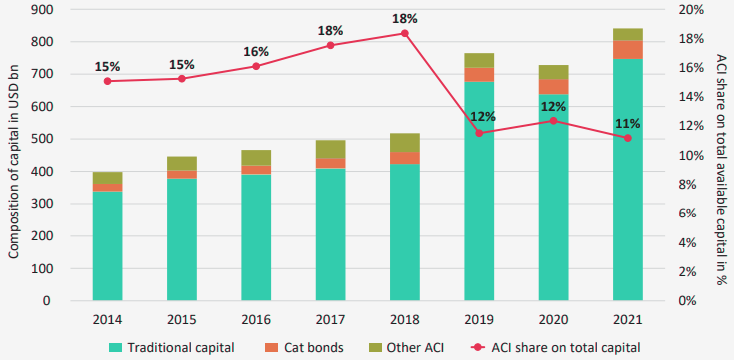
The figure also compares total available capital resources (excluding alternative capital instruments (ACIs)) with NatCat claims since 2014. For NatCat developments, data on insured losses were utilised from the Swiss Re Sigma database.
The data shows that even in 2017, which saw the highest amount of NatCat claims in the last eight years (due to three major F4/ F5 category hurricanes – Harvey, Maria and Irma), the claims reached a maximum of 38% of the total amount of traditional capital instruments (excluding any ACIs).
Reinsurance solvency ratios and interplay with NatCat claims
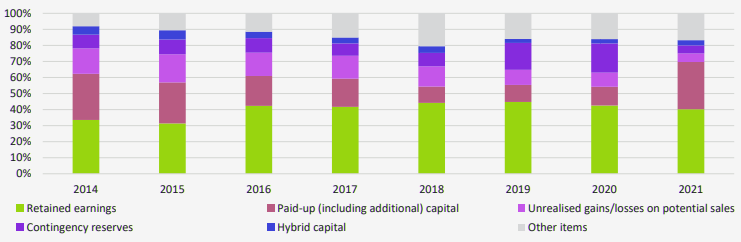
The changes were mainly driven by a decreasing share of paid-up capital, whereas retained earnings and hybrid capital remained stable overall. Retained earnings remains the main source of available capital.
Two major capital-related developments were identified: a significant increase in paid-up capital (including additional paid-up capital) of reinsurance companies and a material decrease in contingency reserves.
The growing amounts of paid-up capital were the main driver of the improving reinsurance solvency ratio.
Composition of reinsurance capital resources
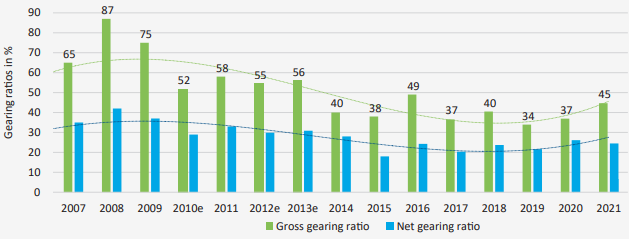
Reinsurance gearing ratios
Alternative capital instruments
In addition to traditional capital instruments, various ACIs are used in the reinsurance sector to strengthen the capital positions of reinsurers and to transfer (part of) the risk to capital markets.
The ACI category includes various insurance-linked securities that can be broadly defined as financial instruments where values are driven by insurance loss events.
Reinsurance ACIs include, for example:
- Issued catastrophe bonds (Cat bonds);
- Organised or owned sidecars;
- Issued industry loss warranties;
- Issued or organised collateralised reinsurance.
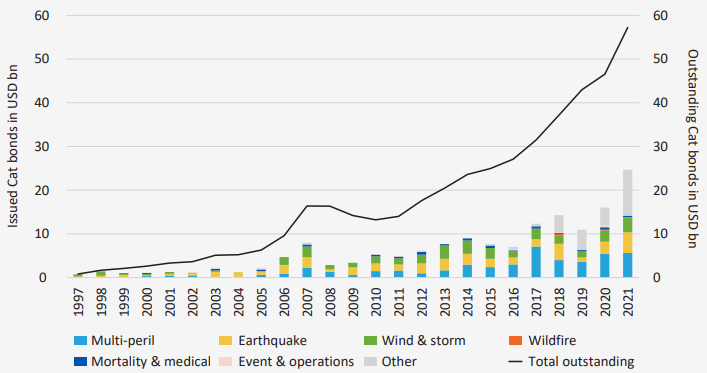
According to Catastrophe Bond & ILS Market Review, the data shows the growing size of the Cat bond market since 1997. The main covered perils are mortgage, wind and storm, and earthquake. The materiality of the Cat bond market is approximately 6% to 8% of traditional capital instruments (since 2014).
Issued and outstanding Cat bonds
At year-end 2022, ACI represents 11% to 12% of all available capital resources (ie combining traditional capital instruments such as paid-up capital or retained earnings with ACIs such as Cat bonds or sidecars).
Traditional and alternative capital instruments
The decrease in this ratio between 2018 and 2019 was caused by the change in the reporting sample. Cat bonds are one of the main forms of ACIs. Collateralised reinsurance is reported to be the biggest class of ACIs.
Natural catastrophes and reinsurance coverage
Reinsurance market developments are closely linked to natural catastrophes and their (re)insurance, in particular by sharing the burden of heavy NatCat claims (see Global Reinsurance Capital Challenge in Natural Catastrophe).
Reinsurance market analysis shows that the largest losses from natural catastrophes in 2021 were attributed to Hurricane Ida in North America in August and Storm Bernd in Europe in July.
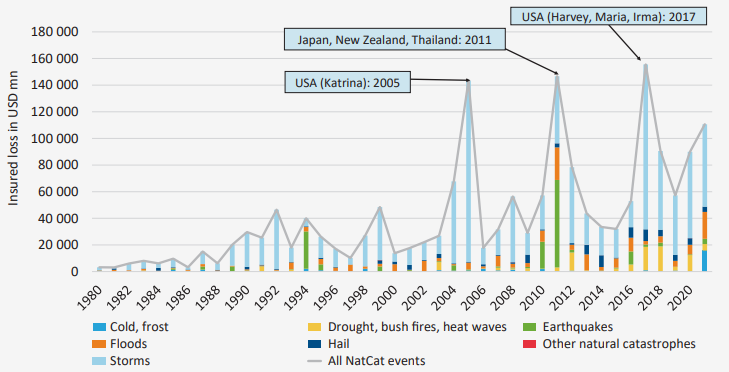
The data shows NatCat developments calculated as insured losses 53 and structured by perils. A growing trend is observed in these claims, with a few peak years.
The three peaks represent the three most expensive years for (re)insurers:
- 2005: Hurricane Katrina in the United States;
- 2011: Severe tsunami in Japan, New Zealand earthquakes and flooding in Thailand; and
- 2017: Hurricanes Harvey, Maria and Irma in in the United States.
NatCat developments: Insured losses
NatCat developments: Total economic losses
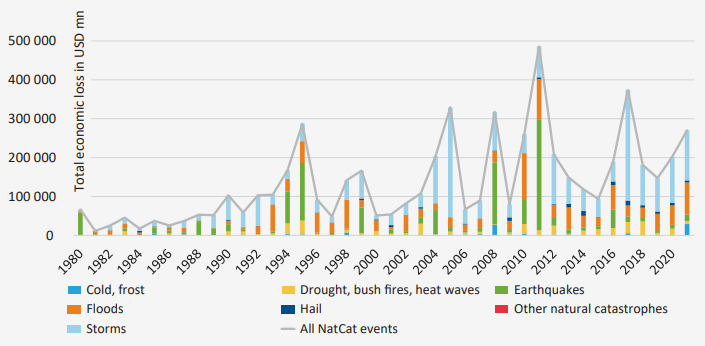
The majority of losses were caused by storm events, in particular in North America and Asia. The second most costly peril was flooding, especially in Asia and Europe. In the history of (re)insurance markets, 2021 was the fourth most expensive year following the three years mentioned above.
NatCat developments: Total economic losses by regions
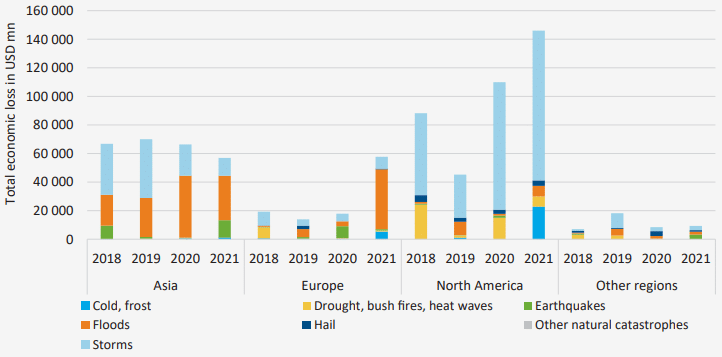
In North America, Hurricane Ida in August caused the largest global insured loss from a single event in 2021, with a cost of $37 billion.
In Europe, Storm Bernd caused around $13 billion in insured losses, mainly in Germany and Belgium. In Asia, total losses were somewhat lower than previous years, as, in contrast to the typical typhoon season, no typhoons made landfall in Japan.
Reinsurance profitability
Combined ratios remain below 100%, indicating profitable underwriting. The highest combined ratio was in 2005, driven by Hurricane Katrina in the US, which caused losses of $82 billion. The second highest was in 2011, driven by the severe tsunami in Japan and flooding in Thailand.
Non-life reinsurance combined ratios
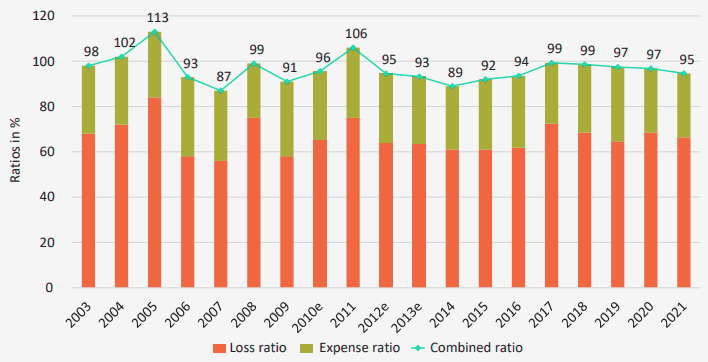
Combined ratios remain below 100% at year-end 2021, indicating profitable underwriting as net earned premiums exceed incurred claims and expenses
Reinsurance revenues on assets
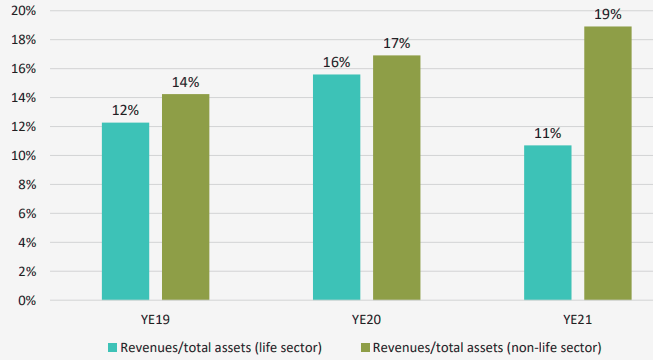
The data shows that for both life and non-life reinsurance, the ratio of revenues to total assets reported in the SWM is between 11% and 19%, with some regional differences and higher levels for the non-life reinsurance sector. Non-life reinsurance sector profitability has grown over the last two years.
………………
AUTHOR: Victoria Saporta – Chair of the Executive Committee of the International Association of Insurance Supervisors and Executive Director, Prudential Regulation Authority (PRA) and the Bank of England
Edited by Oleg Parashchak – CEO Finance Media, Editor-in-Chief Beinsure Media