Overview
Global reinsurance groups reported a significant improvement in underwriting profitability and ROEs in 2023, which supported an increase in their capital base to the highest level, according to Gallagher Re’s Reinsurance Market Report for full-year 2023.
Underlying ROEs were materially higher due to a further reduction in underlying combined ratios and higher recurring investment income. Whether viewed on a headline or underlying basis, reinsurers’ ROEs now comfortably exceed the industry’s cost of capital.
Given recent rate increases and reinvestment rates, it is likely that reinsurers’ underlying ROEs will continue to trend upwards and remain meaningfully above the cost of capital.
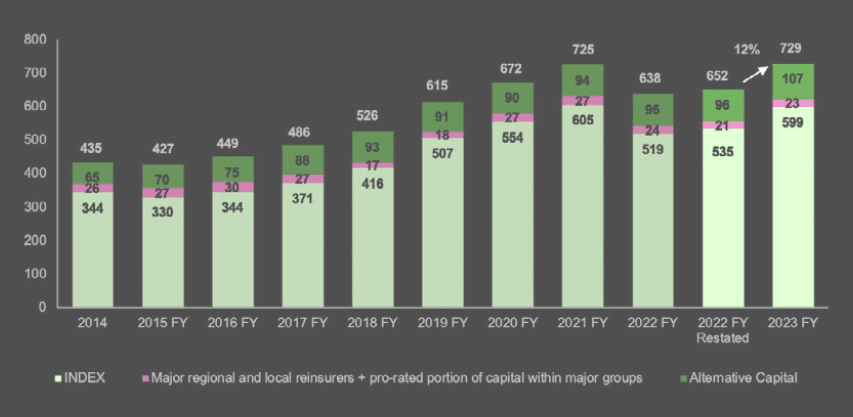
Global reinsurance dedicated capital totalled USD729 billion at full-year 2023, a rise of 12% versus the restated full year 2022 base. Growth was driven by both the INDEX3 companies and non-life alternative capital.

Key findings from Reinsurance report
- Gallagher Re’s in-depth analysis of a subset of 16 reinsurers shows the reported combined ratio improved to 88.9% (2022 FY: 94.6%). The underlying combined ratio also continued to improve, to 96% (2022 FY: 98.5%).
- The reported ROE rose strongly in 2023 FY, from 7.1% to 20.2%, largely spurred by a higher investment gains yield and a lower impact from natural catastrophes.
- Following exceptionally strong profitability in 2023, reinsurers have now fully recouped for weaker profits in 2017-2020.
- The underlying ROE was up materially to 14.3% (2022 FY: 12.0%), supported by improved underlying underwriting margins and higher running investment income.
- Whether viewed on a headline or underlying basis, reinsurers’ ROEs comfortably exceed the industry’s cost of capital.
Focusing on the INDEX companies, which contribute more than 80% of the industry’s capital:
- INDEX capital was up 12% to USD599B driven principally by higher net income. This was also supported by unrealized investment appreciation, just over three quarters of which was attributable to National Indemnity whose significant US equity holdings rose in value during the year.
- The global reinsurance industry’s capital position remains strong on an economic basis, which Gallagher Re views as the measure most relevant for management teams’ decision making. Average solvency for the top four European reinsurers was 261%, up from 255% at 2022 FY (see 2024 Global Reinsurance Rate for Property). Moreover, capital growth, or ‘supply’, in 2023 outpaced two measures of demand.
Reinsurance dedicated capital rises
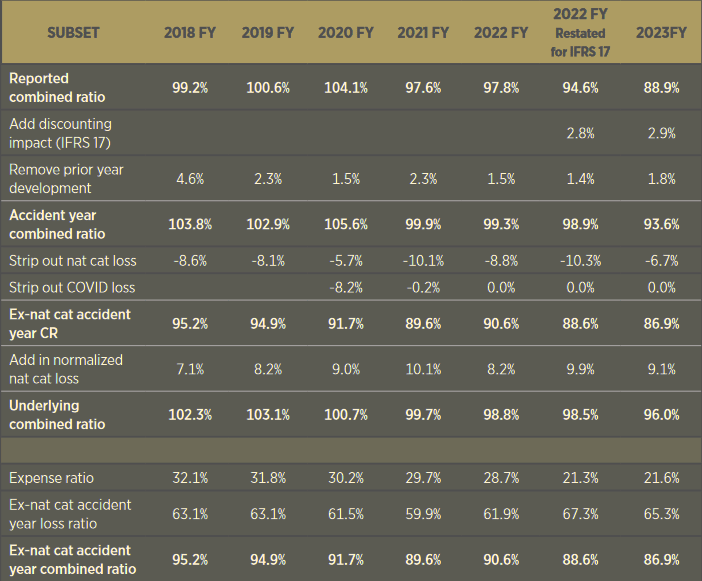
The reported combined ratio reduced 5.7 percentage points (ppts) to 88.9% in 2023 FY (2022 FY: 94.6%, restated for IFRS 17), despite a moderate increase in the expense ratio, thanks to a lower impact from natural catastrophes (-3.5ppts), a 2.0 ppts reduction in the current-year attritional loss ratio and slightly increasing reserve releases. The favorable impact from discounting remained stable (see how Fitch Ratings Revised Global Reinsurance Sector Forecasts).
The better natural catastrophe experience of the reinsurers stands in sharp contrast to overall insured natural catastrophe losses, which Gallagher Re estimates remain elevated at USD123B5 in 2023.
SUBSET companies have carried a reduced proportion of these losses over the last three years, from 9.2% in 2021 FY, to 8.0% in 2022 FY and 7.3% in 2023 FY. This reflects higher attachment points and the nature of 2023 catastrophe losses which were dominated by so-called “secondary” perils rather than by landfalling US hurricanes.
On an underlying basis, the combined ratio continued its downward trend, from 98.5% to 96.0%. This is the strongest level achieved since the launch of the Reinsurance Market Report in 2014 and was primarily driven by a lower current-year attritional loss ratio and normalized natural catastrophe load.
A number of companies have indicated extra conservatism in their current-year loss picks, which suggests that true underlying profitability could be even better.
Reported and underlying ROEs
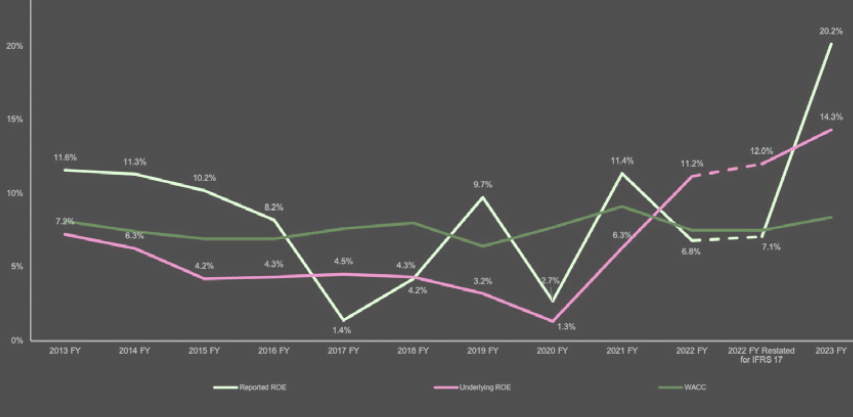
The reported ROE rose strongly in 2023 FY, from 7.1% to 20.2%, largely spurred by a higher investment gains yield and a lower impact from natural catastrophes. Following exceptionally strong profitability in 2023, the SUBSET group has now fully recouped for weaker profit years such as 2017-2020.
On a cumulative basis, the SUBSET has generated an ROE above the weighted average cost of capital (WACC) for the 2017-2023 period.
Underlying ROE was up materially, from 12% in 2022 FY to 14.3% in 2023 FY.
Underlying underwriting margins and running investment income notably rose and so following an elongated period of sub-par returns, underlying ROE continues to exceed the cost of capital for the second consecutive year.
Reported and underlying combined ratios reduced markedly
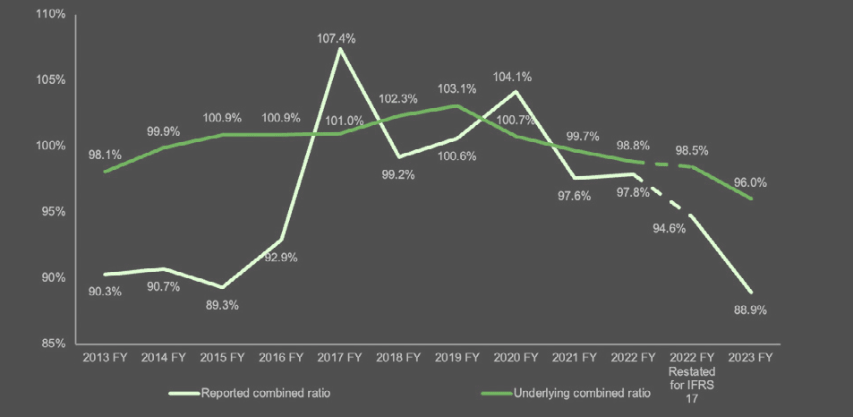
Reported combined ratio
Combined ratio lower, driven by reduction in both natural catastrophe and attritional losses.
IFRS 17 impact
- IFRS 17 came into force on January 1, 2023 and represents a fundamental change to insurance accounting, compared to IFRS 4. In essence, IFRS 17 is designed to provide a more economic view of profit and capital and ensure a more truthful recognition of profit emergence from insurance contracts.
- While the US and most Bermudian reinsurers in our study continue to report on a US GAAP basis, all the other reinsurers aside from Swiss Re now report according to IFRS 17.
- IFRS 17 does not address widely used metrics such as combined ratios or ROEs, leaving it open for companies to set their own definitions, and resulting in significant inconsistencies in reporting. There are also material differences vs US GAAP.
Insurance revenue, a measure close to gross earned premiums but net of ceding commissions, becomes the top line item in the income statement, replacing gross written premiums.
Fixed ceding commissions are no longer recognized within expenses, resulting in a significant reduction in the expense ratio for reinsurers.
The other implication from this is that the natural catastrophe loss ratio increases, due to the use of net insurance revenue instead of net earned premiums in the denominator.
In addition, expenses that are not directly attributable to insurance activities are stripped out of the insurance service result (IFRS 17’s underwriting profit), meaning that expense ratios are materially lower.
Under IFRS 17, claims are discounted at prevalent rates, thereby resulting in a lower, more volatile claims ratio.
The discount rate is unwound in subsequent years, but outside of the underwriting profit. As a result, as interest rates have risen sharply since 2022, companies are currently benefitting from a significant boost to profit.
In order to ensure like-for-like comparison across time and reporting standards, we have addressed the IFRS 17 challenge directly, reflecting the new disclosures and adapting the Reinsurance Market Report to the new standard.
2022 FY data has been restated throughout the report to reflect the impact of IFRS 17. Equally, our underlying ROE and combined ratio metrics have been updated to neutralize the effect of discounting, while the normalized nat cat loss ratio has been adjusted to neutralize the effect of different accounting standards.
Expense ratio impacted by IFRS 17
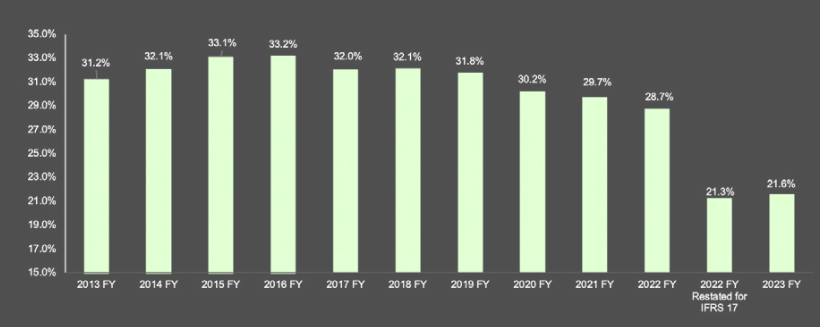
Expense ratio impacted by IFRS 17 and grew marginally for the first time since 2016.
Total Reinsurance dedicated capital
Reinsurance dedicated capital rises, surpassing the previous highpoint of 2021.
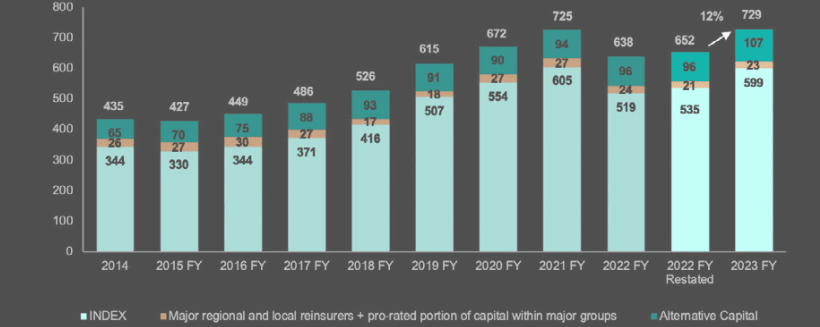
Although reinsurance dedicated capital reached a new peak in 2023, capital growth over the past three years (+8%) has been outpaced by premium growth (+18%) as a result of both underlying demand and inflationary pressures.
Capital for the INDEX companies, which contribute just over 82% of total reinsurance dedicated capital, was up 12% to USD599B.
Non-life alternative capital rose by USD11B, or 11%, to USD107B, supported in particular by growth in catastrophe bonds which contributed approximately USD6B of the increase.
The key drivers were retained earnings resulting from reduced loss activity and higher collateral yields, net inflows and mark-to-market gains. Collateralized reinsurance continues to reduce on a relative share basis, in line with developments seen in 2022.
As well as increasing on an accounting basis, global reinsurers’ capital adequacy remains strong on an economic basis, the measure which Gallagher Re views as more relevant for management teams’ decision making.
Average solvency for the top four European reinsurers was 261%, up from 255% at 2022 FY, which is at the upper end of, and in most cases above, management target levels.
The USD64B rise in INDEX capital to USD599B was driven by strong net income of USD97B and USD54B of unrealized investment appreciation, which reverses just over 60% of the unrealized investment depreciation reported in 2022 FY.
Most of the unrealized investment appreciation was attributable to National Indemnity whose significant US equity holdings rose in value during the year.
Net income improved significantly to USD97B versus USD23B at 2022 FY due to higher underwriting and investment profitability, the latter benefiting from a 1ppt rise in the running yield and a return to a positive gains yield.
Almost all (97%) of the INDEX companies’ net income was returned through buy-backs and dividends which together totaled USD94B. However, 87% of total capital returned was due to National Indemnity, with other INDEX companies retaining much of their net income.
Despite continued favorable market conditions there were no material new market entrants. The net balance of capital raises versus debt reduction accounted for only USD2B.
Movement in reinsurance capital
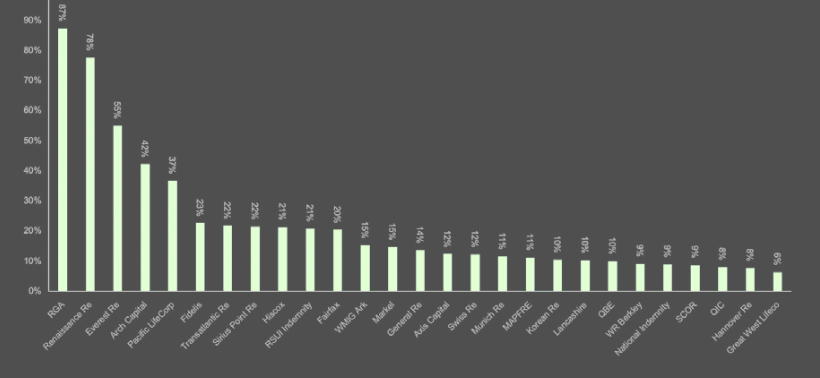
Accounting changes were the main driver of RGA’s 87% increase in capital. 2023 FY capital was still up by a robust 28% relative to the restated 2022 FY capital base due to unrealized investment appreciation and net income.
Renaissance Re’s 78% rise in capital was due to net income of USD2.5B and a capital raise of USD1.6B to support its purchase of Validus Re.
Everest Re’s 55% rise in capital was due to net income of USD2.5B and a capital raise of USD1.4B to target growth in the current favorable market conditions.
Notably, National Indemnity reported a 9% rise in capital despite paying a significant dividend of USD82B. The dividend payment was more than offset by unrealized and realized investment gains (USD92B combined).
Adjusted capital return as a percentage of net earnings
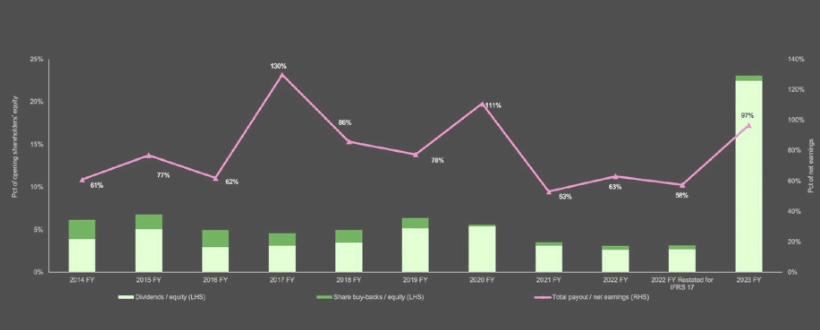
As a result of an USD82B dividend paid by National Indemnity, which contributed 87% of total capital returns (dividends and buy-backs), return of capital both as a percentage of net earnings and of opening shareholders’ equity rose significantly at 2023 FY.
Excluding National Indemnity from both 2023 FY and 2022 FY, total capital return as a percentage of net earnings reduced to 31% from 66% due to growth in the denominator exceeding growth in the numerator.
In absolute terms, capital return in 2023 was up by more than 10% compared to 2022.
As is generally the case, capital return as a percentage of opening shareholders’ equity was more stable. Excluding National Indemnity, it increased marginally to 6% from 5% at 2022 FY due to the combination of a higher capital return and reduced opening shareholders’ equity.
As has been the case since 2020, share buy-backs were modest, comprising just 0.6% of opening shareholders’ equity, as management teams targeted growth in favorable market conditions.
Underwriting performance
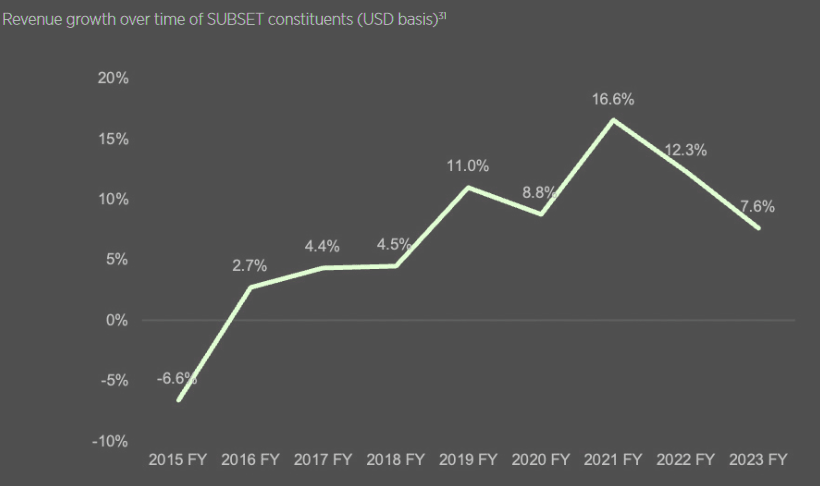
Most companies experienced revenue growth, however some scaled back their portfolios
2023 revenue growth was a healthy 7.6%, albeit moderating from the higher growth seen in 2022 and 2021 FY. 2023 growth was driven by significant rate improvements within property reinsurance, while rising attachment points and portfolio management actions (both portfolio pruning and a shift in business mix towards non-proportional) muted volume growth.
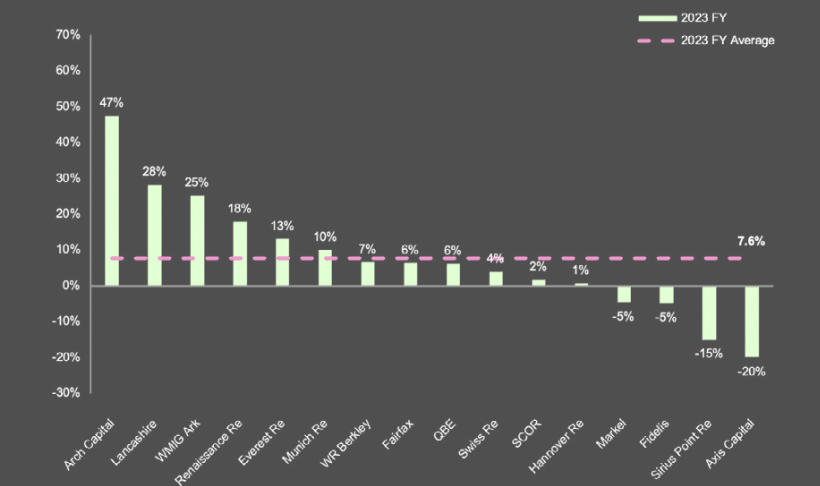
Over a third of companies reported double-digit revenue growth with the most significant rises driven by targeted expansion in the hard market and property lines specifically.
Arch Capital spearheaded this with a 47% growth in revenue down to strong growth in property business.
Many of the firms with moderate (low to mid-single digit) revenue growth reduced their exposure to natural catastrophe exposed property lines. This reduction was typically offset by rate increases, most apparent in the property business that was written.
Notable is the 20% reduction in Axis Capital’s revenue, which followed its complete exit from property reinsurance in 2023. Sirius Point Re meanwhile recorded a 16.5% reduction in gross written premiums (a decline of 15% on a net basis) off the back of a significant restructuring of its reinsurance book which concluded in 2023.
The transition to IFRS 17 led to a significant lowering in the SUBSET’s reported combined ratio for 2022 FY, from 97.8% as originally reported to 94.6%.
This is mainly driven by the introduction of discounting and ceding commissions being deducted from revenues, rather than being reflected in expenses for IFRS 17 reporters. The reduction in the denominator in turn increased the effect of natural catastrophe losses on the combined ratio (from 8.8% to 10.3%).
The reported combined ratio was down 5.7ppts from this basis to 88.9% in 2023 FY, due to a lower impact from natural catastrophe losses (-3.5ppts down from 10.3ppts in 2022 FY to 6.7ppts in 2023 FY), an improving ex-nat cat accident year loss ratio (-2.0ppts) as rate increases continue to earn through, and a slight increase in the effect of reserve releases on the combined ratio (+0.4ppts to 1.8%).
This was partly offset by a marginally higher expense ratio (+0.3ppts). The favorable impact from discounting remained broadly stable (+0.1ppt) at 2.9%.
The normalized natural catastrophe load reduced substantially, from 10.1% in 2021 FY to 8.2% in 2022 FY, as 2017 (which had been heavily impacted by the Harvey-Irma-Maria hurricanes) was no longer factored into that calculation.
The natural catastrophe load however increased to 9.9% on transition to IFRS 17 as the denominator in the calculation decreased. On this restated basis, the normalized natural catastrophe load reduced to 9.1% in 2023 FY as the relatively natural catastrophe light 2023 FY replaced the heavier 2018 FY.
……………………..
AUTHORS: James Vickers – Chairman Gallagher Re International, Michael van Wegen – Head of Client & Market Insights, International, Global Strategic Advisory