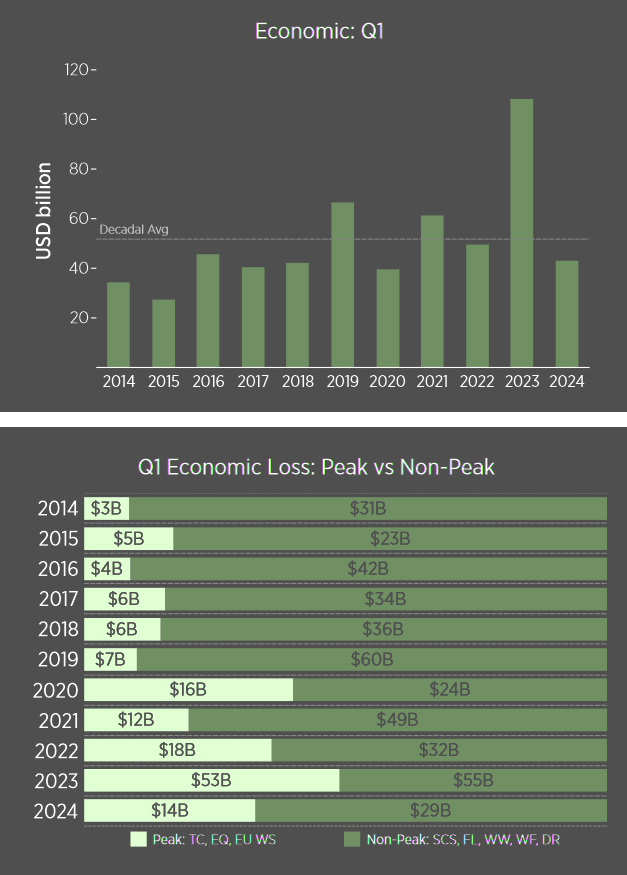
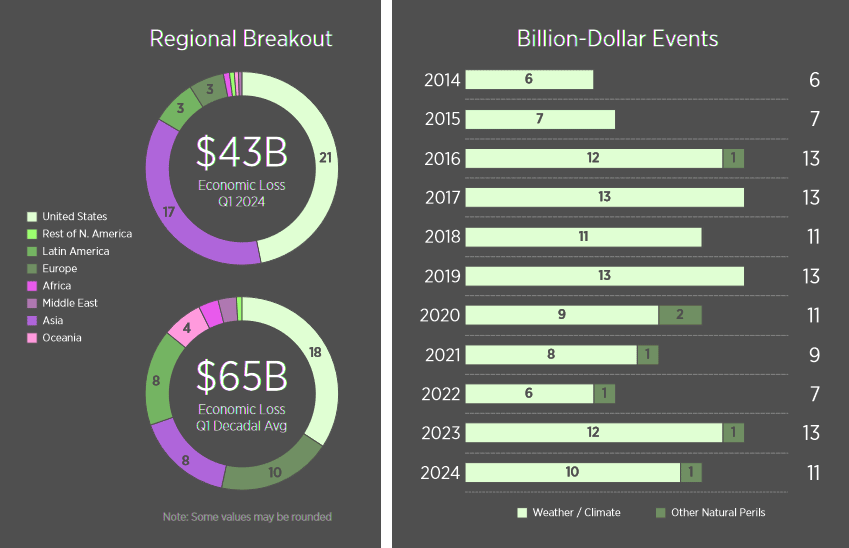
The global financial cost of natural catastrophes starting in 2024 was manageable for federal governments and the insurance industry. The minimum USD43 billion in economic loss from all natural perils was 17% lower than the most recent 10-year Q1 average (USD52 billion). The portion covered by the private insurance market or public insurance entities totaled at least USD20 billion, or 10% higher than the decadal average (USD18 billion), according to Gallagher Re Report.
When looking solely at weather and climate-related disaster costs, which means excluding losses associated with earthquakes, volcanoes, or other non-atmospheric driven events, the economic cost was minimally USD31 billion. This was lower than the decadal average (USD43 billion) (see TOP 20 Costliest U.S. Hurricanes).
Insurers covered at least USD17 bn, equal to the decadal average (USD17 bn). For comparison’s sake, Q1 2023 values were USD61 bn (economic) and USD26 bn (insured).
The cost of Q1 2024 events was markedly lower than Q1 2023 (USD108 billion economic and USD33 billion insured). It is worth noting that Q1 loss totals often show robust loss development throughout the year.
This is especially relevant when assessing the agricultural impact of weather-related effects on planting seasons and harvests. The Q1 2024 total(s) is expected to follow this pattern (see Insurers Poorly Prepared for the Increased Losses by Catastrophe).
Manageable Start for Catastrophe Losses

There is little correlation between the performance of catastrophe losses in the months of January, February, and March and how the rest of the calendar year would be expected to play out.
As the spring and summer months (Q2 and Q3) begin across the Northern Hemisphere, this often brings a more volatile period for weather-related activity.
The United States, which is the insurance industry’s most active global market for filed claims, becomes a particular point of focus for severe convective storm activity, drought, and later for potential landfalling hurricane events. Europe and Asia also enter peak months for possible large-scale weather / climate disasters.
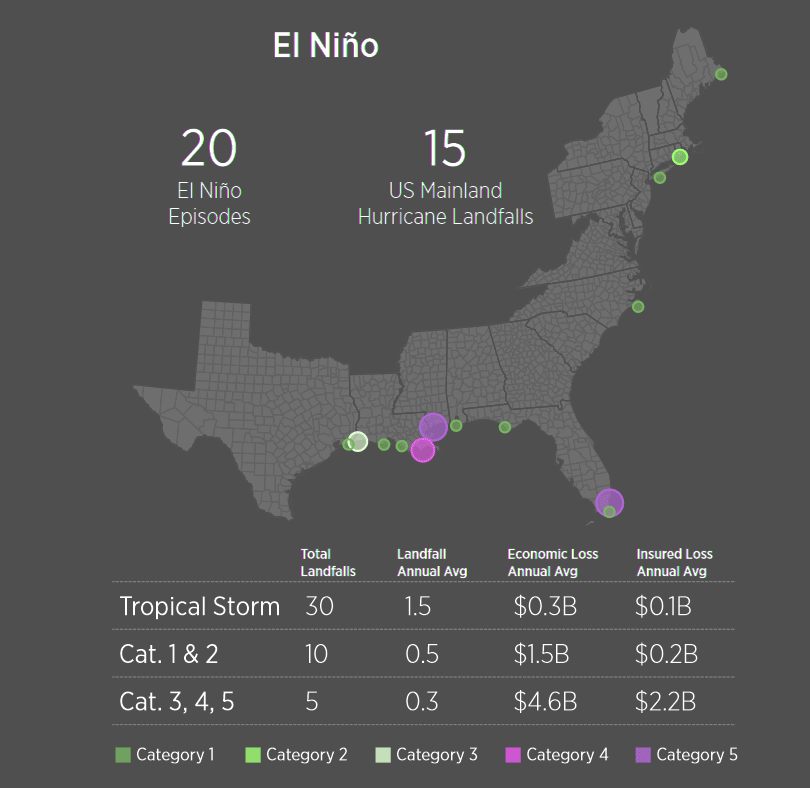
As we enter Q2 and Q3, there will be close focus on the expected quick transition from El Niño to La Niña conditions in the central and eastern Pacific Ocean. This has resulted in early projections for a potentially hyperactive Atlantic hurricane season (see Worldwide Tropical Cyclone Season: Events & Economic Loss).
Whether this translates to more US landfalls is the critical question. It bears close watching, particularly as primary carriers are already responding to a difficult US market, but ample reinsurance market capital has the industry well positioned to navigate an active hurricane season.
La Niña can also bring further weather extremes around the world. 2024 is currently projected to be one of the top three warmest years on record.
Global Natural Catastrophe Economic Losses

The total economic loss for Q1 2024 was preliminarily estimated at USD43 billion. The most expensive individual event occurred on the first day of 2024. A USGS-registered magnitude-7.5 earthquake struck Japan’s Noto Peninsula on January 1 and left a tentatively estimated USD12 billion in direct economic losses (see NatCat Insured & Economic Losses Increases Due to Climate Change).
This accounted for 28% of the entire global Q1 total. In recent years, 2020, 2022, 2023, and 2024 have had an earthquake event as the costliest Q1 event. The exception was 2021 (US Polar Vortex).
Ten additional weather / climate-related billion-dollar economic loss events were recorded during Q1 2024. This included seven in the US (three severe convective storms (SCS), three winter weather, and one flooding), two in South America (drought in Brazil and wildfires in Chile), and one in Asia (winter weather in China).

Despite an above-average volume of large hail reports (at least two inches or larger) in the US, overall SCS damage costs were lower than what was seen in the same period in 2023.
As a reminder, 2023 started with lingering La Niña conditions, which aids in an earlier start to the SCS season, while 2024 started during strong El Niño conditions.

Losses attributed to global flooding were also mild compared to their decadal average. Winter weather and extratropical cyclone activity were manageable from a loss and damage perspective in Europe, North America, and Asia.
Global Natural Catastrophe Insured Losses
The preliminary view of insured losses during Q1 2024 showed a slightly higher than average total, but it was largely a manageable start to the year for the insurance industry.
The minimum of USD20 billion in payouts was above the decadal average (USD18 billion). There were two events which topped USD3 billion in insured losses: a US SCS outbreak (March 12–17) and the January 1 Japan earthquake.
Both estimates remained tentative. The Japan estimate was subject to further revision as claim filings and payouts after the April 1 renewal period may require another adjustment to the initial estimate.
Overall, the costliest peril was SCS, with the early global estimate exceeding USD11 billion. Most of these losses were incurred in the United States, and further development was likely from the biggest Q1 SCS outbreaks, including three that are already billion-dollar events.

Hail was again the primary sub-peril, driving the bulk of the insured costs across the central and eastern portions of the US. In any given year, hail drives 50% to 80% of all thunderstorm-related claims.
For comparison, the record-setting SCS loss year in 2023 recorded USD15 billion in insured losses during the first three months of the year.

The other major perils all saw benign loss totals. An active European windstorm season did not result in any significant market-driven events, though parts of Scandinavia did see abnormally high local losses.
The succession of storms did elevate rainfall totals in several parts of Northern Europe. Other boreal winter weather events in the US, Europe, and Asia only resulted in mild claim payouts.
The US accounted for more than USD15 billion, or 75%, of the Q1 total. This was above the region’s decadal average of USD11 billion, but as previously mentioned, the expectation is that Q1 US losses will only further increase in the months ahead.
The only region with above-average Q1 losses was Asia, driven by the Noto Peninsula earthquake. For weather / climate events, Q1 is not annually a major driver of losses for private and public insurance entities.
Atlantic hurricane season: more opportunity for US landfalls
In the past decade, it has accounted for just 14% of annual insured losses.
While an active Atlantic hurricane season would mean more opportunity for US landfalls, it does not guarantee it
But the risk justifies close monitoring as the US insurance market, particularly in Florida, Louisiana, and elsewhere, remains mired in private insurance affordability and availability challenges.


For no reason beyond timing and luck, the earthquake peril has recorded several historically significant events for insurers in Q1, including the Turkey Earthquake sequence (2023), the Great Tohoku (Japan) Earthquake and Tsunami (2011), the Christchurch (New Zealand) Earthquake (2011), the Maule (Chile) Earthquake and Tsunami (2010), Japan’s Great Hanshin Earthquake (1995), and California’s Northridge Earthquake (1994). Each of those events resulted in market-defining losses.
…………….
AUTHORS: Steve Bowen – Chief Science Officer Gallagher Re, Brian Kerschner – Western Hemisphere Meteorologist Gallagher Re, Jin Zheng Ng – Eastern Hemisphere Meteorologist Gallagher Re


