Overview
Aon’s work with Columbia University has revealed that under selected scenarios, U.S. hurricane losses would increase by at least 10% over 20 years as a result of changes in climatic activity.
This estimate does not account for increases in exposures as a result of non-climatic factors such as new development and inflationary momentum (see Main Challenges for Insurance Industry).
Emerging climate research for the insurance industry
The 14 global academic collaborations are bringing emerging climate research directly to the insurance industry, to enhance risk understanding and create actionable insights to build physical resilience, transition to net zero and identify growth opportunities.
Columbia University has explored different ways to quantify moisture in the air and this has a notable impact on how the frequency of hurricanes could change in the future.
Running several Shared Socioeconomic Pathways scenarios with different climate policy assumptions to assess the impact of varying levels of future greenhouse gases and aerosols. The team found that higher aerosol emissions led to fewer tropical cyclones (see Worldwide Tropical Cyclone Season).
Such data will be incorporated into Aon’s tropical cyclone models to better assess future financial losses. U.S. hurricanes have the same uncertainty as the frequency of tropical cyclones (see Climate-Related Risks in the Insurance Sector).
The total cost for the last 5 years ($742.1 bn) is more than one-third of the disaster cost total of the last 42 years ($2.155 trln). This reflects a five-year cost average of nearly $148.4 bn per year.
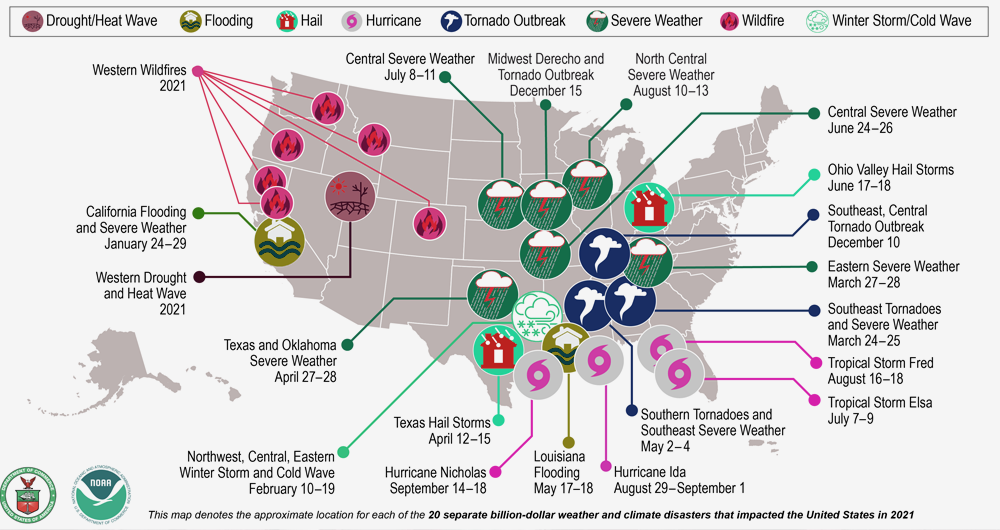
There were 20 separate billion-dollar weather and climate disasters. The total cost for these events was $145 billion, making this the third most costly year on record, behind 2017 and 2005. 2022 was the seventh consecutive year in which 10 or more billion-dollar disaster events occurred in the U.S.
20 Most Costliest U.S. Hurricanes
| Rank | Name | Year | Damage |
| 1 | Katrina | 2005 | $153.8 bn |
| 2 | Sandy | 2012 | $67.7 bn |
| 3 | Andrew | 1992 | $46.2 bn |
| 4 | Ike | 2008 | $33.3 bn |
| 5 | Ivan | 2004 | $26.0 bn |
| 6 | Wilma | 2005 | $23.4 bn |
| 7 | Rita | 2005 | $22.8 bn |
| 8 | Charley | 2004 | $21.0 bn |
| 9 | Hugo | 1989 | $17.4 bn |
| 10 | Irene | 2011 | $14.3 bn |
| 11 | Agnes | 1972 | $13.1 bn |
| 12 | Betsy | 1965 | $12.5 bn |
| 13 | Frances | 2004 | $12.4 bn |
| 14 | Allison | 2001 | $11.5 bn |
| 15 | Camille | 1969 | $10.3 bn |
| 16 | Jeanne | 2004 | $9.5 bn |
| 17 | Floyd | 1999 | $9.4 bn |
| 18 | Georges | 1998 | $8.8 bn |
| 19 | Diane | 1955 | $8.2 bn |
| 20 | Fran | 1996 | $7.6 bn |
These findings are based on evolving climate research and could be subject to revision as new insights are obtained.
Output from the collaborations can also benefit other corporations with climate risk exposures, particularly when addressing increasing regulatory mandates.
The peril-specific academic insights being built into the models include hurricanes and wildfires in the US, along with European floods and windstorms (see Re/Insurers’ Survey about ESG Strategy & Climate Risk Modelling).
U.S. wildfires have increased risk
U.S. wildfires have increased risk due to hotter climate and human-triggered events, recent historic U.S. drought conditions are consistent with the output of climate models, which project a hotter, drier western hemisphere due to increased greenhouse gases.
Peripheral development in at-risk areas coupled with these drier conditions is expected to significantly increase fire risk in many areas.
Atmospheric circulation patterns play a key role in driving extreme weather events, such as floods and windstorms, but Aon’s collaboration with the Karlsruhe Institute of Technology found that extreme hydrological events also strongly depend on catchment size and physical features of the terrain.
Heavy rainfall in highly permeable areas can cause insignificant flooding, while the same rainfall in areas with narrow valleys can cause a catastrophe, as confirmed by the devastating Bernd flood in Germany in July.
Such terrain effects are now being incorporated into Impact Forecasting catastrophe models to help insurers better forecast potential losses.
Impact Forecasting will rebuild its catastrophe modelling suite to incorporate climate considerations, rather than making frequency adjustments to existing loss scenarios.
These models will enable forward-looking hazard data for different climate scenarios and inform climate advisory frameworks to help insurers make better business decisions.
These tools are being expanded to better manage physical risk for financial institutions, governments and energy sectors.
Hurricane Costs
Of all recorded weather disasters in U.S. history, tropical cyclones—known as hurricanes when occurring in the North Atlantic, central North Pacific, and Eastern North Pacific Oceans—have caused the most deaths and destruction. While much of the information on this page focuses on hurricanes, some of the numbers account for total weather disasters, including flooding, severe storms, and wildfires.
- 56 – the number of weather and climate disasters in the U.S. in the past three years (2019 to 2022) with losses exceeding $1 billion.
- $2.155 trillion – the total approximate cost of damages from weather and climate disasters in the U.S. from 1980 to 2022.
- 17.2 – the average annual number of weather and climate disasters from 2017 to 2022. In 2022 alone, the U.S. experienced 20 billion-dollar disasters.
What is the most costly hurricane in US history?
For all United States hurricanes, Hurricane Katrina (2005, $192.5B) is the costliest storm on record. Hurricane Harvey (2017, $152.5B) ranks second, Hurricane Ian (2022, $114.0B) ranks third, Hurricane Maria (2017, $109.8B) ranks fourth, and Hurricane Sandy (2012, $84.6B) ranks fifth.
The 1900 Galveston hurricane was the deadliest hurricane in the history of the United States, killing between 6,000 and 12,000 people.
Tropical Cyclones: The Highest Costs
Of the 310 billion-dollar weather disasters between 1980 and 2022, tropical cyclones (or hurricanes) have caused the most damage: over $1.1 trillion total, with an average cost of $20.5 billion per event. They are also responsible for the highest number of deaths: 6,697 between 1980 and 2022.
Intensification of tropical cyclones
Tropical cyclones are expected to become more powerful, leading to heightened rainfall and larger storm surges.
According to MS Amlin, the occurrence of major hurricanes has also grown by 0.5 per decade during the same period. Furthermore, there has been a notable upward trend, with a 5% per decade increase, in the proportion of storms intensifying to Category 4 or higher (see Worldwide Tropical Cyclone Season: Listing of Events & Economic Loss).
Since 1990, there has been a gradual rise in the frequency of North Atlantic hurricanes, with an increase of 0.6 hurricanes per decade, MS Amlin noted in its 2023 Hurricane Season Forecast report.
North Atlantic hurricane season, spanning from June 1st to November 30th, is expected to be relatively normal.
The average forecast predicts a total of 15 named storms, 7 hurricanes, and 3 major hurricanes. This outlook is influenced by models indicating that an El Niño phase, known as ENSO positive, will be present during the peak of the hurricane season.
Munich Re has estimated that, following the North Atlantic hurricane season, overall losses from all storms amounted to around US $110 billion, with insured losses in the magnitude of $65 billion.
Reflecting on the 2022 hurricane season has suggested that the year shows a continuation of a trend of growing insured losses, with climate change a clear factor.
This ENSO positive phase is expected to suppress activity. However, warmer sea surface temperatures, which are above the normal range, are likely to contribute to an increase in activity (see Home Insurance Can Make Homeowners Resilient to Weather & Hurricane Loss).
In the Pacific Basin, an above-average season is anticipated due to the presence of the ENSO-positive phase. Forecasts for this region indicate the occurrence of 22 tropical storms, 12 typhoons, and 5 intense typhoons.
FAQ
Aon’s work with Columbia University suggests that U.S. hurricane losses could increase by at least 10% due to climatic changes. This projection spans a 20-year period and does not account for non-climatic factors such as new developments or inflation.
Aon’s 14 global academic collaborations are helping bring new climate research to the insurance industry. This enhances risk understanding, supports resilience building, and identifies growth opportunities. Data from these collaborations, such as those with Columbia University, are integrated into catastrophe models to assess future financial losses.
Columbia University explored moisture levels in the air, finding a notable impact on future hurricane frequency. Higher aerosol emissions, for example, can lead to fewer tropical cyclones. This data helps improve tropical cyclone models for better loss predictions.
In the last five years, weather and climate disasters in the U.S. caused over $742.1 bn in damages. The U.S. has experienced 20 separate billion-dollar disasters, with a total cost of $145 bn in 2022 alone. This was the third costliest year on record.
Aon’s collaboration with the Karlsruhe Institute of Technology shows that terrain plays a significant role in flood risk. For example, heavy rainfall in permeable areas might cause minimal flooding, while the same amount in narrow valleys can lead to devastating floods.
Wildfire risks have increased due to hotter climates and human-triggered events. Drier conditions and peripheral development in at-risk areas contribute to the growing wildfire threat, particularly in the western U.S.
The frequency and intensity of tropical cyclones are expected to rise. Over recent decades, the occurrence of major hurricanes has grown by 0.5 per decade, with a 5% increase in storms intensifying to Category 4 or higher. Warmer sea temperatures and climate change are key contributors to these trends
Edited by  Nataly Kramer