Overview
The value of the worldwide market for insurance broking in terms of fees and commissions earned was around USD 168 bn in 2023, up from around USD 151 bn in 2022 on a constant currency basis, equivalent to a growth rate of around 11.3% without adjusting for inflation, but closer to 4.4% as an inflation-adjusted measure, according to Insuramore.
Insurance broking market is estimated to have broken down between around USD 76.6 bn due to commercial P&C retail broking, USD 16.5 bn to private P&C retail broking, USD 54.5 bn to employee benefits plus life and health insurance retail broking, USD 7.4 bn to reinsurance broking and USD 13 bn to wholesale broking.
Each of the segments registered a double-digit growth rate during the year apart from employee benefits plus life and health insurance retail broking
Top 15 broking groups together achieved an even higher aggregate growth rate of 12.3% albeit this was driven in part by M&A activity.
In terms of the value of its total broking revenues worldwide, Marsh McLennan ranked first among broking groups in 2023 and it was followed in descending order by Aon, Gallagher, WTW and HUB.

The leaders in each of the five broking segments were as follows:
- commercial P&C insurance retail broking – Marsh McLennan;
- private P&C insurance retail broking – Alliant;
- employee benefits activity plus retail broking of life and health cover – WTW;
- reinsurance broking – Aon;
- wholesale insurance broking – Amwins.
The top 20 groups are believed to have controlled 51.9% of total global broking fees and commissions in 2023 and the top 300 groups for 84.7%.
Relative to the equivalent figures computed for 2022 (namely, a respective 51% and 83.2%), this shows that there has been some consolidation in the market structure; this is due both to M&A activity and to the strengthening of the US dollar against most global currencies during 2023, causing groups reporting in US dollars to achieve a higher weighting within the worldwide ranking.
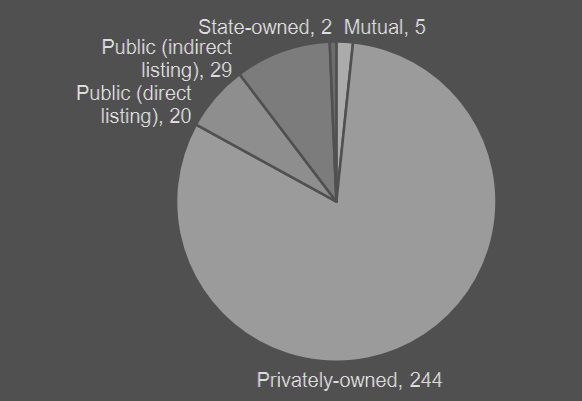
Indeed, among the top 300 groups, the US is the headquarters for 140 (46.7%) of them; following the US by this measure are France, the UK, Canada and China, the home countries for a respective 26, 26, 16 and 15 of the largest 300 groups, with the rest of the world accounting for the remaining 77 in the analysis.
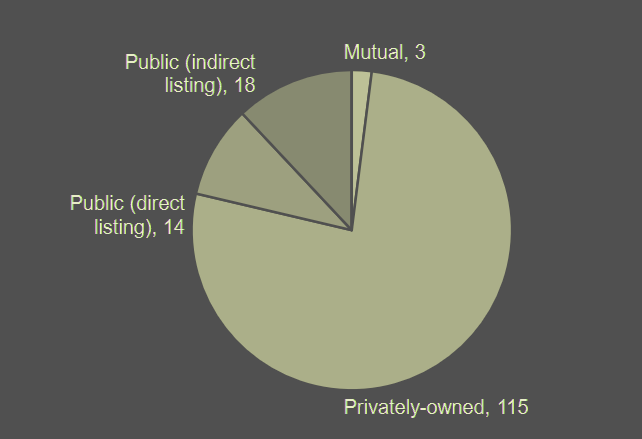
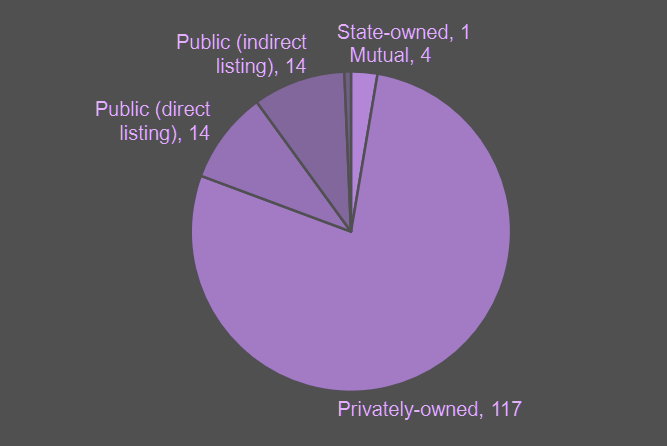
The vast majority (at 244, or 81.3%) are privately-owned, involving one or a combination of family ownership, employee ownership or private equity.
Looking ahead, it will be apposite to see whether a continuing stream of M&A activity causes the worldwide market to consolidate further in 2024; significantly, eight of the top 300 groups were in the process of being acquired during the first half of the year.
Total Insurance Broking
Rankings of the world’s leading broker groups by total (retail and wholesale) broking revenues derived globally from all types of insurance (and reinsurance).
Analyzed as consolidated groups, the world’s top 300 brokers of all types of insurance accounted for 84.7% of total broking revenues earned globally.
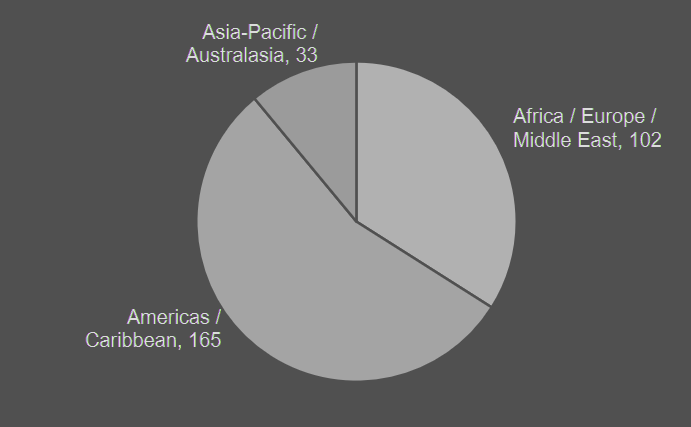
Top 300 Broker Groups Worldwide by Total Insurance Broking Revenues
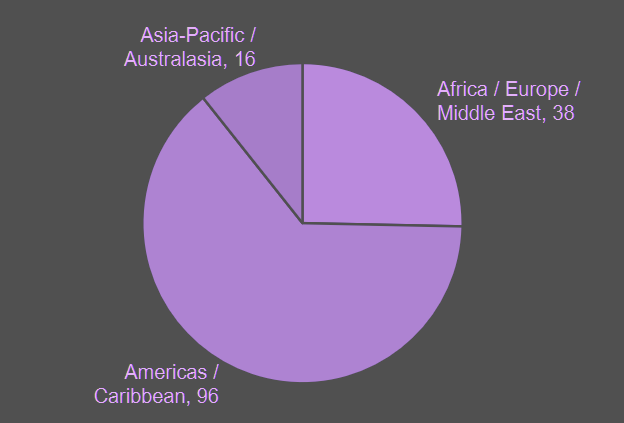
Segmentation by Type and by Region
Total insurance broking revenues
| Rank | Broking group | Broking revenues | CAGR 2020/2023 | Global market share (%) |
| 1 | Marsh McLennan | 17 894,7 | 8,7% | 10,65% |
| 2 | Aon | 12 327,1 | 6,4% | 7,34% |
| 3 | Gallagher | 8 694,0 | 16,7% | 5,18% |
| 4 | WTW | 8 311,6 | -0,4% | 4,95% |
| 5 | HUB (Hellman & Friedman) | 3 960,4 | 16,7% | 2,36% |
| 6 | Acrisure | 3 957,5 | 26,9% | 2,36% |
| 7 | Lockton | 3 662,5 | 20,4% | 2,18% |
| 8 | Alliant | 3 486,6 | 23,0% | 2,08% |
| 9 | Brown & Brown | 2 794,7 | 19,0% | 1,66% |
| 10 | TIH (see note A) | 2 755,8 | 12,4% | 1,64% |
| 11 | Howden | 2 607,1 | 48,0% | 1,55% |
| 12 | AssuredPartners (GTCR) | 2 575,9 | 16,9% | 1,53% |
| 13 | USI Holdings (KKR) | 2 535,8 | 11,8% | 1,51% |
| 14 | NFP (Madison Dearborn Partners) (see note B) | 2 046,0 | 12,0% | 1,22% |
| 15 | Amwins | 1 999,2 | 14,5% | 1,19% |
| All other broking groups / brokers | 88 343,6 | 52,60% | ||
| Approximate global total | 167 952,6 | 100,00% |
Insurance Brokers: P&C Commercial Insurance
Rankings of the world’s leading broker groups by retail broking revenues derived globally from commercial P&C (non-life) insurance.
Analyzed as consolidated groups, the world’s top 300 retail brokers of commercial P&C (non-life) insurance accounted for 88.1% of retail broking revenues earned globally from this activity in 2023.
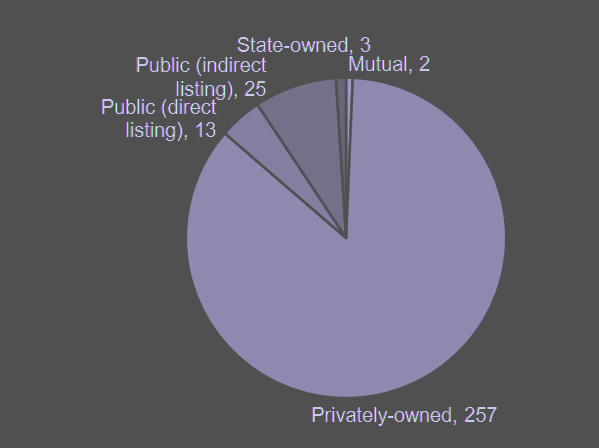
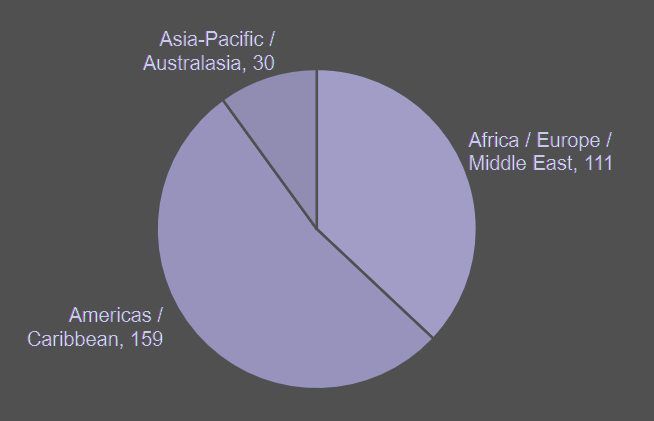
Top 300 Broker Groups Worldwide by Commercial P&C Insurance Retail Broking Revenues
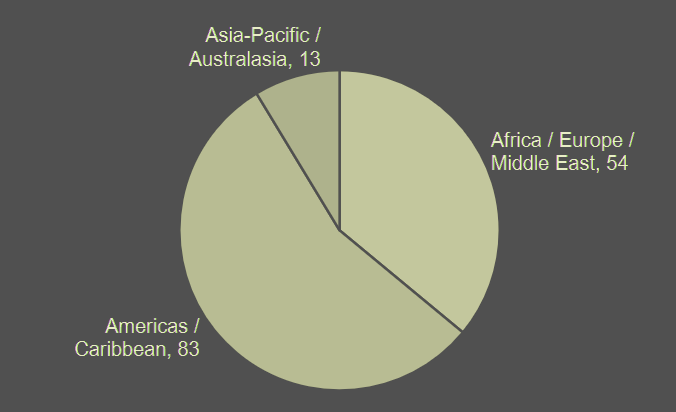
Segmentation by Type and by Home Region
TOP 15 Commercial P&C insurance retail broking revenues
| Rank | Broking group | Broking revenues | CAGR 2020/2023 | Global market share (%) |
| 1 | Marsh McLennan | 10 815,5 | 10,7% | 14,12% |
| 2 | Aon | 6 373,9 | 6,1% | 8,32% |
| 3 | Gallagher | 4 785,7 | 13,5% | 6,25% |
| 4 | WTW | 3 370,8 | 5,4% | 4,40% |
| 5 | Acrisure | 2 960,1 | 28,8% | 3,86% |
| 6 | Lockton | 2 285,5 | 23,5% | 2,98% |
| 7 | HUB (Hellman & Friedman) | 2 023,3 | 18,0% | 2,64% |
| 8 | Alliant | 1 952,1 | 17,6% | 2,55% |
| 9 | AssuredPartners (GTCR) | 1 653,0 | 14,4% | 2,16% |
| 10 | Brown & Brown | 1 529,9 | 22,9% | 2,00% |
| 11 | Howden | 1 343,0 | 49,1% | 1,75% |
| 12 | USI Holdings (KKR) | 1 237,4 | 10,2% | 1,62% |
| 13 | BroadStreet Partners (Ontario Teachers’ Pension Plan Board) | 1 203,8 | 26,3% | 1,57% |
| 14 | TIH (see note A) | 1 057,9 | 13,4% | 1,38% |
| 15 | Ardonagh Group (HPS Investment Partners, Madison Dearborn Partners) | 951,0 | 32,1% | 1,24% |
| All other broking groups / brokers | 33 062,8 | 43,16% | ||
| Approximate global total | 76 605,7 | 100,00% |
Insurance Brokers: P&C Private Insurance
Rankings of the world’s leading broker groups by retail broking revenues derived globally from private P&C (non-life) insurance.
Analyzed as consolidated groups, the world’s top 150 retail brokers of private P&C (non-life) insurance accounted for 78.9% of retail broking revenues earned globally from this activity in 2023.
Top 150 Broker Groups Worldwide as Measured by Private P&C Insurance Retail Broking Revenues
Segmentation by Type and by Home Region
TOP 5 Private P&C insurance retail broking revenues
| Rank | Broking group | Broking revenues | CAGR 2020/2023 | Global market share (%) |
| 1 | Alliant | 675,7 | 122,30% | 4,09% |
| 2 | HUB (Hellman & Friedman) | 645,7 | 14,30% | 3,91% |
| 3 | Ardonagh Group (HPS Investment Partners, Madison Dearborn Partners) | 478 | 21,00% | 2,89% |
| 4 | BroadStreet Partners (Ontario Teachers’ Pension Plan Board) | 443,9 | 62,60% | 2,69% |
| 5 | Cheche Group | 431,7 | 41,00% | 2,61% |
| All other broking groups / brokers | 13 854,20 | 83,82% | ||
| Approximate global total | 16 529,20 | 100,00% |
Insurance Brokers: Employee Benefits, Life and Health Insurance
Rankings of the world’s leading broker groups by retail broking revenues derived globally from employee benefits activity and life / health insurance.
Analyzed as consolidated groups, the world’s top 150 retail brokers of employee benefits plus life and health insurance accounted for 80.0% of retail broking revenues earned globally from this activity in 2023.
Top 150 Broker Groups Worldwide by Employee Benefits + Life and Health Insurance Retail Broking Revenues
Segmentation by Type and by Home Region
TOP 5 Employee benefits + life and health insurance retail broking revenues
| Rank | Broking group | Broking revenues | CAGR 2020/2023 | Global market share (%) |
| 1 | WTW | 4 744,7 | 4,6% | 8,71% |
| 2 | Marsh McLennan | 4 568,0 | 3,3% | 8,39% |
| 3 | Aon | 3 456,2 | 4,4% | 6,35% |
| 4 | Gallagher | 1 857,0 | 13,6% | 3,41% |
| 5 | HUB (Hellman & Friedman) | 1 205,3 | 15,4% | 2,21% |
| All other broking groups / brokers | 38 625,2 | 70,93% | ||
| Approximate global total | 54 456,4 | 100,00% |
Insurance broking revenues are defined as fees and commissions earned from any kind of insurance (or reinsurance) wherein the intermediary (brokerage / independent agency) acts in an advisory capacity for its customers and places risks with all or a broad range of carriers / underwriters in the relevant market either directly (on a retail basis) or indirectly via other intermediaries (on a wholesale basis).
Fees earned from alternative risk transfer (ART) activity such as the placement of risks with a captive carrier / underwriter, risk retention group (RRG) or insurance pool, or into an insurance-related security, are also classified here as insurance broking revenues, as are fees intrinsically related to core broking activity such as those earned from safety / risk / crisis management consulting, claims advocacy / claims management, premium finance, employee benefits / health / pensions / wellness consulting, associated data / actuarial analytics etc.
Fees and commissions earned from activity wherein the intermediary acts as a tied agent for a single (non-captive) carrier / underwriter or places risks with a limited panel of (non-captive) carriers / underwriters are NOT classified here as insurance broking.
 by
by