When considering weather-related catastrophes, few perils have generated as many column inches in recent months as severe convective storms (SCS). Even more notable is that annual losses have averaged more than USD25 billion in the past decade alone. The first half of 2024 is on track to be one of the most expensive H1 on record for US SCS activity, both in terms of economic loss (at least USD35bn) and insured loss (at least USD 29 billion), according to Gallagher Re’s Natural Catastrophe Report and event estimates as of mid-June.
Secondary perils contributed significantly to the industry loss record yet again. These perils include flood, tornados, hail, extreme temperatures, winter storms and wildfires. The frequency and magnitude of these loss events are an increasing component of loss costs that must be priced for.
The report finds that the “new normal” of more frequent climate change-related natural disasters could render current catastrophe modelling out of date.
Other factors include the severe supply chain issues brought about by the pandemic, from availability/price of materials, a shocking shortage of skilled workers in the labour market and longer-duration business interruptions.
Insurance industry losses from Natural Catastrophes
The first quarter was particularly active with insured damage from SCS generating 47% of natural catastrophe losses globally, with that total expected to rise as losses develop.
According to JP Morgan, this includes $7 bn from the US storms during the month of June, which analysts estimate to be the largest contributor to natural catastrophe losses for the quarter. Total natural catastrophe insured losses estimates for H1 2024 to be $23bn, including $15bn from Q1 2024.
This looks to be around the same level as H1 2023 and lighter than the historical average for the industry (see Natural Catastrophes Drivers and Lessons for Insurance Industry).
The (re)insurance industry has been grappling with escalating US SCS losses for nearly two decades. The US has surpassed the USD10 billion threshold for insured SCS losses in every year since 2008.
Research into climate change’s impact on the development and severity of SCS is nascent. The current broad understanding is that a globally warming climate could result in large increases to low-level moisture, which in turn would make the atmosphere more conducive for severe thunderstorms and heavy precipitation.
While it is difficult to obtain data which could help quantify the impact of rising temperatures on the formation of thunder and hailstorms, there is significant data around the frequency and severity of the events.
And what is clearly evidenced is that over the past two decades— at a countrywide level across the US—there has been no notable increase in either the frequency or the severity of SCS events.
Gallagher Re’s Analytics team posit there are two main factors which are driving the estimated 11.5% annual increase in aggregate industry SCS losses:
- Damageability: Aging housing stock and loss cost trends
- Exposure: Housing increases and total insured value, population shifts, urban sprawl
Climate change not a major contributor in frequency or severity
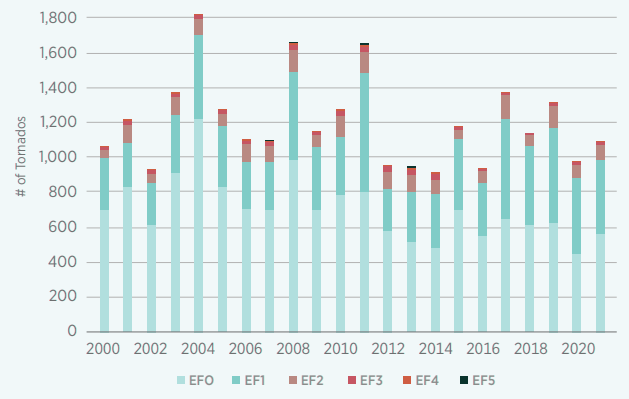
While climate change should clearly remain a consideration for property portfolios as increased data and research comes to light, observable data suggests that the frequency and severity of tornado and hail events have not significantly increased over the past two decades in the US.
Given the plethora of events that struck the US in H1 2024, this may seem counterintuitive, but analysis of observable weather data shows no clear trend in tornado or hail event frequency over the past 20 years.
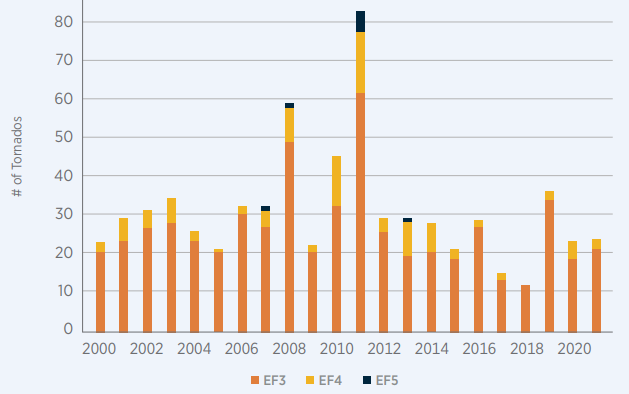
In addition, when specifically focusing on the frequency of severe events, observable data since 2000 has not shown a significant change and more destructive and higher magnitude events have generally remained consistent with historical levels.
That said, there is some evidence of regional shifts in weather patterns but results have not been statistically significant over the 20-year experience period.
US Tornado Frequency
US Hail Frequency

US Severe Tornado Frequency (EF3 and greater)
US Severe Hail Frequency (>1”)
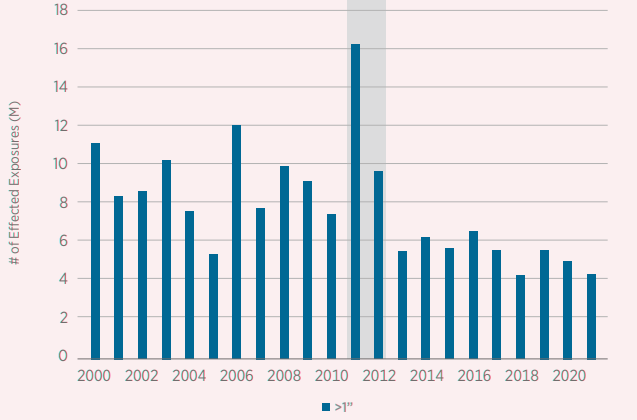
The entire US radar network was upgraded to dual-polarization technology between 2011 and 2013, and is represented by the grey shading. In addition, different models were used by NOAA to process radar data before and after 2011. Hail calculations are based on constant exposure dataset.
Instead, the evidence collated by Gallagher Re finds that aging housing stock and severity trends outpacing CPI are the largest contributing factors to the increase in SCS losses in the US, followed by the overall increase in housing stock, compounded by increased movement into SCS-prone areas and the general phenomenon of urban sprawl over the past two decades.
Aging housing stock and loss trend
The volume of newer properties as a percentage of overall housing stock in the US has been slowly declining, with homes less than five years old now making up just 4% of overall housing stock as of 2020, compared with 9% 20 years earlier.
This data point is important, as Gallagher Re research shows that older properties are 3.5x more likely to generate a new hail claim than new homes.
In addition, Gallagher Re’s research has found that while hail size hasn’t been increasing, hail claim severity outpaced inflation over the past decade. This trend could be attributed to rising material costs, the utilization of independent adjusters and an increasingly litigious environment.
Between 2010 and 2020, when assessing more than 400,000 hail claims in the US, severity increased by an annual average of 5.3%, compared with CPI, which rose by just 1.6% over the same period.
The study controlled for differences in deductibles, roof characteristics, carrier and state.
Urban sprawl and exposure growth
Exposure increase is also driving changing loss trends. Gallagher Re’s analysis of US housing units shows significant growth in SCS prone metropolitan and suburban areas over the past two decades.
From 2010 to 2020, population centers in moderate to severe SCS risk zones like Dallas-Fort Worth, Austin, and Denver have experienced more than 12% housing unit growth.
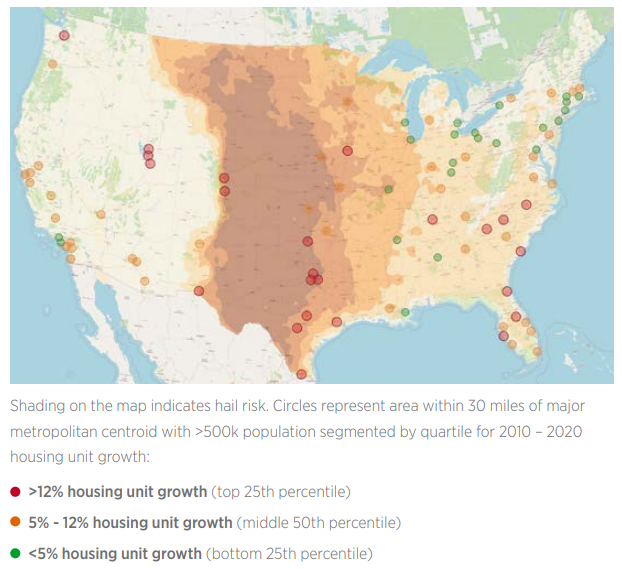
In addition to population moving to more SCS prone areas, metropolitan and suburban areas show the highest rates of growth, which compounds the impact. Between 2010 and 2020, some 69% of new housing units were built in urban or suburban areas near major metropolitan centers.
For example, from 2000-2020, Austin has seen 100% growth in densely populated suburban zones while Dallas-Fort Worth increased by 50%.
What may have been a remote SCS event located just outside a suburb 10 or 20 years ago, now would have a greater likelihood of impacting a larger swath of exposures leading to significant insured loss.
Considering the evolving dynamics involved in quantifying insured losses for SCS, it becomes evident that the conventional methods for estimating expected losses are no longer suitable for the task at hand.
Though previously SCS was seen as a “secondary peril,” insurance carriers now acknowledge the significance of adopting a customized risk perspective in order to address the impact on balance sheets.
…………………
AUTHORS: Megan McConnell – Executive Vice President Gallagher Re, Josie Fix – Executive Vice President Gallagher Re