The Australian Prudential Regulation Authority (APRA) has released its quarterly general and life insurance performance statistics. The Quarterly Insurance Performance Statistics publication provides aggregate summaries of financial performance, financial position, capital adequacy and key ratios for the insurance industry.
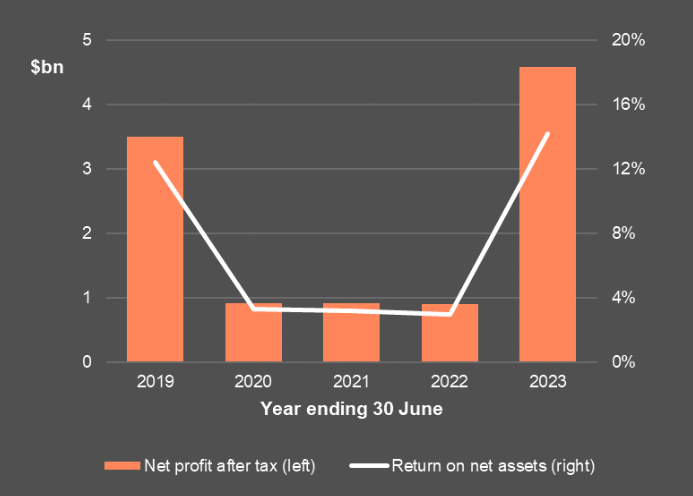
The industry reported a net profit after tax of $4.6 bn and a return on net assets of 14% for year ending June 2024. This was mostly driven by the sharp recovery of investment returns.
The publication also includes detailed statistics at a class-of-business level, a breakdown of operating income and expenses, and more granular solvency information.

- The industry reported a small decline in the underwriting result to $5.7 billion for the year ending 30 June 2024. However, results remain relatively strong due to increasing premiums in response to higher recent claims costs.
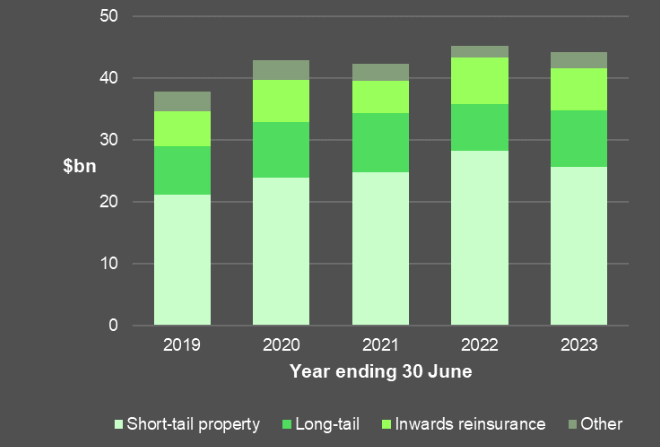
- Overall, gross incurred claims remained relatively high in the year ending 30 June 2024. The slight year-on-year movement was driven by large reductions in both Householders and Fire/ISR as claims stabilised after high expenses from the 2022 south-east QLD/NSW flooding event.
- Net incurred claims increased substantially in the year (16.1%), which was largely due to a reduction in reinsurance revenue across almost all lines of business.
- The industry reported a recovery of investment returns, reaching $3 billion overall. This was mostly driven by unrealised gains from interest-earning investments for year ending 30 June 2024.
- The aggregate industry prescribed capital amount (PCA) coverage ratio increased to 1.74x on 30 June 2024
Australian General Insurance Industry
Underwriting results remained relatively strong, driven by insurers raising premiums in response to recent higher claims costs. Gross incurred claims decreased slightly, due to lower claims in the Householder/Houseowner and Fire/ISR lines of business – both of which saw unusually high peaks in the prior year due to the 2022 south-east QLD/NSW flood event.
The aggregate prescribed capital amount (PCA) coverage ratio for the industry increased to 1.74x on 30 June 2024.
Key performance statistics for the general insurance industry
| 2024 ($bn) | Change (annual) | ||
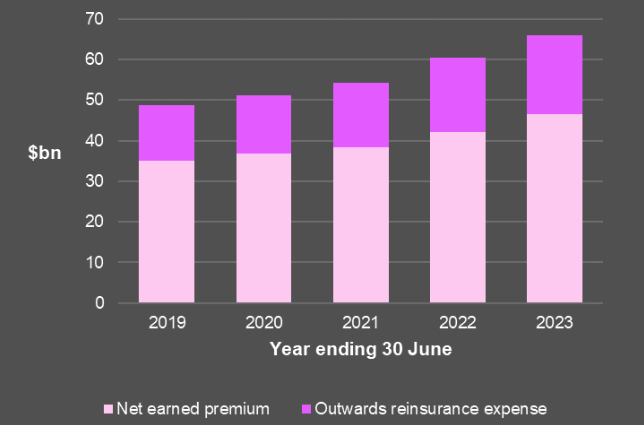
| Gross earned premium | $66.0 | 9.3% | |
| Gross claims expense | $44.1 | -2.3% | |
| Underwriting result | $5.7 | -6.3% | |
| Investment income | $3.0 | – | |
| Net profit after tax | $4.6 | 408.2% |
Key ratios for the general insurance industry
| 2024 | Change (annual) | ||
| Net loss ratio | 65% | 3 percentage points | |
| Return on net assets | 14.2% | 11.2 percentage points | |
| Prescribed capital amount coverage ratio | 1.74x | 0.08x |
The quarterly general insurance institution-level statistics publication contains individual insurer information about financial performance, financial position, capital adequacy and key ratios.
Profitability general insurance
Premiums general insurance and Reinsurance
Insurance Claims
The quarterly performance statistics of insurers may be affected by internal factors, such as the timing of actuarial valuations, and factors outside of their control, such as natural catastrophe events. Users should take these factors into account when interpreting the statistics.
Australian Life Insurance Industry
The quarterly life insurance performance statistics publication provides industry aggregate summaries of financial performance, financial position, capital adequacy and key ratios.
Key performance statistics for the life insurance industry
| 2024 ($bn) | Yearly change | |
| Net policy revenue | 14.7 | 0.0% |
| Investment revenue | 4.8 | – |
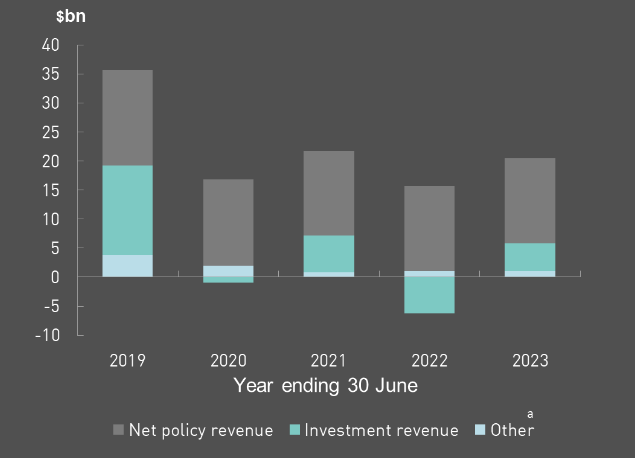
| Total revenue | 20.5 | 116.9% |
| Net policy expenses | 8.5 | -7.3% |
| Operating expenses | 7.6 | 13.6% |
| Effective movement in net policy liabilities | 2.5 | – |
| Total expenses | 18.8 | 103.2% |
| Net profit after tax | 1.2 | 136.1% |
| Total assets | 124.4 | 2.5% |
Statistics for the life insurance industry:
| H1 2024 Quarter ($bn) | 2024 ($bn) | Quarterly change | |
| Net policy revenue | 3.6 | 3.7 | 2.7% |
| Investment revenue | 3.8 | -0.3 | – |
| Total revenue | 7.6 | 3.6 | -52.8% |
| Net policy expenses | 2.2 | 2.1 | -5.1% |
| Operating expenses | 2.1 | 1.8 | -11.8% |
| Effective movement in net policy liabilities | 2.3 | -0.4 | – |
| Total expenses | 6.6 | 3.6 | -46.1% |
| Net profit after tax | 652.3m | 22.3m | -96.6% |
| Total assets | 126.7 | 124.4 | -1.8% |
For the year ending 30 June 2024, the industry reported a net profit after tax of $1.2 billion and a return on net assets of 4.6%.
Revenue life insurance
Profitability life insurance
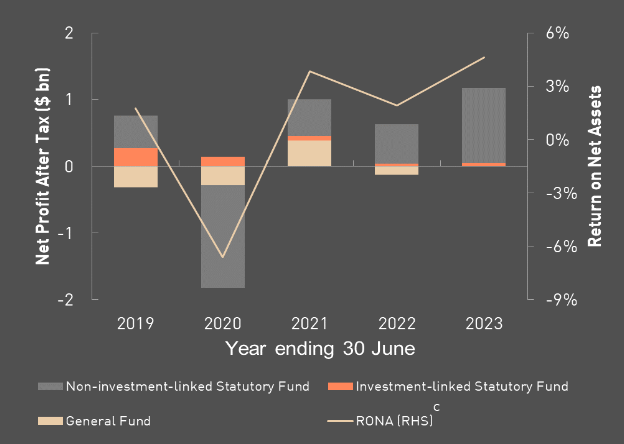
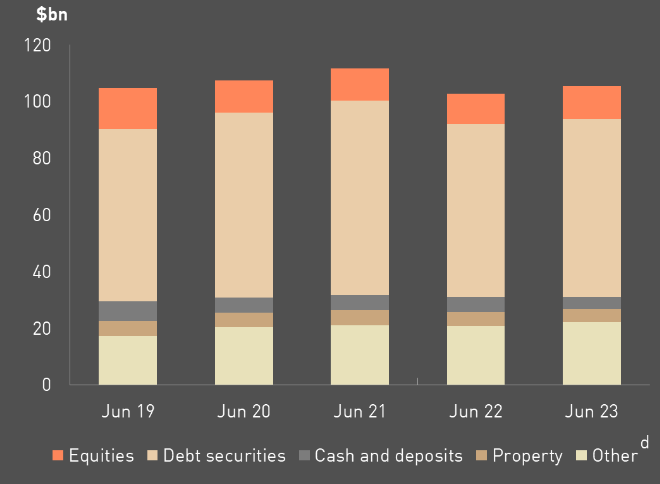
Non-investment linked assets
The aggregate industry prescribed capital amount (PCA) coverage ratio increased to 2.05x over the year ending 30 June 2023.
Net profit after tax by product for the life insurance industry
| Risk product | Year ending 2024 ($m) | 2023 quarter only ($m) |
| Individual lump sum | -367.4 | -659.5 |
| Individual disability income insurance | 237.9 | 12.6 |
| Group lump sum | 420.6 | 560.7 |
| Group disability income insurance | 150.1 | 40.0 |
| Total | 441.3 | -26.2 |
Key ratios for the life insurance industry
| 2023 | H1 2024 | 2024 | |
| Return on net assets | 4.6% | 10.0% | 9% |
| Prescribed capital amount coverage ratio | 2.05x | 2.09x | 2.05x |
Risk products returned a net profit after tax of $441 mn. Individual Lump Sum and Individual Disability Income Insurance (Individual DII) business reported weaker profits in the year, while Group Lump Sum and Group Disability Income Insurance (Group DII) business reported an improvement in performance in the year.
……………………
Edited & Fact checked: