Overview
Inflationary trends in auto liability insurance, personal and commercial combined, drove loss and defense containment costs (DCC) between $96 billion and $105 billion higher than they would have been for the period from 2013 to 2024, according to Insurance Information Institute study.
Throughout this paper, our use of the term inflation reflects the combination of both social and economic inflation, unless otherwise specified. Also, loss amounts reflect dollar values as of their respective accident years and have not been adjusted to a common time period (see U.S. D&O Liability Insurance Continued to Generate Loss).
For personal auto liability insurance, increasing inflation drove loss and DCC higher by $61 billion, or 6.5% of loss and DCC from 2013 to 2024. For the same period, increasing inflation drove commercial auto liability loss and DCC higher by $35 to $44 billion, or between 19% and 24% of loss and DCC.
The Triple-I study extends previous research that used loss development patterns in industrywide insurance data to look for the presence of inflation in excess of economic inflation, defined as “social inflation” (see about Impact of Social Inflation for P&C Insurance & Commercial Auto Insurance).
From 2000 through 2020, economic inflation was relatively stable and close to the Federal Reserve’s two percent target, so increasing loss development factors could be reasonably attributed to social inflation.
Changes in loss development patterns since 2019 can be reasonably attributed to both social inflation and increases in economic inflation, as well as the impact of the pandemic (see How to Reduce the Premium in Car Insurance & Third-Party Liability Insurance?).
Types of Inflation

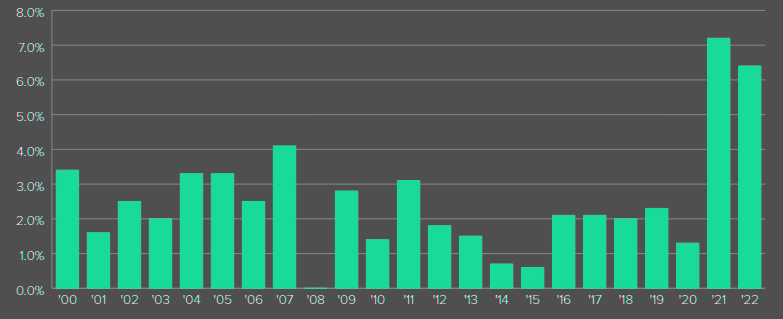
Economic inflation as measured by the Consumer Price Index for all urban consumers (CPI-All Urban) was both low and consistent from 2000 to 2020. It averaged 2.2% per year and never rose above 4.1%.
Insurers, meanwhile, were experiencing an increase in their claim costs, particularly among liability claims, that the economic inflation rate did not capture (see about Impact of Inflation on Insurance Industry).
This was especially true for commercial auto liability insurance, though it seemed to be true elsewhere. To describe it, insurance observers resuscitated the term “social inflation” from the 1970s.
Annual Change in CPI-All Urban
Lynch and Moore’s original study focused on insurance trends through the end of 2019. If inflation is stable, they showed, loss development factors (LDFs) at the industry level should be similar from year to year subject to random variation.
LDFs were steadily rising. Inflationary factors were at work in the insurance industry. Economic inflation couldn’t be the cause. It must be social inflation, they concluded.
It would not be appropriate to conclude that economic inflation alone drove the LDFs higher. Evidence is strong that social inflation was present prior to 2019. It likely persists.
LDFs by themselves do not reveal the source of rising claim costs. This paper will adopt the term “increasing inflation” to address the inflationary phenomena that are driving claim costs higher (see How Insurers Respond to Inflationary Shocks?).
Increasing inflation has two parts: economic inflation as shown by the CPI-All Urban; and social inflation, which here will be taken to mean “inflation in claims higher than the economic inflation rate as represented by the CPI-All Urban.”
The underlying costs that insurers face are subject to a number of inflationary factors. Some of these underlying costs increased more than economic inflation as measured by the CPI-All Urban. This replacement cost index reflects a basket of goods and services directly impacting insurance loss costs.
Increase in CPI-All Urban and Auto Replacement Costs
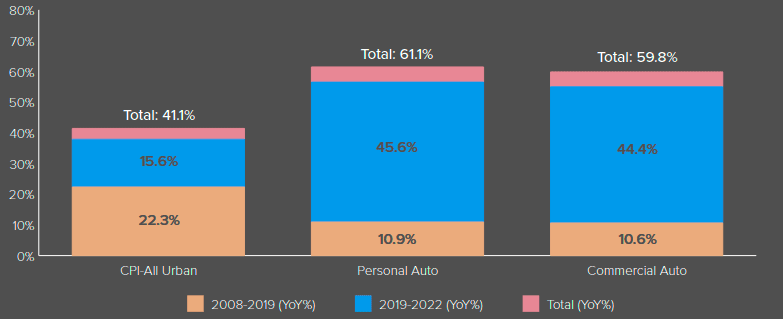
Since 2008, replacement costs for both commercial and personal auto insurance have risen 40% more than prices overall. The timing of that difference is important to note. From 2008 to 2019, overall prices rose more than twice as fast as auto replacement costs. Since then, replacement costs have risen almost three times faster than overall prices.
The vast differences from era to era show how different the inflation insurers face can be from what the general public sees. They also show that in recent years, inflation pressures on insurance costs have grown significantly.
Inflationary factors that drive insurance claims can exceed the economic inflation rate, sometimes substantially. Whether one considers that particular source of inflation to be social inflation or economic inflation is an interesting, perhaps important discussion. The tools we use do not distinguish among them.
Regardless of the source, inflated claim costs are the cause of recent increases in auto insurance prices and attract the attention of consumers, regulators, and insurers.
Commercial Auto Liability
This section extends previous analyses of commercial auto liability insurance through year-end 2022 using similar methodology and exhibits. We monitor net earned premium and losses and DCC by accident year, both of which we standardize by nominal GDP.
The standardization process gives us insights into trends in rates (increase in standardized premium suggests increasing rates) and loss trends (increase in standardized losses and DCC suggests increasing losses).
Then we examine trends in loss development factors. We focus on the 12-60 calendar year loss development factor (CYR 12-60 LDF) as described in previous analyses and described in greater detail below. Rising loss development factors suggest increasing inflation.
The 2023 year was the highest since 2004. Premiums as a share of GDP have risen 10 consecutive years and are 46% higher than they were a decade earlier.
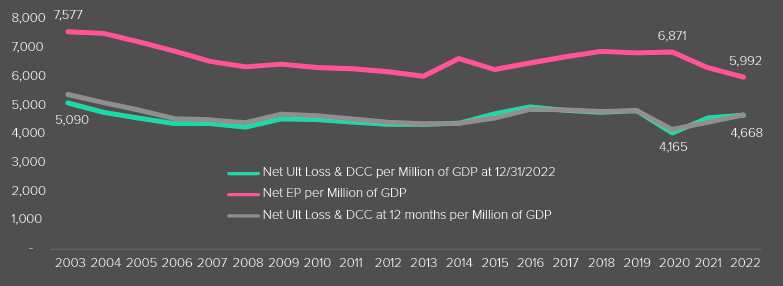
Net Earned Premium (EP) and Ultimate Loss and DCC to GDP (in $ mn) by Accident Year–P&C Industry
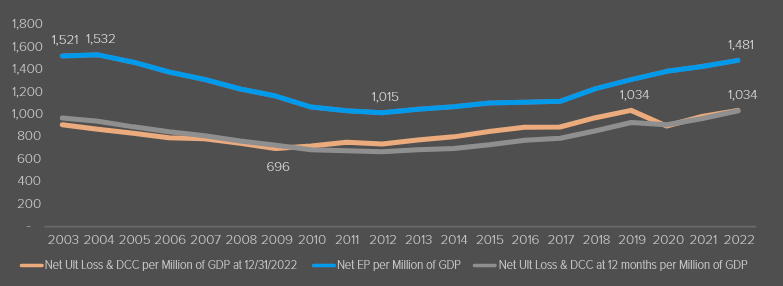
Loss and DCC are 49% higher than at their low point in 2009, according to the most recent evaluation of accident years. This means that losses are rising faster than overall inflation and the economy overall. Standardized losses dipped in the first pandemic year (2020) and immediately began rising again in 2021.
Accident year 2022 standardized losses are roughly the same as the peak year of 2019. The consistent upward revision of accident year estimates from 2010 and 2019 suggests that estimates of more recent years may soon rise as well.
The pattern we documented in earlier work continues. Rising losses force premiums higher two to three years later. The two- to three-year lag has two primary elements: the time that insurers need to identify their recent loss trends; and the time necessary to implement rate changes, which often require regulatory approval.
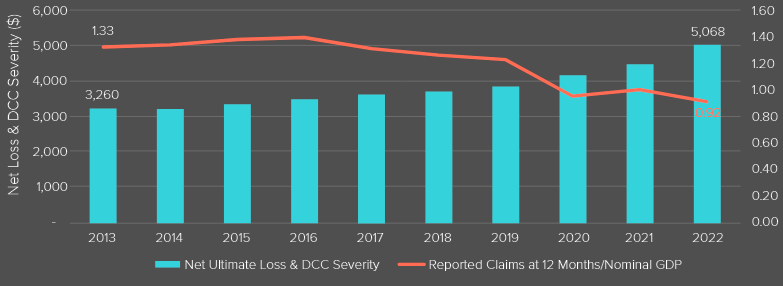
Change in Reported Claim Frequency and Net Ultimate Loss & DCC Severity by Accident Year—P&C Industry
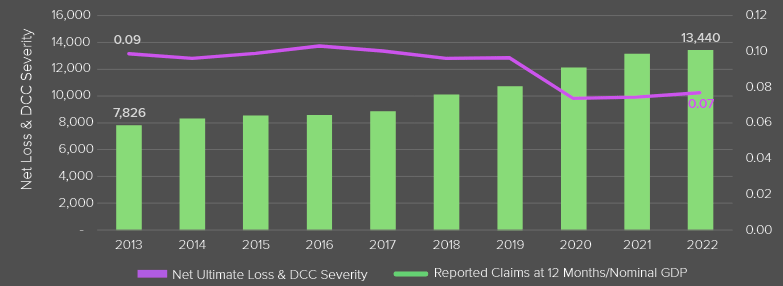
Claim frequency fluctuated from 2013 through 2019 within a narrow range: 9.6 to 10.3 claims per $100 million GDP. It fell 23% in 2020, presumably as a result of the pandemic. It has risen slightly through 2022 but remains significantly lower than the pre-pandemic years.
Claim severity has risen 72% since 2013, for a compound annual growth rate of 6.2%. The median increase was 6.3%, with spikes in 2018 (14%) and 2020 (13%).
Four of the last five years exceeded the median increase, a sign the process may be accelerating. It can be noted that the most recent year, 2022, was the single year the increase fell under the median.
It should also be noted that the estimates for each year are subject to revision, as insurers re-estimate the ultimate losses for each accident year. This re-estimation typically affects the most recent years the most, and insurers have consistently underestimated losses in this line.
By comparison the Consumer Price Index has risen 27% since 2013, a compound annual inflation rate of 2.7%. The median increase was 2.1%.
This suggests that the growth in the average auto claim has nearly tripled economic inflation in that period.
For the last seven accident years before the pandemic, re-estimation has increased losses by 13% from first report to the 2022 evaluation. Given this record, it is reasonable to assume that 2021 and 2022 accident year losses will develop higher than shown here. Claim severity would follow suit.
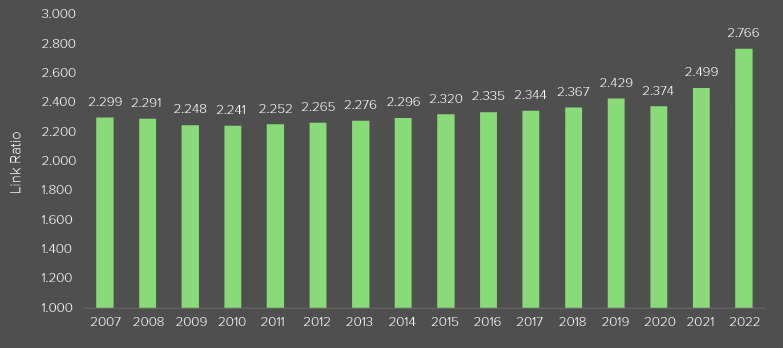
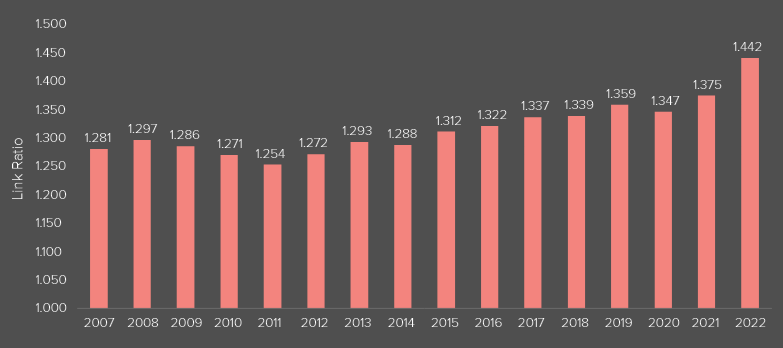
Net Paid Loss & DCC Link Ratio–P&C Industry
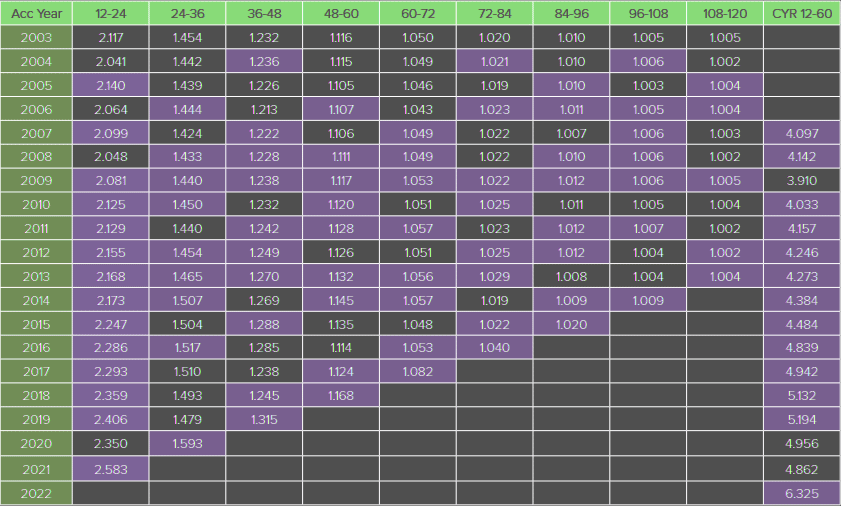
Table shows paid loss development factors for Accident Years 2003 through 2022. LDFs are given through 120 months. The final column is the Calendar Year LDF for months 12 through 60 (CYR 12-60 LDF). It is the product of the link ratios from 12 through 60 months for that calendar year.
For example, CYR 12-60 LDF for 2022 is 6.325. That number is the product of the first four LDFs along the diagonal of LDFs generated in 2022: 2.583*1.593*1.315*1.168.
Net Paid Loss & DCC CYR 12 – 60 Loss Development Factors—P&C Industry
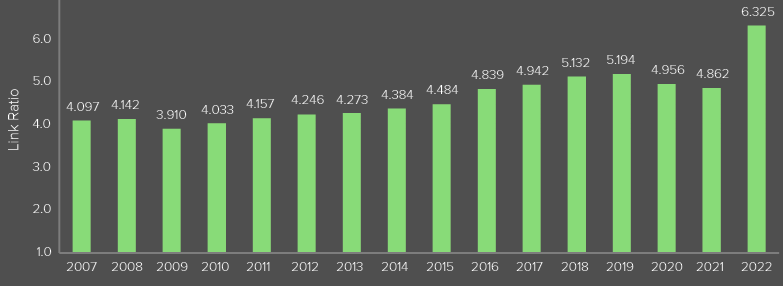
Rising LDFs are indicative of increasing social inflation, absent evidence of any other exogenous factors. Since 2019, there may be two other factors at work. Increasing economic inflation, as discussed previously, is one. A slowdown in claims handling brought on by the pandemic may be another.
The commercial auto liability paid loss triangle exhibits behavior consistent with a one- or two-year slowdown in claims precipitated by a slowdown in the legal system.
Factors decline for all development periods except the first in calendar year 2020, and the CYR 12-60 LDF declines. The CYR 12-60 LDF declines in 2021 as well, though the factors applying to older years increase.
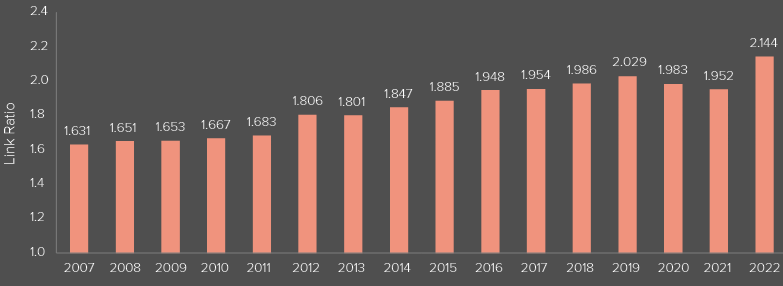
Net Case-Incurred Loss & DCC CYR 12 – 60 Loss Development Factors—P&C Industry
The increasing inflation increased losses from 2013 to 2022 in commercial auto liability by between $35 billion and $44 billion, or between 19% and 24%. This is higher than the range from our 2022 review of losses from 2012 to 2021, $30 billion to $35 billion and 18 to 20%.
The increase is attributable to:
- Adverse development for the Accident Years 2015 to 2021, reflecting continued inflationary pressures. Ultimate losses for those years rose $2.1 billion at the year-end 2023 evaluation.
- The 10-year lookback period drops Accident Year 2012 and adds 2022. Accident Year 2012 was less affected by inflationary pressures as that year was closer to the comparison point of 2008.
Case-Incurred Estimate of Impact of Increasing Inflation by Year—P&C Industry
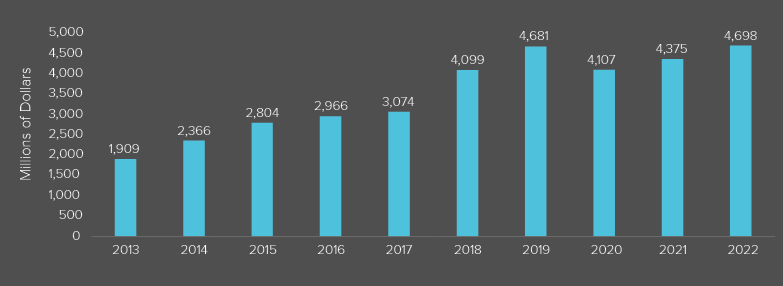
The impact of increasing inflation has grown steadily, with the exception of the pandemic years. The 2023 impact is estimated at $4.7 billion, which is 18% of booked losses. The paid estimate yields a similar result, with increasing inflation growing until the estimate shows a $7.9 billion impact for Accident Year 2023.
Conclusions for commercial auto liability
- Losses continue to grow faster than the overall economy.
- Low, steady economic inflation prior to 2021 implies that increasing social inflation forces were the primary influence for that period.
- The pandemic disrupted the pattern in 2020.
- After that, growing losses may be caused by increasing economic inflation, increasing social inflation or a combination of the two.
- The average size of loss – claim severity – increased dramatically with the pandemic. At the same time the accident rate – frequency – declined. Frequency flattened in 2022, but severity continued its increase. Severity rose more than frequency declined, leading to higher losses overall.
- Loss development factors indicate inflationary factors continue to plague this line of business. Prior to 2020 social inflation was a primary factor. Increasing inflation increased losses from 2013 to 2022 by between $35 billion and $44 billion, or between 19% and 24%.
Personal Auto Liability
This section applies the above analysis to personal auto liability. Lynch and Moore presented similar data on personal auto liability in previous research but did not comment on the presence or absence of social inflation.
Although they seem similar, commercial auto liability and personal auto liability have important differences that can affect losses and development factors.
- Vehicles insured by personal auto liability are, on average, smaller. The line doesn’t insure dump trucks, delivery trucks or semi-trucks. Elementary physics shows that smaller vehicles cause less damage than larger ones. This would tend to result in lower insured losses in equivalent scenarios.
- Personal auto policyholders buy lower policy limits than commercial auto policyholders. The typical personal auto limit is $60,000 to $100,000. The typical commercial auto limit is $1 million. The lower limit means claims settle faster as there is less money at stake in any dispute. It also means that multimillion dollar settlements are infrequent and have less impact on insured losses or development patterns.
- For many policyholders, personal auto is the sole insurance protection for auto risks. Commercial enterprises often buy excess or umbrella policies that provide protection for claims that settle above the limit of the commercial auto policy. These losses are usually classified as Other Liability losses and do not directly affect losses in the commercial auto liability line. Excess policies put more money at stake in a contentious claim, which gives parties less incentive to settle quickly. This will increase the average size of a commercial auto liability claim and lengthen development patterns, compared with personal auto liability.
- Personal auto policies are purchased by individuals, most of whom have relatively modest means. Many commercial auto policies are purchased by corporations. Some of those corporations are quite large and well-capitalized. If a settlement exceeds all limits available through all policies, the claimant can still recover from the corporation’s store of capital. This creates further incentives to lengthen negotiations and maximize commercial auto insurance payouts.
The business of personal auto liability insurance is also many times larger than commercial auto. Personal auto liability had $152.6 billion in net earned premiums in 2022, four times as much as commercial auto liability.
It is also subject to more scrutiny from regulators and non-industry elements like the news media and consumer advocates. The size and homogeneity of the line, combined with the scrutiny it receives mean a wealth of complementary information is available. We supplement our analysis with that information where warranted.
Standardized personal auto liability premium fell 21% from 2003 to 2022. Personal auto insurance premiums are a much smaller share of the general economy than they were two decades ago, implying that personal auto insurance has gotten considerably less expensive relative to other goods and services. By contrast, commercial auto liability has fallen 2.6% in that period.
Net Earned Premium (EP) and Ultimate Loss and DCC to GDP (in $ mn) by Accident Year—P&C Industry
Losses and DCC have also fallen relative to the economy, but not as much – 8.3% from 2003 to 2022 as of the most recent evaluation.
The long-term decline masks short-term trends. Since Accident Year 2020, standardized premium fell 13%, while losses rose 15%.
A business where losses are climbing while prices are falling is unsustainable. Insurers have been raising rates in response to increasing inflation.
To better understand personal auto liability frequency and severity trends, we supplement Annual Statement data with analyses of data compiled by Fast Track, a service provided through Insurance Services Office. Fast Track data separates auto liability data into distinct coverages – bodily injury, property damage and personal injury protection – and has robust exposure data. Data from multiple companies are standardized.
Data are direct – before reinsurance cessions – and subject to rigorous scrubbing for errors and omissions. It is also compiled quarterly, giving more recent and nuanced information.
The Fast Track data defines claim frequency as paid claims per 100 earned car-years. Loss severity is defined as paid losses – excluding defense and claim handling costs – divided by the number of claims.
We find that Annual Statement and Fast Track data yield similar insights:
- Both data sources show claim frequency fell at the onset of the pandemic. Both sources show frequency remains below long-term trends. Fast Track data provides additional insight into trends from quarter to quarter.
- Both sources show claim severity rose steadily until 2019, then accelerated.
Reported Claim Frequency and Net Ultimate Loss & DCC Severity by Accident Year—P&C Industry
As with commercial auto liability, claim severity rose steadily until 2019, then accelerated. The personal auto liability claim severity compound annual increase was 3% from 2013 to 2019, then tripled to 9.2% compounded annually from 2019 to 2022.
Frequency and Severity, Property Damage (PD) Coverage
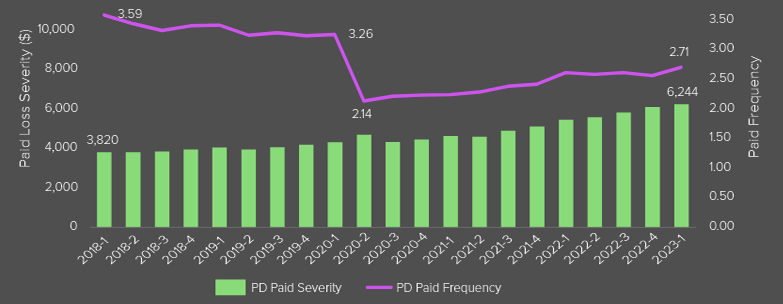
Severity rises at a 6.4% annual rate compounded until the beginning of the pandemic. Since then, it has risen at a 13% annual rate.
Frequency and Severity, Bodily Injury (BI) Coverage
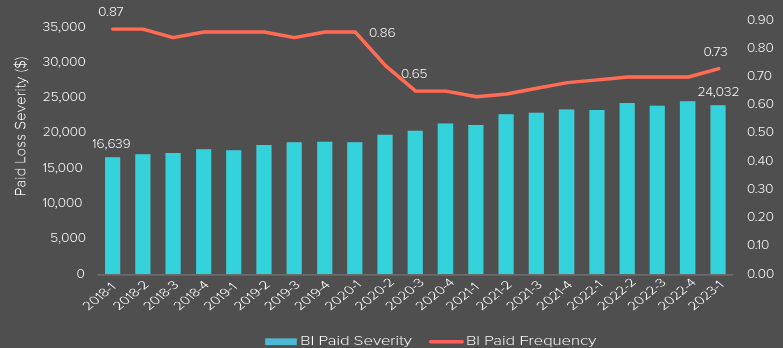
The trends are similar to trends reported by the Insurance Research Council (IRC). That organization also analyzed data on paid losses and exposures compiled by Fast Track.
Severity rises at a 6.3% rate compounded until the beginning of the pandemic. Since then, it has risen at an 8.5% annualized rate.
IRC found that growth in bodily injury and property damage severity accelerated in the mid-2010s. Property damage claim severity grew at an annualized 2.2% rate from 2002 to 2012. That rose to 4.8% annualized from 2012 to 2019, then rose at a 12.2% annualized rate during the pandemic years. The acceleration is attributed to the rising cost of auto parts.
Bodily injury claim severity exhibited similar behavior. It grew 3.2% annualized from 2002 to 2015, 4.6% annualized from 2015 to 2019 and 8.8% annualized from 2019 to 2022. The acceleration is attributed to “higher medical utilization, more expensive diagnostic procedures, cost shifting from other sources of compensation, and increased attorney involvement.”
Net Paid Loss & DCC CYR 12 – 60 Loss Development Factors—P&C Industry
On a case-incurred basis, from 2013 to 2022 actual emergence averaged about 8% higher than predicted – 8.4% from 2013 to 2022. Case-incurred actual emergence in 2022 was more than $5.7 billion above the expected emergence.
For paid losses, three of the latest four years had the worst actual vs. expected emergence variance in the decade. For paid losses, 2019 and 2021 had actual emergence exceeding expected by more than 5%. In 2022, actual emergence exceeded expected by 19%. Before 2019, emergence hadn’t exceeded estimated by more than 3.2%.
Net Case-Incurred Loss & DCC CYR 12 – 60 Loss Development Factors—P&C Industry
Case-incurred actual emergence exceeded expectations by more than 7% in 2019, 2021 and 2022. Unlike the paid emergence, case-incurred emergence in 2019 and 2021 was not out of line with prior years.
2020 emergence was very close to expectations. In 2022, actual emergence exceeded expectations by more than 20% – twice as high as any other year.
The impact on personal auto liability is smaller on % basis than on commercial auto liability, where the impact is between 18.8 and 23.6%. Personal auto claims settle faster for reasons cited above; smaller private passenger vehicles on average cause less damage than larger commercial vehicles. Lower policy limits and the lack of well-capitalized defendants result in faster settlements.”
Conclusions for personal auto liability
- Though both have fluctuated over the past 20 years, premium and losses have grown more slowly than the overall economy. In recent years, losses have been growing faster than premium. Since Accident Year 2020, standardized premium fell 13%, while losses rose 15%.
- Severity increased dramatically after 2019. The compound annual increase was 3.0% from 2013 to 2019, then tripled to 9.2% compounded annually.
- Increasing inflation raised losses $61 billion or about 6.5% higher than they would have been for the years 2013 to 2023. Inflation increased sharply in 2021 and 2023.
Conclusions: inflation has driven auto losses
Combined, increasing inflation has driven personal and commercial auto losses higher by between $96.1 billion and $105.2 billion from 2013 to 2023. That is between 8.6% and 9.4% of $1.1 trillion of booked losses in that period.
The impact on personal auto is greater than on commercial auto in absolute dollars (more than $60 billion vs. $35.1 billion to $43.9 billion) but not as great on % basis (about 6.5% vs. between 18.8 and 23.6%).
For both personal and commercial auto liability lines, social inflation was the main source of increasing inflation before 2021. For 2021 and later, increasing inflation came from a combination of economic inflation and social inflation.
There is evidence of a slowdown in claims payments in calendar years 2020 and 2021, likely triggered by slowdowns in court cases and other effects of the pandemic.
The average annual impact of increasing inflation is approximately 0.6% per year for personal auto liability and between 2.3% and 2.7% for commercial auto liability.
Personal auto liability typically has lower policy limits than commercial auto liability, insures smaller vehicles on average, and doesn’t cover well-capitalized corporations. All of these make the impact of increasing inflation lower in personal auto on a%age basis. The dollar impact on society is greater than that of commercial auto because personal auto is so much larger.
This estimate is likely understated because it does not capture the impact of increasing inflation that occurs in the first 12 months of an accident year. That understatement likely affects personal auto liability, with its shorter development tail, more than it affects commercial auto liability.
Actuarial techniques can document a phenomenon like inflation, but generally offer less insight into what causes underlie the phenomenon. Economic analysis could shed further light on the causes of increasing inflation, including a deeper exploration of interactions between social inflation, economic inflation, and other intermediary variables.
FAQ
Inflationary trends, including both social and economic inflation, caused an increase in DCC by $96 billion to $105 billion over this period.
Inflation drove personal auto liability loss and DCC higher by $61 billion, representing a 6.5% increase.
Social inflation refers to the rise in claim costs exceeding economic inflation. It was a key driver of increasing loss development factors (LDFs) before 2020 and remains influential.
Auto replacement costs have risen 40% more than overall prices since 2008, contributing to inflationary pressures on insurance losses.
From 2013 to 2023, increasing inflation raised commercial auto liability losses by $35 billion to $44 billion, or 19% to 24%.
Personal auto liability typically involves smaller vehicles and lower policy limits, leading to lower losses and quicker claim settlements compared to commercial auto liability.
Rising inflationary factors, including social and economic inflation, have driven up claim costs, leading to higher auto insurance prices.
……………….
AUTHORS: James Lynch – FCAS, MAAA, Triple-I’s former chief actuary; Dave Moore – FCAS, MAAA, president, Moore Actuarial Consulting; Dale Porfilio – FCAS, MAAA, Triple-I’s chief insurance officer.