Overview
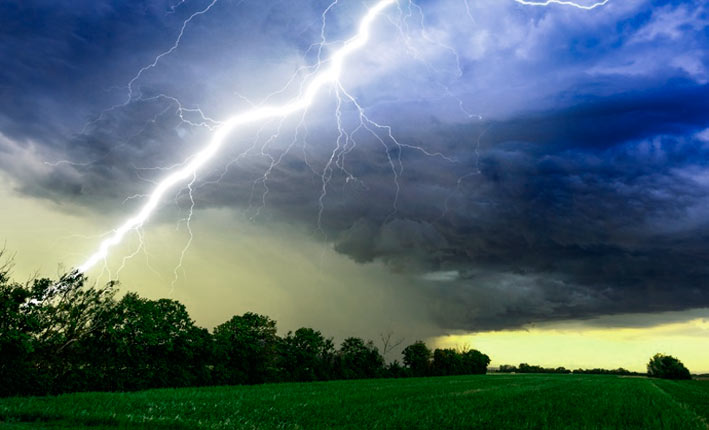
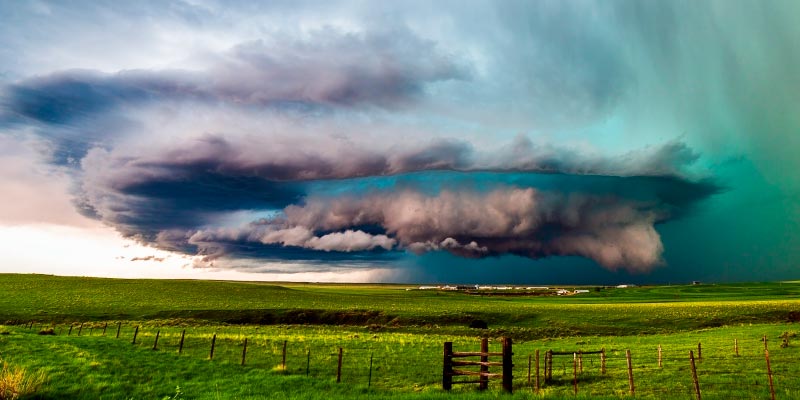
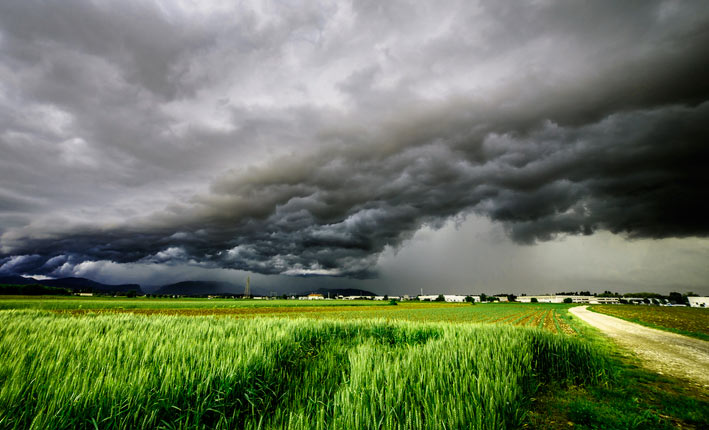
Severe convective storms are among the most common, most damaging natural catastrophes in the United States. The result of warm, moist air rising from the earth, they manifest in various ways, depending on atmospheric conditions – from drenching thunderstorms with lightning, to tornadoes, hail, or destructive straight-line winds. Recent years have seen an increase in organized lines of thunderstorms with widespread damaging winds, known as derechos.
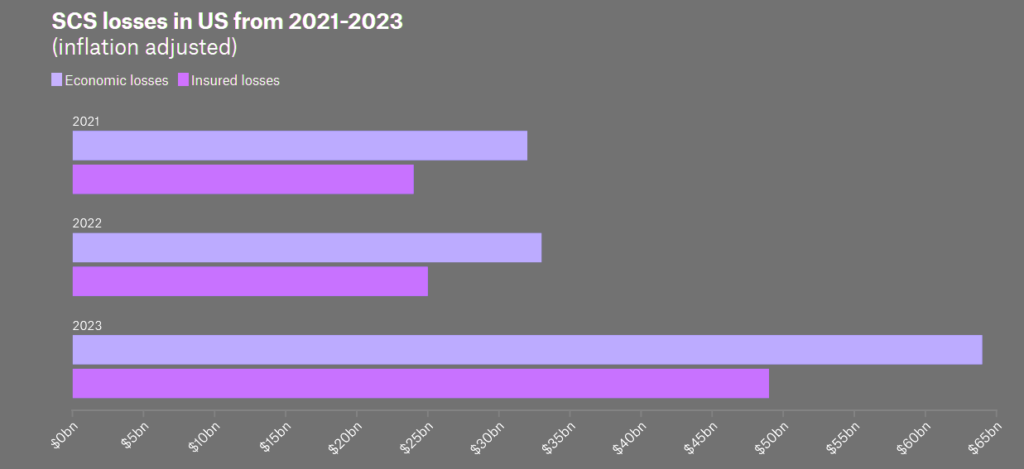
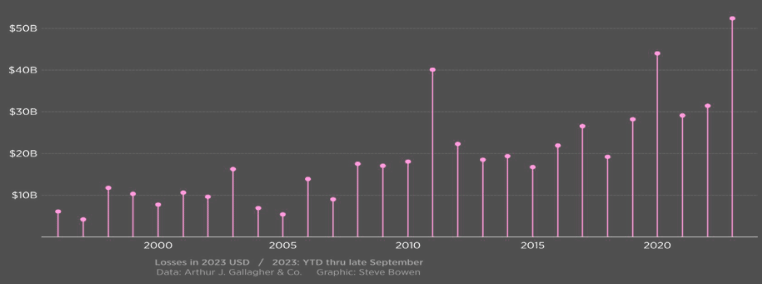
The U.S. is experiencing its costliest year ever in 2023 for severe convective storms, with insured losses from these events exceeding $50 bn through the October, according to the Insurance Information Institute.
Convective Storms in the U.S. outlook
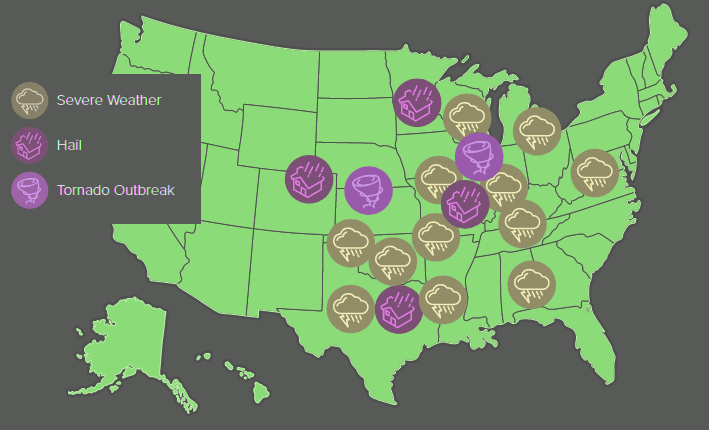
Tornadoes in Arkansas, Illinois, and Mississippi caused a significant loss of life and property damage in 2023 (see Worldwide Severe Convective Storms: Listing of Global Events & Economic Loss).
Severe convective storms include natural catastrophes such as thunderstorms with lightning, hail, tornadoes, and derechos, which are organized lines of thunderstorms with widespread damaging winds.
They were followed by this summer’s intense hailstorms in Colorado and Minnesota, among other states, according to NOAA.
U.S. auto, home, and business insurers cover insured properties impacted by wind, hail, and lightning-caused fires.
Top 10 Costliest Hurricanes In The United States by insured losses
| Rank | Hurricane | $ mn when occurred | In 2023 $ mn |
| 1 | Hurricane Katrina | $65,000 | $98,727 |
| 2 | Hurricane Ian | 52,500 | 52,500 |
| 3 | Hurricane Ida | 36,000 | 39,256 |
| 4 | Hurricane Sandy | 30,000 | 38,688 |
| 5 | Hurricane Harvey | 30,000 | 36,450 |
| 6 | Hurricane Irma | 29,550 | 35,714 |
| 7 | Hurricane Maria | 29,500 | 35,654 |
| 8 | Hurricane Andrew | 16,000 | 33,875 |
| 9 | Hurricane Ike | 18,200 | 24,815 |
| 10 | Hurricane Wilma | 10,666 | 15,973 |
Flood-caused damage to private-passenger vehicles is covered under the optional comprehensive portion of a personal auto insurance policy.
$50 bn loss for a single peril is a big deal. In fact, the U.S. has had six years since 2010 where all annual catastrophe losses combined did not reach this threshold
Steve Bowen, chief science officer, Gallagher Re
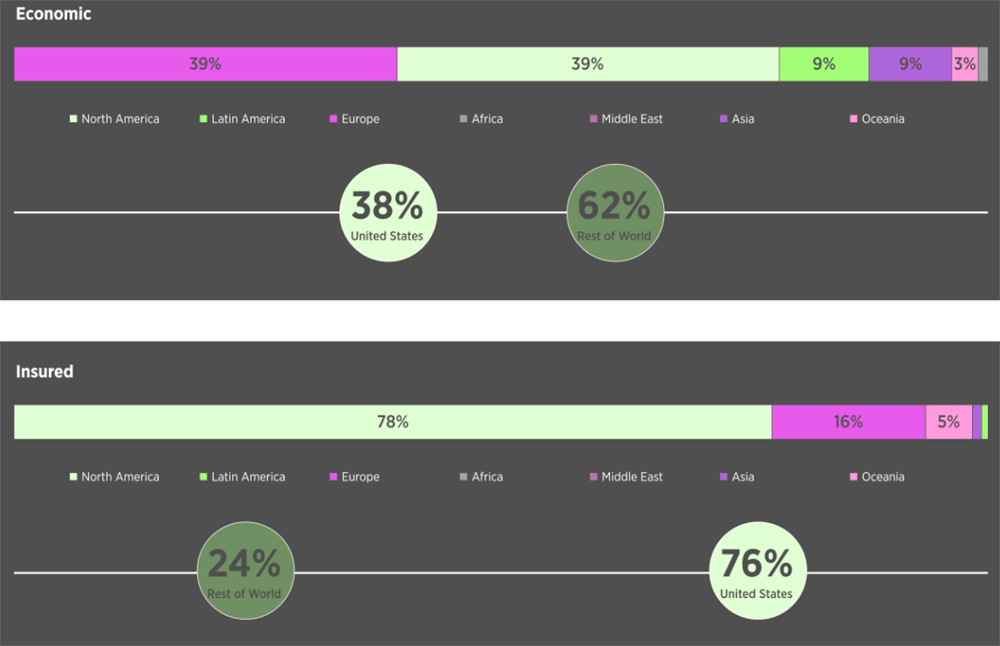
The higher dollar amount of the insured losses can be attributed in part to these events striking densely populated U.S. communities, the site of homes and commercial buildings which are costly to repair and replace, a Swiss Re study cited by Triple-I found.
Severe convective storms are one of the most common and most damaging natural catastrophes in the United States.
Loss-drivers of increased SCS losses
90% ↑ in economic losses YOY 2022-2023
The 2023 weather and climate disasters causing at least $1 billion in damage, both insured and uninsured, are chronicled by the federal government and featured in a chart Triple-I (Severe Thunderstorms the Main Driver for Insured NatCat losses).
U.S. Severe Convective Storms: Insured Loss
What’s driving 2023 losses?
According to Gallagher Re report, 2023 has been an above-average year from a frequency perspective. The year started with lingering La Niña conditions in the Pacific that tend to drive an earlier start to severe convective storm activity. Record warmth in the Gulf of Mexico has helped fuel these conditions.
Most of the 2023 events have affected populated areas.
Illinois has the highest number of recorded tornadoes in the country this year, beating out states like Texas and Oklahoma that traditionally top the nation.
Illinois began experiencing severe storms early, with tornadoes being recorded in January, February and March (see Main Factors of the Increase in Insurance Losses from Natural Disasters).
Hail and wind-related hazards drove most second-quarter losses, according to Gallagher Re, including “hundreds of instances of very large hail” that inflicted significant losses in densely populated areas around the Dallas-Fort Worth metroplex in Texas and Hot Springs in Arkansas, among other locations.
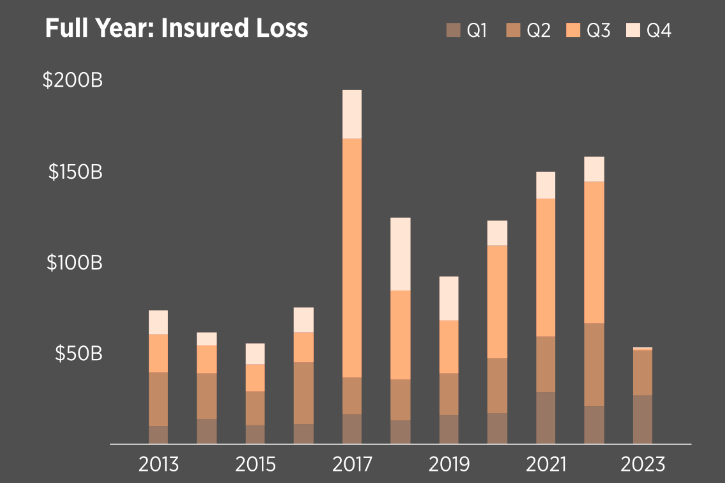
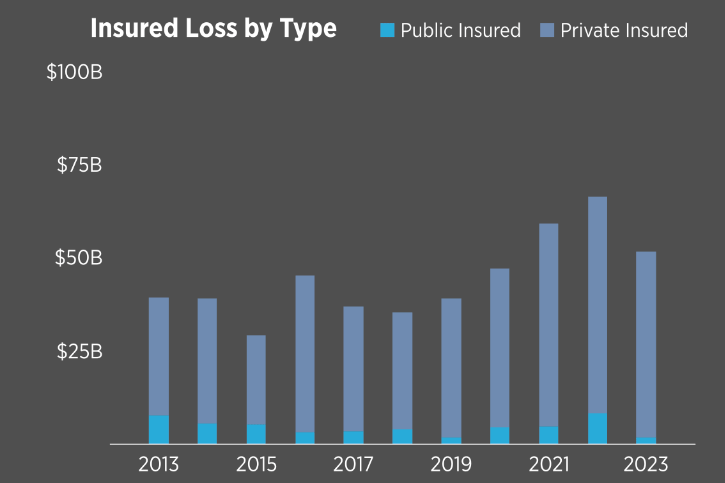
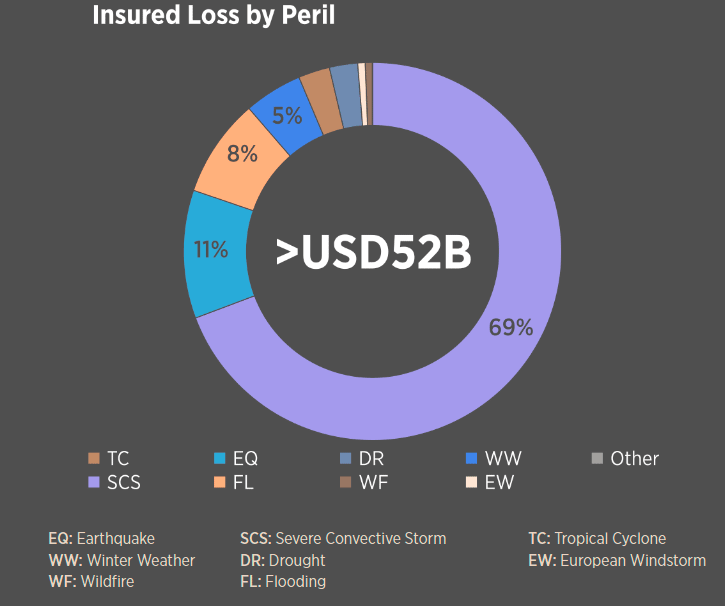
Insured losses by type and perils, 2013-2023
In June alone, there were at least 349 reports of hail reaching and exceeding 2.0 inches across the United States and 89 reports of hail exceeding 3.0 inches. During the month, hail that approached or exceeded 4.0 inches pelted localities in at least 10 states.
The effect of high prices has been to increase the nominal value of buildings, vehicles, and other insurable assets, in turn pushing up insurance claims for damage caused by Mother Nature.
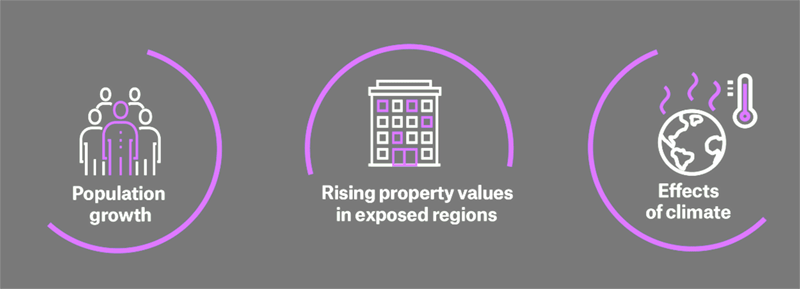
Rather than the physical destructive force of natural catastrophes themselves, a recent study by Swiss Re finds the main driver of high losses in recent years to be “economic growth, accumulation of asset values in exposed areas, urbanization and rising populations – often in regions susceptible to natural perils.”
2023 U.S. Billion-Dollar Severe Convective Storms
The most immediately visible impact has been in the construction sector, where increases in material and labor costs have led to costlier repairs and higher claims, according to Swiss Re report.
There is a need for greater discipline in the monitoring of the loss-driving secondary peril exposures and industry sharing of related findings. Lack of granular exposure data can also hinder understanding of all present-day risks.
For example, Swiss Re points to the rising presence of solar farms and roof-mounted solar panels in areas susceptible to severe convective storms.
Solar and wind energy projects are especially vulnerable because they often cover large surface areas and are concentrated in regions with significant severe convective storm activity.
Top 5 states for insured SCS loss

In 2019 a hailstorm caused $70 million in damage to a solar energy project in Texas.
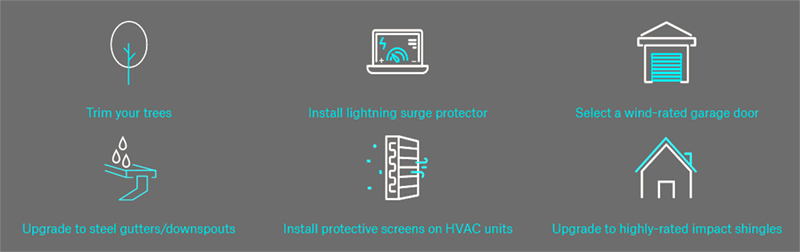
Steps to reduce damage from SCS
The fast rate of change of such variables necessitates shorter update cycles of data sets and models, to mitigate risk accumulation and underestimation of loss trends.
Insurance, Mitigation & Resilience: What to do?
The National Institute of Building Sciences found that every $1 spent on hazard mitigation can save the nation up to $13 in future disaster costs. How can individuals, communities, and businesses get ahead of risks that seem so capricious and whose costs can vary so wildly? How are risk managers and insurers integrating convective storm resilience into their strategies and operations?
Secure the property, build in resilience
When managing risksrelated to wind, water, and fire, it’s important to make sure property and buildings are well constructed and maintained and that any objects that might become projectiles in high wind are secured – especially in areas where tornadoes or destructive straight-line winds tend to arise suddenly. Likewise, in hail-prone areas it is important to put vehicles and equipment that could be damaged under cover.
Identify damage quickly
Because wind and hail can exposestructures to further damage due to water seepage or animal intrusion, it’s important to detect damage from these events as early as possible. Historically, it has been difficult, time-consuming and dangerous for insurance adjusters to get up onto every insured building in an area affected by convective storms in order to look for damage. Advances in aerial imagery are helping to address this deficit. Whether using drones, manned aircraft or satellite technology, it is getting easier, safer, and less expensive to assess rooftop damage due to convective storms.
Evolving insurance approaches
As a result of significant storm-related losses in recent years, some insurers are obligating policyholders to take on increased risk-sharing of storm losses through deductibles. For each loss paid by the insurer, the policyholder contributes dollars through the application of a deductible.
Another emerging approach is parametric insurance
A parametric policy pays a fixed amount if an event that meets agreed-upon criteria (a certain wind speed, for example) triggers the policy, regardless of whether the policyholder’s property is damaged. Parametric policies cover risks without the complications of sending adjusters to assess damage post-catastrophe. Speed of payment and reduced policy administration costs may ease the burden on both insurers and policyholders.
Economic and Insured Losses
The economic drivers of the U.S. P&C insurance industry
The economic drivers of the U.S. property & casualty insurance industry could cumulatively expand faster than the nation’s gross domestic product (GDP) in 2024 and may outperform the overall U.S. economy by 2025.
The US P&C insurance industry continued to generate significant underwriting losses in 1H2023 despite strong premium growth. Results are anticipated to improve in 2H2023 as pricing increases continue to take hold, but uncertainty remains regarding future catastrophe losses, effects of inflation on loss costs, and loss reserve experience.
Growth drivers specific to P&C performance have been improving faster in 2023 than the rest of the U.S. economy, after underperforming the wider economy three years in a row
Michel Léonard, chief economist and data scientist, Triple-I
Triple-I forecast P&C growth of 2.1% in 2023, slightly above our earlier expectation of 1.9%. This confirms expectation from January 2023 that the gap between P&C and overall growth would continue to narrow this year.
P&C underlying economic growth should continue to improve over the next three years, potentially outperforming the wider economy by 2025.
The underlying economic growth of P&C insurers, who write and sell auto, home, and business insurance, is impacted by replacement costs (e.g., the prices of construction materials, auto parts), consumer and corporate spending, interest rates, and U.S. employment trends, among other variables.
……………….
AUTHOR: Steve Bowen – chief science officer, Gallagher Re, Michel Léonard, Ph.D. – CBE, chief economist and data scientist, Triple-I
Reviewed by Oleg Parashchak — CEO & Owner Finance Media Holding