Overview
TradingView charts, when used with a deep understanding of technical analysis, disciplined strategy implementation, and continuous learning, can significantly enhance the decision-making process in trading, leading to more informed and potentially profitable trades.
TradingView is well known for its easy-to-use interface, refined charting strategies, and a wide variety of technical indicators.
Whether you are a novice or a seasoned trader, harnessing the capabilities of TradingView charts can immensely impact your trading journey.
The multitude of options available on TradingView can help you as a trader to amplify your investment strategies and make informed decisions.
What does TradingView do?
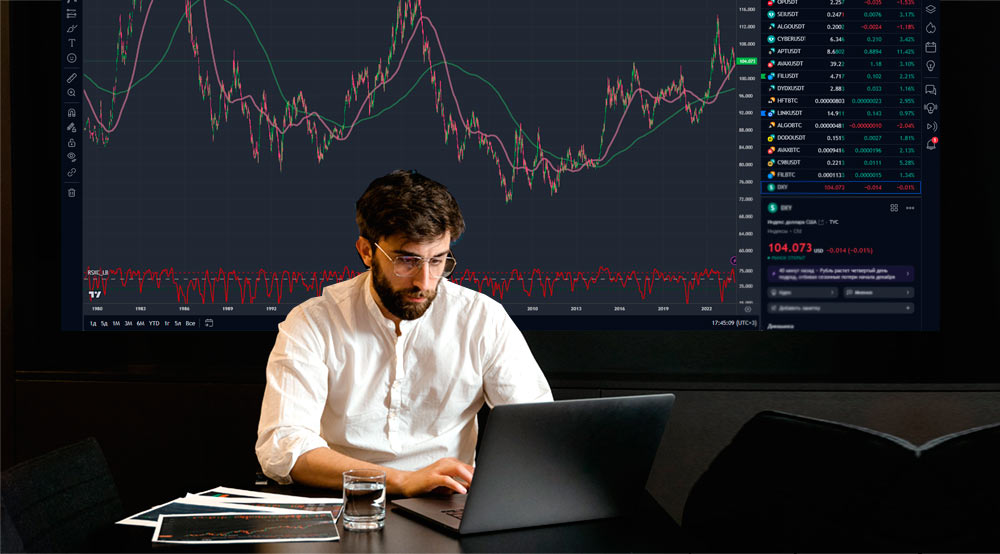
TradingView charts are easy to access and browser-based. The charting platform assesses all assets, financial instruments, and cryptocurrencies traded globally. It tracks the price of all these assets and financial instruments on a real-time basis.
One of the best things about TradingView is the tool options it presents. The tools are free and accurate. They are available to and used by all levels of traders.
For most traders, the TradingView charts are the go-to option. Nowadays, in fact, they are integrated with most investing platforms for quick access to price charts. This has made tracking the market and understanding price action much, much easier.
Use TradingView Charts for Smart Trading Decisions
As a professional investor and trader, leveraging TradingView charts for smart trading decisions requires a blend of technical skill, market insight, and disciplined strategy.
Effective risk management is the cornerstone of successful trading. Utilizing stop-loss orders, understanding position sizing, and having a clear risk-to-reward ratio for each trade is imperative.
This discipline helps in preserving capital and ensuring longevity in the trading profession.
Below are a few ways to make smarter trading decisions using the TradingView platform.
1. Backtest Trading Strategies
You can create and test your trading strategies on TradingView using features such as “Pine Script”. Using historical data to backtest different strategies on the trading view platform can provide insights.
These insights can be used to identify the weaknesses and refine strategies.
Backtesting is useful to test the effectiveness of a particular strategy before implementing it in your trades. You can assess the opportunities in lieu and minimize the risk of losses.
Use TradingView’s paper trading feature to develop and backtest strategies. Whether you’re a swing trader, day trader, or scalper, testing your strategies in simulated environments helps refine them without financial risk.
2. Free Chart Customization
You can utilize TradingView free chart analysis to identify trends, support and resistance levels, and potential reversal patterns. TradingView offers an array of customizable drawing tools like trendlines, Fibonacci levels, timeframes, etc.
These enable you to mark vital price levels, trends, and patterns on charts. It can help you visualize chart patterns like head and shoulder and double tops using drawing tools.
The recognized patterns often indicate future price movements and enable traders to make smart decisions.
3. Comparison Between Different Securities
TradingView also allows you to compare securities comprehensively. You are always better positioned to maximize your trades when you conduct a thorough comparison.
Simply click the plus icon on the top left corner of a chart and add the relevant securities you want to compare.
You can compare multiple securities and conduct a comprehensive analysis to improve and build your trading strategies from scratch.
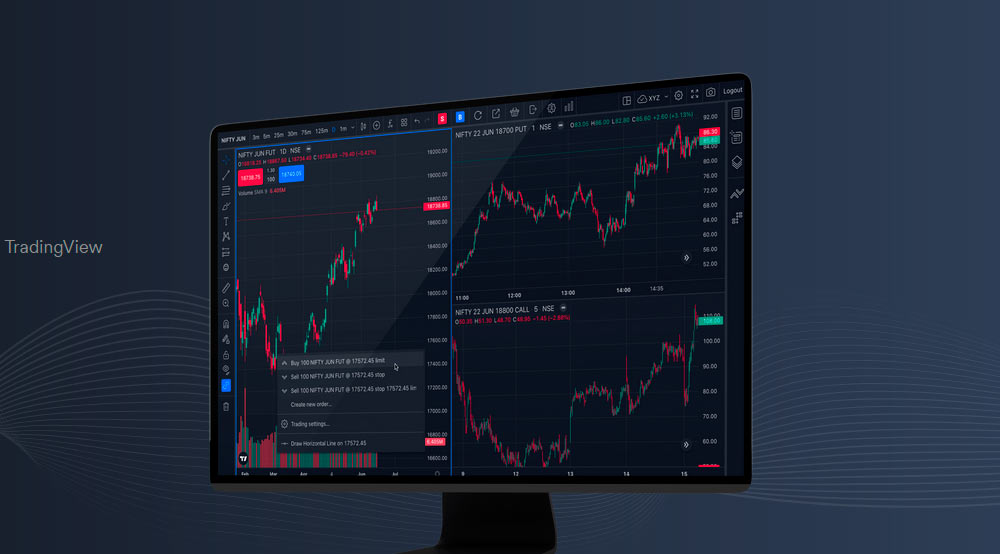
4. Identifying Price Movements
TradingView allows you to identify and predict price movements. You can also monitor the price fluctuations for a particular security. Choose from multiple time frames and indicators to analyze historical price movements and market trends.
You can also identify crucial support and resistance levels and set stop loss accordingly. Doing so can build effective strategies and minimize the associated risks.
Employing multiple timeframes in your analysis is a technique that provides a comprehensive view of market trends. This approach is particularly beneficial in identifying entry and exit points, ensuring that short-term trades are aligned with the longer-term trend.
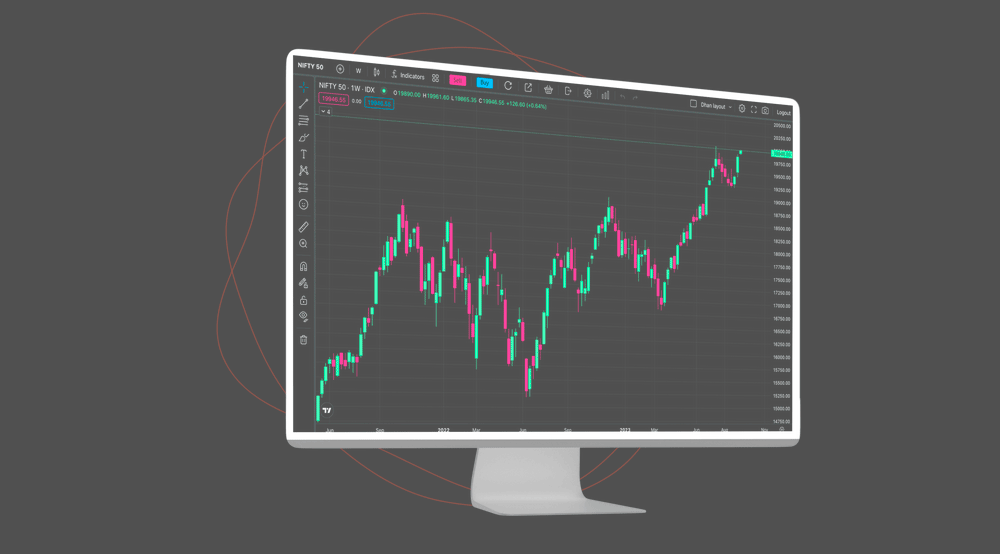
5. Chart Analysis Proficiency
Mastery of chart types is fundamental. While line and bar charts offer baseline insights, the acumen lies in deciphering candlestick charts. Each candlestick encapsulates critical data – opening, closing, high, and low prices within your chosen time frame. The ability to interpret these patterns is crucial for anticipating market movements.
Proficiency in interpreting TradingView’s diverse chart types is non-negotiable. The platform’s candlestick charts, in particular, are instrumental.
Each candlestick offers a wealth of information, encapsulating the open, close, high, and low prices within a chosen time frame. Discerning patterns and trends from these charts is critical for predictive market analysis.
No matter how sophisticated your analysis, risk management is key. Utilize stop-loss orders and position sizing to manage risk effectively. Remember, preserving capital is as important as making profits.
6. Trading Indicators
You can utilize and combine multiple tools available on TradingView to form unique signals and alerts. You can experiment with different indicators and build a customized strategy.
Indicators such as Moving Averages, RSI (Relative Strength Index), Bollinger Bands, and MACD (Moving Average Convergence Divergence) provide insights into market trends, momentum, and potential reversal zones.
It’s imperative to not just use these indicators but to understand their underlying principles and contextual relevance.
Use these tools to identify trends, momentum, and potential reversal points. The platform’s drawing tools aid in marking support and resistance levels, trend lines, and chart patterns.
A broker’s collaboration with TradingView comes in handy here as you can access the TradingView platform without any additional charges. The best TradingView broker will allow you to go beyond access to execution.
You can set stop-loss and take-profit levels on charts. These indicators assist you in establishing risk-reward ratios and managing your positions effectively. As soon as a favorable opportunity arrives, you can directly trade with a broker integration on TradingView.
TradingView is not just a charting tool but a social platform. Follow experienced traders, join discussions, and stay updated with market sentiments. However, it’s crucial to filter information critically and not follow advice blindly.
7. Incorporate Volume and Multiple Time Frame Analysis
Volume plays a pivotal role in confirming trend strength. An uptrend accompanied by increasing volume is generally more trustworthy than one with declining volume.
Volume is a significant yet often underrated aspect of trading. High trading volumes can validate a trend, while low volumes might suggest a lack of conviction.
Combining volume analysis with price action can provide a more comprehensive view of the market.
Smart trading decisions often come from looking at multiple time frames. For instance, a day trader might look at hourly, 4-hour, and daily charts to get a complete picture. This helps in understanding the broader trend while fine-tuning entry and exit points.
Successful trading is as much about emotional discipline
The financial markets are dynamic. Continuously educate yourself on market trends, fundamental analysis, and new technical analysis techniques. Stay adaptable and open to refining your strategies with market changes.
Successful trading is as much about emotional discipline as it is about technical skills. Avoid emotional trading decisions and stick to your tested strategies and risk management rules.
By integrating these practices, you can leverage TradingView charts to make well-informed and strategic trading decisions, aligning with the sophistication expected of professional investors and traders.
TradingView charts are a must-have resource for traders wishing to make informed, data-driven trading decisions.
As a trader, you can gain a competitive edge in the fast-paced trading world by leveraging customizable charting tools, technical indicators, and backtesting.
Keep an eye out for a broker who offers seamless integration with TradingView at zero costs and the best TradingView brokerbased on ratings.
……………
AUTHOR: Peter Sonner
Disclaimer: The material is provided for informational purposes. Trading in financial markets involves significant risk and is not suitable for every investor. The possibility exists that you could sustain a loss of some or all of your initial investment. Therefore, you should not invest money that you cannot afford to lose. Before deciding to trade, you should carefully consider your investment objectives, level of experience, and risk appetite. The high degree of leverage can work against you as well as for you. All trading strategies are used at your own risk