Overview
The US non-life insurance market’s holdings of commercial real estate (CRE) and other real estate should withstand the challenging economic environment and reduced valuations over the medium term.
Fitch Ratings expect any losses to remain within ratings sensitivities given low levels of portfolio exposure.
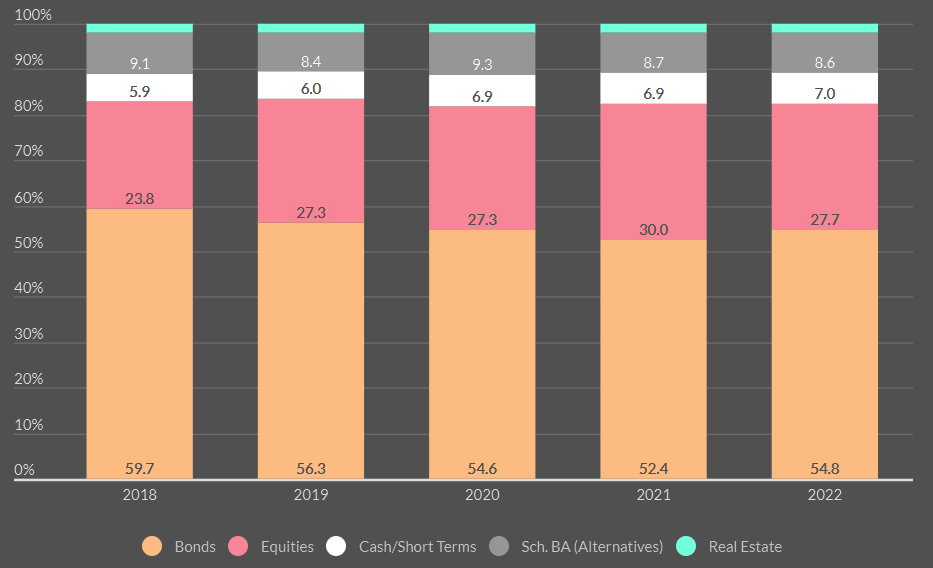
The US non-life insurance industry main asset allocation of its $2 trillion investment portfolio is high-quality, fixed income securities, accounting for approximately 55% of assets invested.
High-quality fixed income securities back insurance liabilities and match duration of the liabilities fairly well while not incurring significant capital charges.
Amid high inflation pressuring loss costs, non-life insurers have increased liquidity, with cash and short-term holdings at 7% of industry invested assets.
Insurers’ ratings are likely to be resilient to a moderate fall in commercial real-estate (CRE) values, Beinsure says in a report, although a systemic crisis would put greater pressure on individual issuers with larger exposures.
Deterioration across property types and growing recessionary risks will contribute to modest growth in mortgage loans over the near term.
Single-family origination growth will slow to moderate levels in 2023 and 2024 due to higher interest rates, which are slowing demand amid deteriorating economic conditions.
Non-Life Insurance Industry Asset Allocation
Individual company results vary, but on the whole no major impairments are anticipated over the ratings cycle, and no single portfolio looks overly exposed to real estate; however, there may be some idiosyncratic risk in a company’s portfolio (see Largest Life Insurance Companies in U.S.).
Potential credit quality deterioration should be mitigated by holdings of high-quality fixed income securities and shorter invested asset duration.
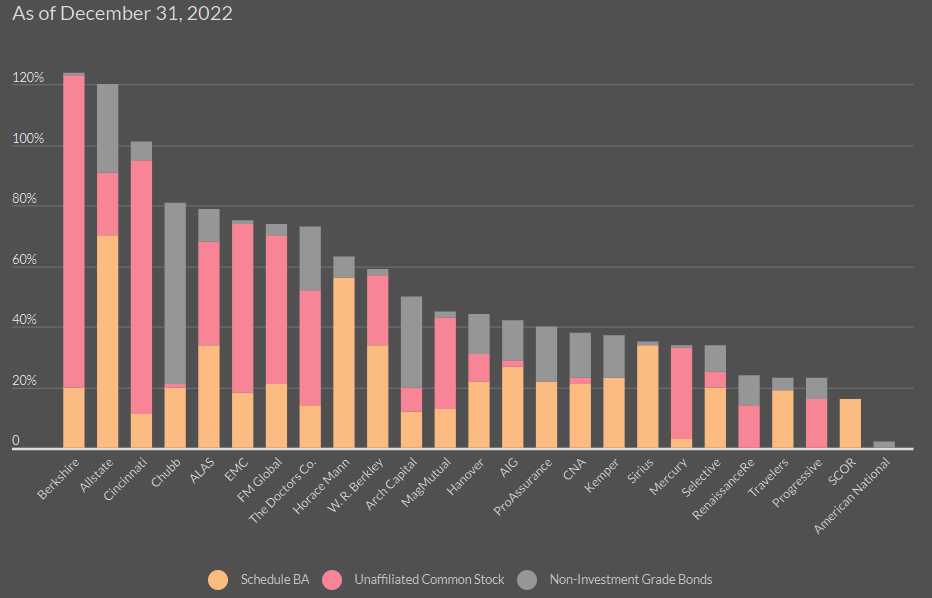
Allocations to riskier invested assets for the non-life insurance sector, which include equities, schedule BA (alternatives) and below-investment-grade bonds, were stable at 62% YE 2022, which was flat compared to the prior year.
Equities accounted for 49% of surplus in 2022, while Schedule BA and below-investment-grade allocations were 7% and 6%, respectively.
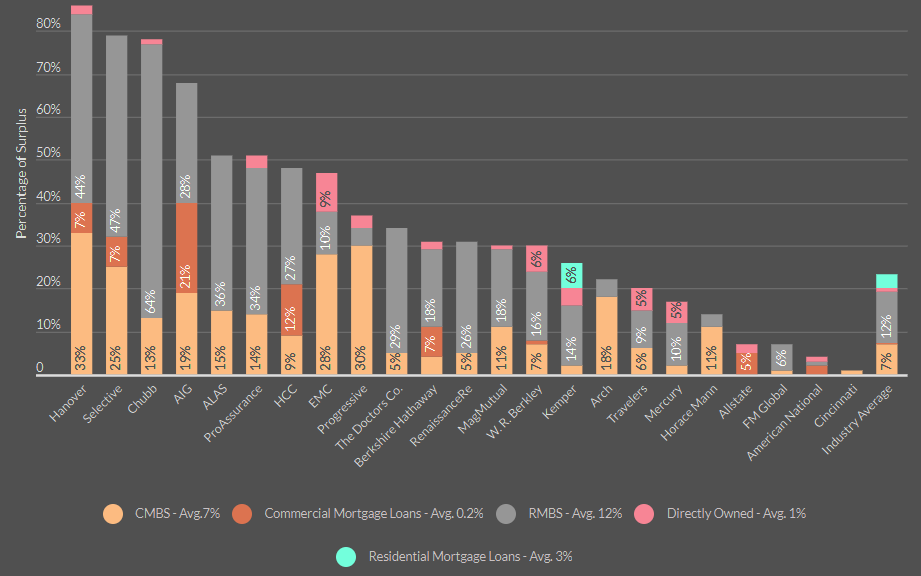
U.S. life insurers’ commercial real estate (CRE) exposure is predominantly via commercial mortgage loans, with more modest exposure to commercial mortgage backed securities (CMBS) at less than 5% of cash and invested assets, with equity real estate not a meaningful allocation.
Risky Assets Percentage of Policyholder Surplus
Composition and amount of schedule BA alternative assets varies widely by company but tends to be in the form of limited partnerships, hedge funds, private equity, private credit and certain real estate funds.
These investments offer increased yield and portfolio diversity but less liquidity relative to equities and bonds.
The largest real estate investment for the non-life industry is residential mortgage-backed securities (RMBS), which has accounted for approximately half of all real estate investments since 2019.
A substantial amount of RMBS held by non-life insurers is issued by government-sponsored entities (GSEs), Fannie Mae and Freddie Mac (rated ‘AA+’ by Fitch) which benefits from implicit government support.
Fitch does not rate any of the MBS products directly issued by the GSEs, which would theoretically carry a rating consistent with the GSEs’ long-term issuer default rating (LT IDR). Any RMBS that fall below investment grade would be captured in Fitch’s risky asset ratio.
Non-Life Insurer Real Estate Exposure % of Surplus
The non-life insurance industry has lower invested asset duration, averaging around 4.8 years in 2022, relative to the life insurance industry.
Option-adjusted duration (OAD) has remained relatively unchanged since 2018, but did lengthen slightly in 2022, driven by a meaningful duration extension in the tax-exempt municipal bonds.
Non-life insurers also have more capital than the global life insurance industry, resulting in significantly less investment leverage of approximately 2x versus the life insurance industry of 11x.
U.S. life insurers had 13% of their aggregate investment portfolios in mortgage loans, or 1.6x capital, which is above historic levels of 8%-12% but stable yoy.
Office and retail valuations are likely to drop further over the medium term, with office most pressured by reduced occupancy. U.S. insurers have continued to de-emphasize these subsectors, and are focusing on multifamily and industrial.
Fitch expect continued negative NOI growth for office properties in 2023, with office loan delinquencies within Fitch’s rated CMBS universe to double to 3.5% to 4% at end-2023 versus 1.8% in May.
FAQ
The US non-life insurance market’s CRE and other real estate holdings are expected to withstand the challenging economic environment and reduced valuations over the medium term.
Approximately 55% of the US non-life insurance industry’s $2 trillion investment portfolio is allocated to high-quality fixed income securities.
Non-life insurers have increased liquidity, with cash and short-term holdings making up 7% of industry invested assets.
Non-life insurers’ ratings are likely to remain resilient to a moderate fall in CRE values, but a systemic crisis would put greater pressure on issuers with larger exposures.
The largest real estate investment for the non-life industry is residential mortgage-backed securities (RMBS), which account for about half of all real estate investments.
The non-life insurance industry has significantly less investment leverage, around 2x, compared to 11x for the life insurance industry.
Office and retail valuations are expected to drop further, with office properties most affected by reduced occupancy. Insurers are shifting their focus toward multifamily and industrial properties.
…………………
AUTHORS: Gerald Glombicki, CPA, CISSP, CCSP, CISA, ARM – Senior Director, Insurance at Fitch Ratings, Douglas Pawlowski – Senior Director, Insurance (North America) at Fitch Ratings, Laura Kaster, CFA – Senior Director, Fitch Wire (North and South American Financial Institutions)