Overview
Moody’s RMS has published an overview of North Atlantic seasonal activity forecasts and summarized the key oceanic and meteorological drivers behind the predictions. Expanded in 2021 to cover seasonal forecasts in the Asia-Pacific region, the report again includes the latest forecasts of Western North Pacific typhoon activity.
According to Moody`s RMS, despite being classified as a near-normal season in terms of overall tropical activity, 2024 will always be remembered by the insurance industry because of the impact and catastrophic damage caused by Hurricane Ian.
Munich Re has estimated that, following the North Atlantic hurricane season, overall losses from all storms amounted to around US $110 billion, with insured losses in the magnitude of $65 billion. Hurricane Ian alone is expected to generate losses of $100 billion, Munich Re said, with $60 billion of these losses to be passed on to private re/insurers.
- Nearly USD $80 bn in new industry loss data, including Hurricane Ida (2021) and Hurricane Ian (2022)
- More than $6.5 bn in new detailed claims data, including more than $3 bn in new residential claims data outside of Florida, more than $2 bn in new U.S. commercial claims, and more than $1 bn in data from Puerto Rico
- Insights into structure and roof performance from field reconnaissance after recent events, including hurricanes Irma (2017), Michael (2018), and Ian (2022)
North Atlantic hurricane season impact

Following 9 hurricane landfalls in three years – including four Category 3, 4, or 5 landfalls – the question on everyone’s mind is: Will the 2024 North Atlantic hurricane season be as impactful and costly as 2020, 2021, 2022 and 2023? (see Worst Natural Disasters).
Even though 2022 was classified as a near-normal season in terms of overall tropical activity, the insurance industry will remember the season for only one event: Hurricane Ian
Ian was a historic and complex event that caused catastrophic wind and storm surge damage in southwestern and central Florida and the Carolinas. Landfalling in a precarious Florida insurance market amid rising inflation, Hurricane Ian is anticipated to be one of the costliest U.S. hurricanes on record, and one that will reshape the Florida insurance market for years to come (see about Worldwide Tropical Cyclone Season: Listing of Events & Economic Loss).
North Atlantic and Western North Pacific Event Response Report – Executive Summary includes:
- Easy-to-read summary of the latest available North Atlantic Basin forecasts from 11 forecasting agencies and groups including the National Oceanic and Atmospheric Administration (NOAA), Colorado State University (CSU), and Tropical Storm Risk (TSR).
- Latest available Western North Pacific Basin forecasts, along with climatological averages and 2022’s activity count.
- Analysis of key oceanic and atmospheric drivers of 2023 forecasts in both the North Atlantic and Western North Pacific Basins, including El Niño-Southern Oscillation (ENSO) and sea surface temperatures.
- A closer look at NOAA’s 2023 North Atlantic hurricane season forecast.
- As a trusted partner, Moody’s RMS is ready to inform your critical business processes with reliable information during the year’s most impactful events.
The latest forecasts for 2023 indicate that a near-normal season is most likely. The forecasts reflect the competing and opposing influence of several key seasonal oceanic and meteorological factors that typically influence intraseasonal hurricane activity in the North Atlantic (see Drivers of Natural Catastrophe Loss Growth). This includes the El Niño-Southern Oscillation (ENSO) and North Atlantic sea surface temperatures.
According to Global Natural Catastrophe & Hazard Review, the development of El Niño would typically result in a quieter hurricane season than normal, but sea surface temperatures in the North Atlantic, and in particular in the main development region, are anticipated to be well above average throughout the year.
These factors – some that suppress storm development and some that fuel it – have resulted in the overall forecast for a near-normal season.
However, there remains a reasonable possibility that the season could conclude with below- or above-normal activity if one of these competing factors exhibits a greater influence over the season.
Moody’s RMS and the reinsurance industry are no strangers to active hurricane seasons. Whatever the final storm count in 2023, we remain committed to supporting our clients during an event.
RMS, has estimated that insurance and reinsurance industry losses from Hurricane Ian will be between $53 bn and $74 bn. The best estimate would likely fall somewhere in the middle of this range at around $67 bn, which would still make it the highest industry loss estimate released so far.

While the U.S. has primarily been the focus of tropical cyclone-insured losses in the past three years, Moody’s RMS stands ready to respond in the Western North Pacific Basin if the focus switches.
Mohsen Rahnama, Chief Risk Modeling Officer and Executive Vice President, Models and Data Moody’s RMS
In 2021, RMS expanded this outlook report to cover seasonal forecasts in the Asia-Pacific region, and this year’s report once again includes Western North Pacific typhoon activity forecasts for 2023.
North Atlantic Seasonal Forecasts
The North Atlantic hurricane season officially runs from June 1 to November 30. Several forecasting agencies and groups issue preseason forecasts to provide an indication of potential storm activity for the upcoming season.
Table shows the most recent forecasts, including those from the National Oceanic and Atmospheric Administration and two of the most widely known forecast groups: Colorado State University and Tropical Storm Risk. Also displayed are several climatological averages and 2022’s activity count.
Average and seasonal activity of the most recent North Atlantic hurricane forecasts
| Forecast agency | Forecast date | Tropical storms | Hurricanes | Major hurricanes |
| National Oceanic and Atmospheric Administration | May 25 | 12–17 | 5–9 | 1–4 |
| Colorado State University | June 1 | 12–18 | 5–9 | 2–5 |
| Tropical Storm Risk | May 31 | 13 | 6 | 2 |
| U.K. Met Office | May 26 | 14–26 | 8–14 | 3–7 |
| European Centre for Medium-Range Weather Forecasts | May 5 | 13–21 | 6–12 | n/a |
| Servicio Meteorológico Nacional | May 4 | 10–16 | 3–7 | 2–4 |
| North Carolina State University | April 13 | 11–15 | 6–8 | 2–3 |
| University of Pennsylvania | May 1 | 12–20 | n/a | n/a |
| University of Arizona | April 7 | 16–22 | 7–11 | 4–6 |
| AccuWeather | March 29 | 11–15 | 4–8 | 1–3 |
| The Weather Company | April 13 | 15 | 7 | 3 |
| 1950–2022 average | 12,2 | 6,5 | 2,6 | |
| 1991–2020 average | 14,4 | 7,2 | 3,2 | |
| 1995–2022 average | 14,4 | 7,2 | 3,2 | |
| 2022 North Atlantic hurricane season | 16,3 | 7,2 | 3,1 | |
The seasonal activity forecasts are made using either dynamical weather models, statistical models, or a combination.
Dynamical weather models, such as those partly used by the National Oceanic and Atmospheric Administration, the U.K. Met Office, and the European Centre for Medium-Range Weather Forecasts, calculate the real-life physical atmospheric and oceanic processes from a perturbed set of initial environmental conditions.
An ensemble of forecasts is produced to provide an indication of the range and probability of possible outcomes occurring.
Statistical models, such as those used by Tropical Storm Risk, University of Pennsylvania, and University of Arizona, derive statistical relationships between environmental factors and historical activity, which are then applied to the current environmental conditions to forecast activity for the upcoming season. The forecast ranges are based on the historical accuracy of the prediction scheme.
Some seasonal activity forecasts, such as those issued by Colorado State University, use a combination of statistical and statistical/dynamical hybrid models.
Hurricane season Forecasts from NOAA
The National Oceanic and Atmospheric Administration (NOAA) outlook for the North Atlantic hurricane season indicates that a near-normal season is most likely, with lower but equal possibilities that the season could be above or below normal. The outlook indicates a 40% probability that the season will be near normal, a 30% probability that the season will be above normal,6 and a 30% probability that the season will be below normal.
The predicted ranges for activity in 2024 are centered near NOAA’s 1991–2020 U.S. Climate Normals seasonal average of 14 named storms, seven hurricanes, and three major hurricanes.
If NOAA’s forecast verifies, the North Atlantic hurricane season would be a second consecutive near-normal season. The last pair of near-normal seasons was 2006 and 2007. NOAA will update its forecast at the beginning of August, just before the historical peak of North Atlantic hurricane activity.
Landfall Forecasts
Long-term statistics indicate that the probability of a hurricane making landfall in the U.S. increases during more active seasons. When issuing landfall probability forecasts, some agencies use statistical models to examine the relationship between the number and intensity of historical landfalls and the observed and forecast climatological conditions.
Not including NOAA, which does not make seasonal hurricane landfall predictions, the forecasts that follow are the most recent as of June.
Colorado State University (CSU) estimates the probability of at least one named storm, hurricane, and major hurricane tracking within 50 miles of each U.S. coastal state.
According to CSU, Florida (56%), Louisiana (38%), North Carolina (38%), and Texas (36%) have the highest probability of experiencing a hurricane during 2023. CSU anticipates a 43% probability of at least one major hurricane making landfall in the U.S. this season (the 1880–2020 average is 43%) and a 47% probability of at least one major hurricane tracking through the Caribbean (the 1880–2020 average is 47%).
Tropical Storm Risk (TSR) forecasts three tropical storms and one hurricane to make landfall over the contiguous U.S. in 2023. TSR anticipates the U.S. landfalling ACE index11 to be 1.9, below the 1950–2022 (2.5), 1991–2020 (2.7), and 2013–22 (3.3) averages.
Probabilistically, TSR assigns a 29% chance that the U.S. landfalling ACE index will be above average, a 33% chance that it will be near average,13 and a 33% chance that it will be below average.
AccuWeather forecasts two to four named storms (of any intensity) to directly impact the mainland U.S., Puerto Rico, or the U.S. Virgin Islands during the 2023 season.
Uncertainty in seasonal forecasts of landfalling storms is far greater than the uncertainty in seasonal forecasts of overall hurricane activity. Individual storm tracks are highly sensitive to the location of cyclogenesis and the local atmospheric and oceanic conditions and weather patterns during the season.
Although the probability of a hurricane making landfall in the U.S. increases during more active seasons, there are notable exceptions to this tendency.
In 2010, 19 named storms and 12 hurricanes developed in the North Atlantic Basin, but only one tropical storm made landfall in the U.S. Conversely, Hurricane Andrew, one of the costliest hurricanes in U.S. history, was one of only seven named storms to develop during the relatively quiet 1992 season. It only takes one event to make a season costly or memorable.
Key Drivers of the North Atlantic Hurricane Seasonal Activity Forecasts
The forecasts of a near-normal hurricane season reflect the competing and opposing influences of several key seasonal oceanic and meteorological factors, including the El Niño-Southern Oscillation (ENSO), sea surface temperatures in the tropical Atlantic, and the Atlantic Multidecadal Oscillation/ Variability (AMO/AMV).
Overview of key seasonal oceanic and meteorological factors anticipated to influence activity in 2023,expected impact on activity, and level of confidence in the forecast
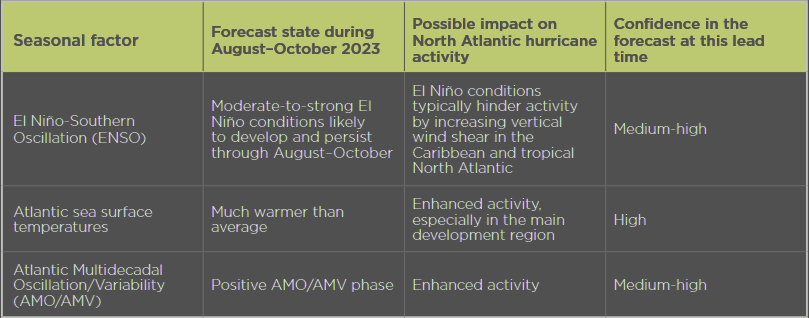
A large proportion of the uncertainty associated with seasonal hurricane activity forecasts can be attributed to the uncertainty about which El Niño-Southern Oscillation (ENSO) phase will materialize during the peak months of the hurricane season during August, September, and October.
Should ENSO transition to an El Niño phase through the 2023 North Atlantic hurricane season, and in the absence of influence from any other factors, activity would be expected to be below normal.
If, as multiple forecasts predict, ENSO transitions to an El Niño phase between June and July and develops further into a strong event, and in the absence of influence from any other factors, a larger decrease in activity below normal could be expected.
Sea surface temperatures in the North Atlantic, and in particular in the main development region, reached their warmest on record (since 1979) for the time of year in late May.
Models are forecasting above-average departures for the period covering the peak months of the hurricane season between August and October 2023, with many areas forecast to experience anomalies of +0.17°C to +0.62°C. The average departure across the main development region is anticipated to be +0.48°C.
Warmer sea surface temperatures typically enhance tropical activity by providing increased energy and moisture to the environment.
These factors – some that suppress storm development and some that fuel it – have resulted in the overall forecast for a near-normal season.
However, there remains a reasonable possibility that the season could conclude with below- or above-normal activity if one of these competing factors exhibits a greater influence over the season.
Other factors, such as the North Atlantic Oscillation (NAO), the Madden-Julian Oscillation (MJO), and the Saharan Air Layer (SAL), can influence tropical cyclone activity on a weekly or monthly basis but are difficult to forecast at seasonal timescales.
Western North Pacific Seasonal Forecast

The Western North Pacific typhoon season runs throughout the calendar year with no seasonal boundaries, although most of the activity typically occurs between May and November.
Unlike in the North Atlantic Basin, the number of seasonal forecasts for the Western North Pacific Basin is not exhaustive. Several agencies issue forecasts to provide an indication of potential storm activity for the peak months of the year.
Table shows the latest available forecasts at the time of publication. Also displayed are several climatological averages and 2022’s activity count.
Average and seasonal activity of the most recent North Pacific hurricane forecasts
| Forecast agency | Forecast date | Tropical storms | Typhoons |
| Tropical Storm Risk | May 5 | 29 | 19 |
| European Centre for Medium-Range Weather Forecasts | May 5 | 17–24 | 10–14 |
| 1951–2022 average | 26,2 | 15,9 | |
| 1991–2020 average | 25,1 | 13,3 | |
| 2022 Western North Pacific typhoon season | 25 | 10 | |
Key Drivers of the Western North Pacific Seasonal Activity Forecasts
The forecasts of a near-to-above-average year in the Western North Pacific Basin reflect the influence of the key seasonal oceanic and meteorological factors, including the El Niño-Southern Oscillation (ENSO) and sea surface temperatures in the Western North Pacific.
An overview of the key seasonal oceanic and meteorological factors that are anticipated to influence activity in 2023, the expected impact on activity, and the level of confidence in the forecas
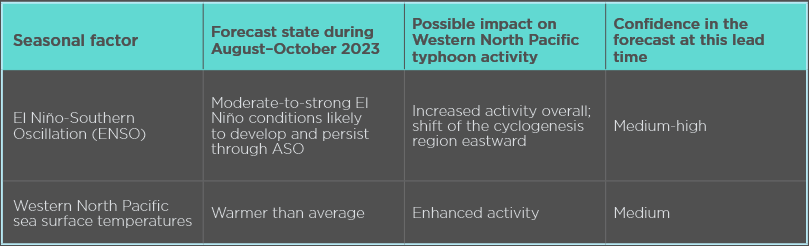
Most ENSO forecast models favor the development of El Niño conditions during the Northern Hemisphere summer. During El Niño years, the main cyclogenesis region shifts east, nearer the warmer waters of the equatorial Pacific Ocean, and weaker trade winds and increased atmospheric instability typically lead to increased overall activity for the basin.
Sea surface temperatures across the Western North Pacific Basin are expected to be near or above average between July and November.
The waters immediately surrounding the Philippines and the South China Sea are expected to be between 0°C and +0.5°C above average, while areas off the northeastern coast of Japan are expected to be between +0.5°C and +1.5°C above average.
Warmer sea surface temperatures typically enhance tropical activity by providing increased energy and moisture to the environment.
…………………
AUTHOR: Mohsen Rahnama – Chief Risk Modeling Officer and Executive Vice President, Models and Data Moody’s RMS