Overview
Most natural disaster databases show a significant decline in the number of annual global events prior to 1980. While the biggest disaster events are typically captured and are the most important to explain total losses most small and medium-sized events are often missed.
According to AON Insight report, many disasters in highly exposed areas, including Hurricane Ian or the devastating floods in Pakistan, highlight the need to strengthen resilience, as socio-economic change and concentration of exposure and wealth in vulnerable areas remains a major loss driver.
3 global drought events were among the 10 costliest disasters, which underlines the growing significance of the peril on a global scale.
These occurred in the United States, Europe and China. But data analysis has not completely removed the data gap, it has made major progress in identifying a large portion of events.
Along with the addition of events not previously included in the database, a significant effort has been made to ensure a full country-level breakout of event losses.
In many instances, the loss breakout helps identify trends beyond the peril aggregate and down to a more regional or localized level.
For example, thorough research since 2017 resulted in the increase in China-specific entries from 621 to 1,669. Similarly, number of Canada entries increased from 406 to 968.
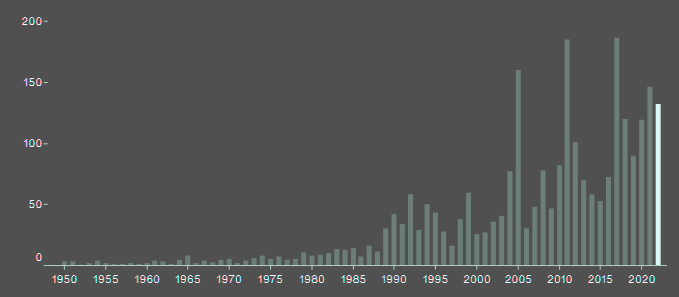
Global Disaster Losses by Event Size
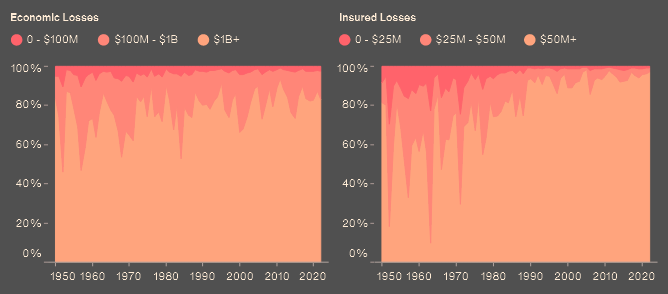
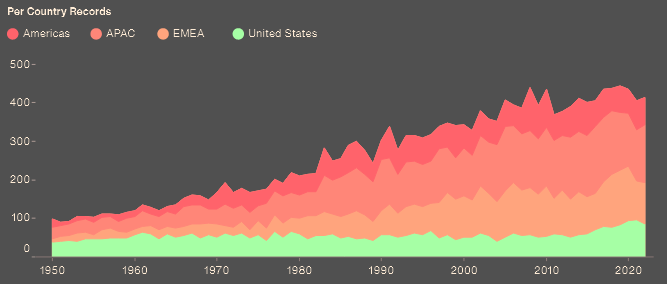
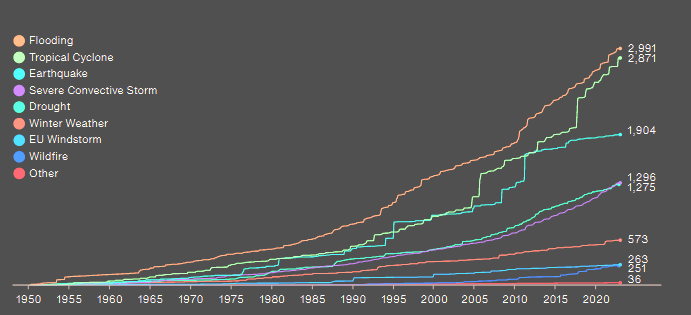
Number of Natural Catastrophe by Region
The insurance sector covered $132 bn — marking 2023 as the fifth costliest year for insurers on record. The industry the second costliest event on record, as Hurricane Ian resulted in approximately $50-55 bn of insured losses covered by public and private entities.
Is the Number of Natural Disasters Increasing Globally?
The answer to this question depends on how global natural disaster is being defined. This is crucial before conducting any meaningful analysis and at least to some extent eliminates biases related to the reporting of events.
Expanding the knowledge through scientific research and climate modeling can help us determine whether the physical hazard itself is getting worse or not, what are the implications on different types of perils and how this varies across regions.
Looking at disasters as events that cause material and human impact, damage or fatality statistics can be used to define them. It is important to note that socio-economic factors remain the primary driver of an increasing number of damaging events. The world human population exceeded 8 billion and since 2000 increased approximately 30%.
Number of Natural Disaster Events Based on Different Criteria
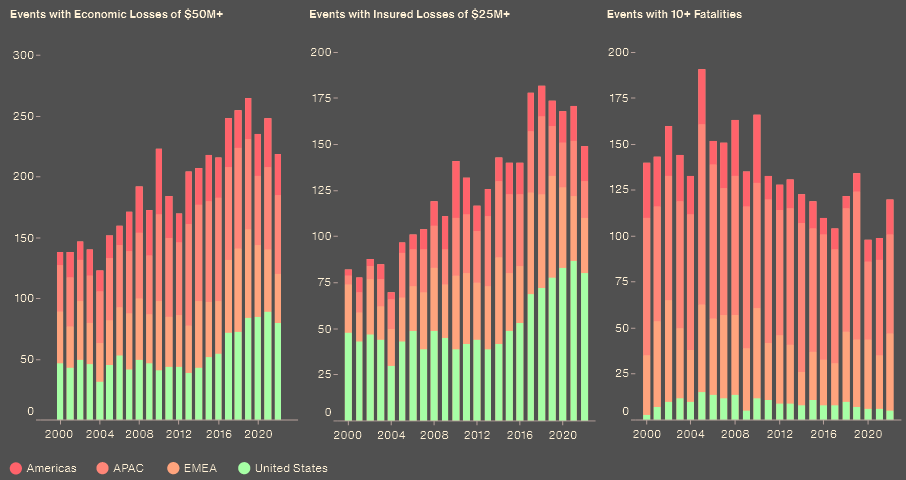
In the same timeframe, the global GDP increased by a staggering 80% (in constant prices). Increasing exposure and wealth is expected to result in higher and more frequent losses, even if the hazard remained the same.
Remarkably, natural disasters defined as events that cause a certain number of fatalities has been decreasing globally this century, likely thanks to improving
Heatwaves are Climate-Driven Perils
Many regions of the world experienced severe and prolonged heatwaves in 2022, and their frequency and intensity are anticipated to increase in the coming decades.
Catastrophe Insight started accounting for heat-related fatalities in a systematic manner using our own methodology and calculation to assess the heat impact.
These assessments were primarily based on mortality data provided by Human Mortality Database (HMD) and methodology established in academic papers. The HMD provides detailed high-quality harmonized mortality and population estimates, particularly for European countries.
Example of Weekly Mortality Data Assessment for France
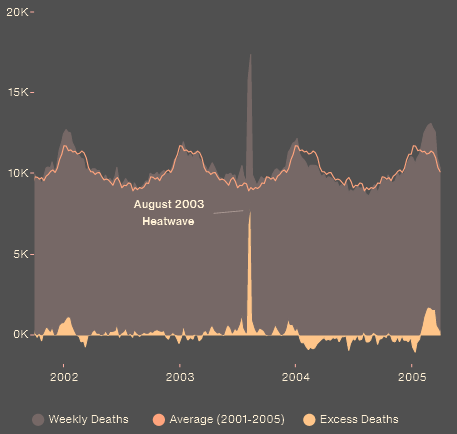
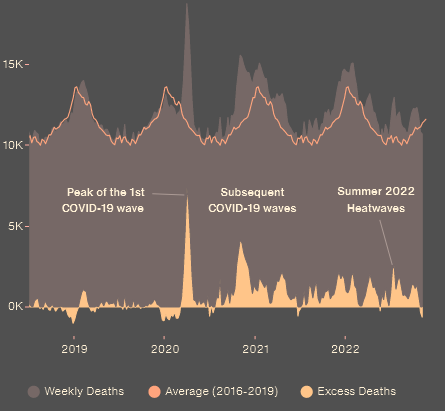
Individual heatwaves were identified according to meteorological conditions. Mortality data for the weeks when a heatwave occurred were then compared with average mortality based on previous and following years to estimate excess mortality attributable to the heatwave.
Weekly data, when available, also allows the assessment of individual heatwaves throughout the year.
Long-term Natural Disaster Trends
The events and costs of catastrophes and natural disasters that amounted to economic losses of $313 billion — $299 billion of which was the result of weather and climate events.
That’s a staggering amount of loss, and yet, only 42% were covered by insurance. This data highlights a tremendous opportunity to close this protection gap. In doing so, we can protect vulnerable communities and strengthen the economy.
Direct economic losses resulting from natural disasters in 2023 are estimated at $313 billion. This is close to the 21st century average, after adjusting actual incurred damage to today’s dollars using the U.S. Consumer Price Index.
Though 2023 was far from record-breaking in terms of overall losses, it saw many impactful and costly events across the globe (see Reinsurance Rates for Property Catastrophe Forecast).
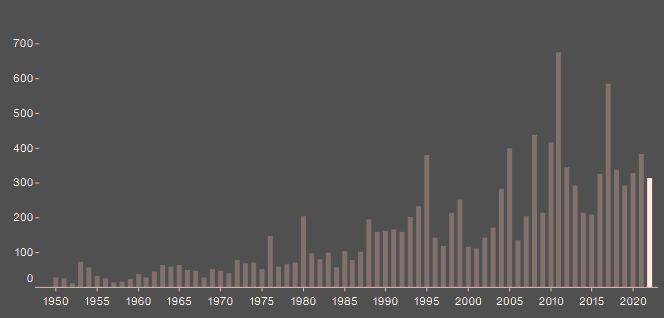
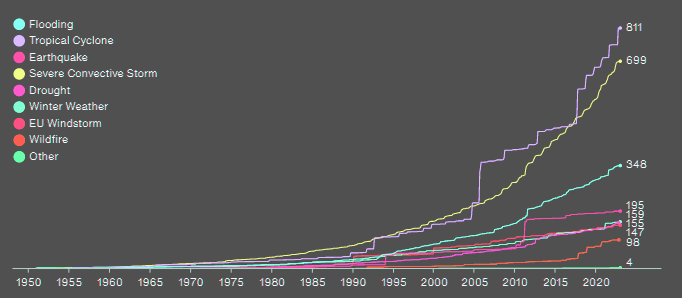
Global Economic Losses Since 1950 ($bn)
Cumulative Global Economic Losses Since 1950 ($bn)
Insurance exists to protect that which we cannot afford to lose, and when it comes to climate change, we all have a lot to protect.
The good news is that there are examples of where the industry has forged a better path: choosing to stay in the game, facilitate a just transition and provide ways to bring new solutions to market quicker (see Natural & Man-Made Catastrophe Loss Outlook).
For example, catastrophe bonds were created to provide post-event cover for traditional risks, but they also encourage pre-investment in research and development that would accelerate clean energy transitions by assuring certainty of funds to deal with the impact of traditional claims.
Global Insured Losses Since 1950 ($bn)
Cumulative Global Insured Losses Since 1950 ($bn)
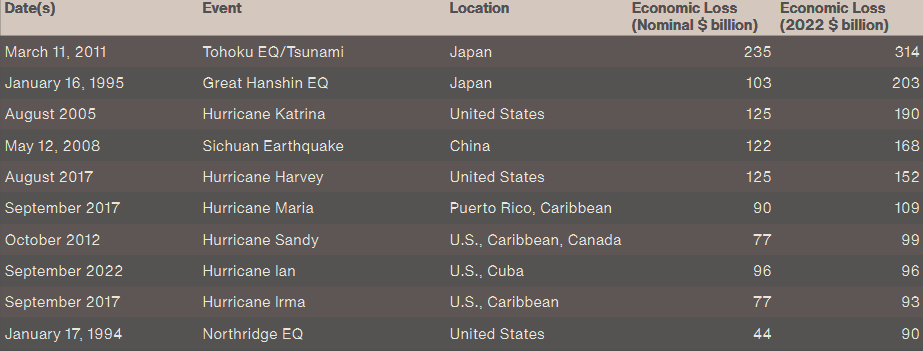
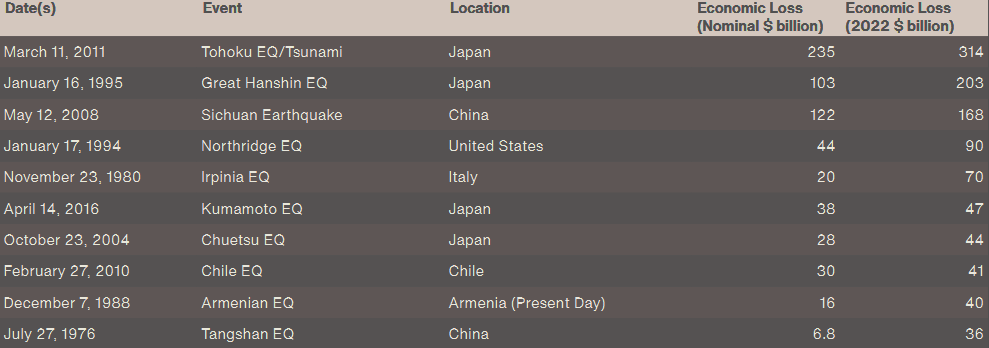
Historical Costliest Natural Disaster Events
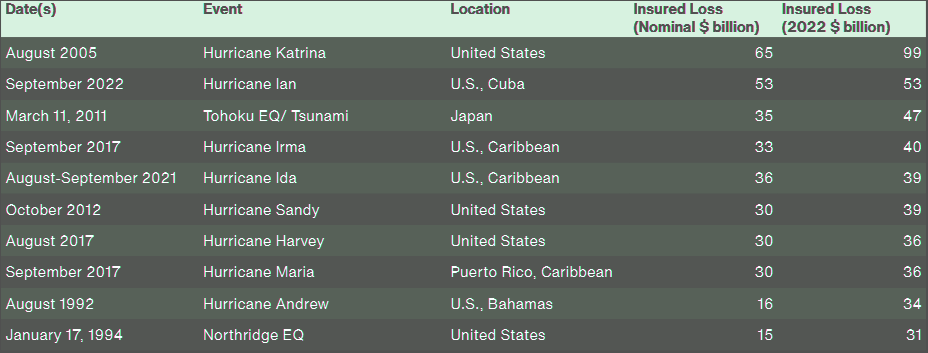
Insured losses include those sustained by private industry and government entities such as the U.S. National Flood Insurance Program (NFIP).
Inflation-adjusted losses are used since they represent actual incurred costs in today’s dollars. Normalized values, while very valuable for analyzing historical scenarios using today’s population, exposure, and wealth, are hypothetical.
Top 10 Costliest Global Economic Loss Events
Top 10 Costliest Global Insured Loss Events
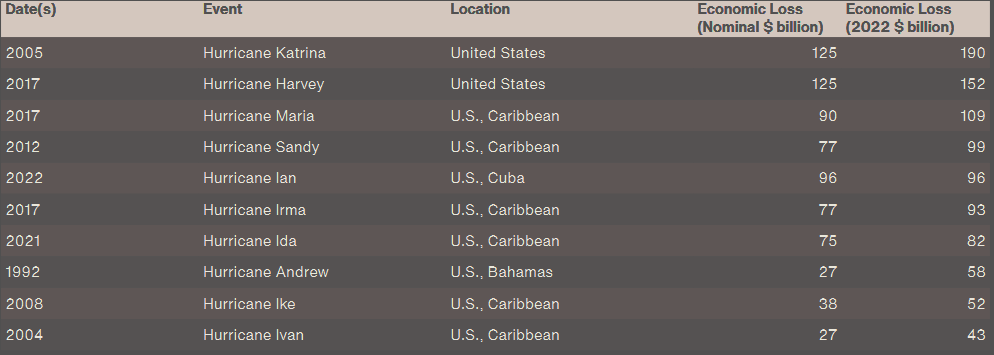
1990 is generally considered the first year when global tropical cyclone data are best verified in every basin. Data from the Southern Hemisphere prior to 1990 is still subject to future reanalysis by official tropical cyclone agencies.
While there continues to be increasing instances of costlier and more impactful landfalling tropical cyclones, there has yet to be any obvious shift in landfall trends across the globe.
This suggests that losses are largely being driven by the increased levels of population and exposure along vulnerable coastal locations.
However, as thoroughly referenced elsewhere in this report, emerging trends indicate that tropical cyclones are intensifying at a faster rate and reaching the highest intensity levels for longer periods and near the point of landfall. This is a concerning trend and one that portends to greater future losses for the peril.
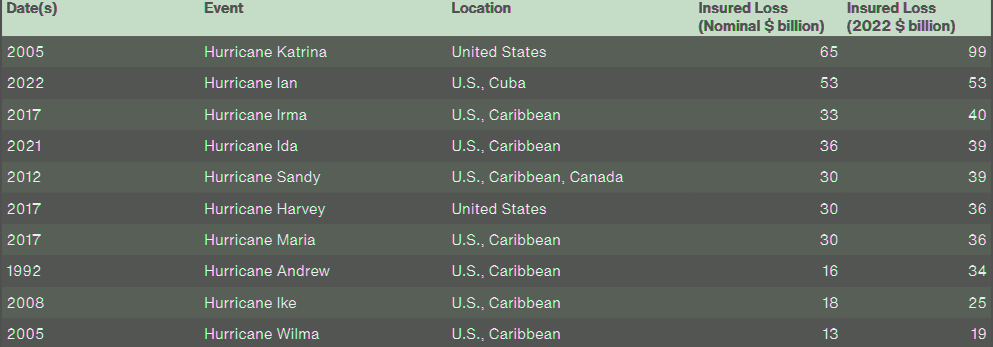
Top 10 Costliest Tropical Cyclones
Economic Loss
Insured Loss
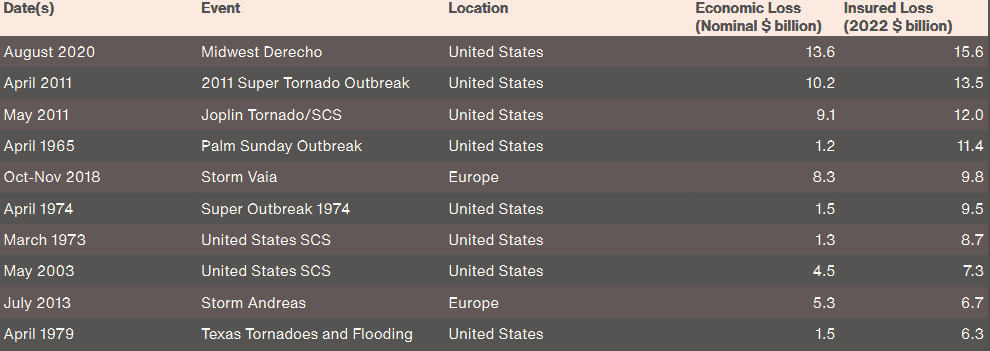
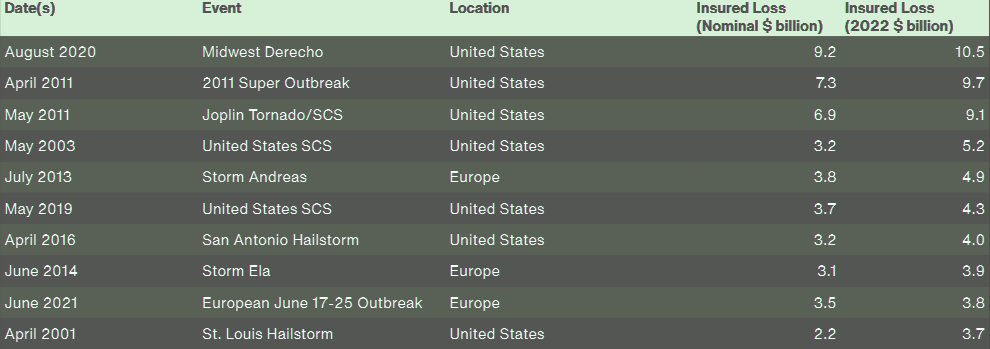
Given the increased cost of severe weather-related damage in the United States during the past decade for insurers, the following is a number of tornado and large hail (2.0” or larger) reports.
The data comes via NOAA’s Storm Prediction Center. Please note that data prior to 1990 are often considered incomplete given a lack of reporting.
The implementation of Doppler radar, greater social awareness and increased reporting has led to more accurate datasets in the last 30 years. Data from 2022 is to be considered preliminary.
Top 10 Costliest Severe Convective Storm Events
Economic Loss
Insured Loss
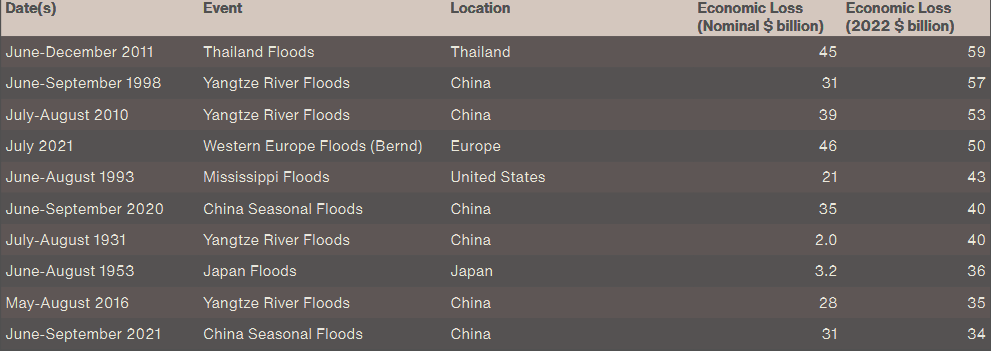
Floods can happen anywhere — just one inch of floodwater can cause up to $25,000 in damage. Most homeowners insurance does not cover flood damage. Flood insurance is a separate policy that can cover buildings, the contents in a building, or both, so it is important to protect your most important financial assets — your home, your business, your possessions (see Flood Risk is Insurable and How Does Insurance Industry Can Close the Protection Gap?).
Top 10 Costliest Floods
Economic Loss
Based on historical data from the United States Geological Survey, 2023 saw at least 128 earthquakes with magnitudes of 6.0 or greater. Overall earthquake activity does not often show large fluctuations on an annual basis.
This is especially true given the extensive network of global seismograph stations that has led to an improved and more robust dataset in recent decades.
Top 10 Costliest Earthquakes
Economic Loss
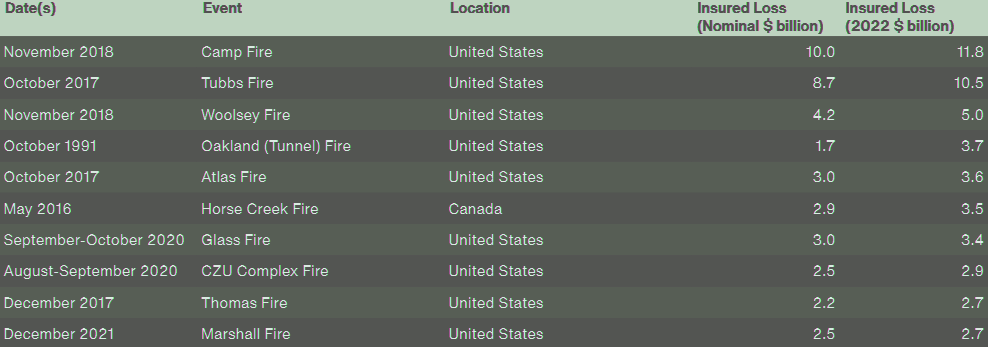
The following wildfire data in the United States is provided from the National Interagency Fire Center (NIFC), which began compiling statistics under their current methodology in 1983.
Previous data was collected by the National Interagency Coordination Center (NICC) from 1960 to 1982 but used a different methodology.
It is not advised to compare pre-1983 data to post-1983 data given these different data collection methods. The European data comes via the European Forest Fire Information System (EFFIS), which is maintained by the European Union’s Copernicus group.
Top 10 Costliest Individual Wildfires
Insured Loss
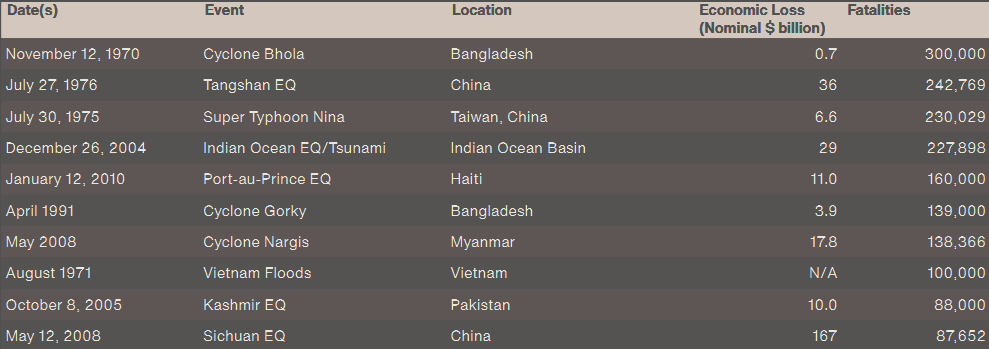
Approximately 31,300 people lost their lives due to global natural catastrophe events in 2022, which was well below the 21st century average (73,200) and median (38,900). Roughly two thirds of these fatalities can be directly attributed to heatwaves that occurred in Europe in June and July. It is worth noting that heatwaves in China and other countries also resulted in significant health impacts, yet reliable estimates will not be released until later in 2023.
Thousands of people were also killed in South Asia as a result of significant seasonal floods in India and Pakistan. Other notable floods included events in Nigeria and South Africa, as well as in China and Brazil.
Top 10 Global Human Fatality Events in the Modern Era
Hurricane Ian was by far the costliest event of the year for the global re/insurance industry and became the second costliest natural disaster ever recorded in terms of insured loss on a price-inflated basis, only surpassed by Hurricane Katrina, which resulted in more than $99 billion losses (in 2023$) after its devastating impact in 2005. U.S. Home Insurers Have of the Highest Level of Catastrophe Exposure to Hurricane Ian.
…………………..
AUTHORS: Michal Lörinc – Head of Catastrophe Insight at AON, Ondřej Hotový – Catastrophe Analyst at AON, Adam Podlaha – Head of Impact Forecasting at AON
Edited by Oleg Parashchak – CEO Finance Media & Editor-in-Chief at Beinsure Media