Swiss Re Institute Index of macroeconomic resilience captures the extent to which an economy can withstand a shock such as a recession; Global Insurance resilience indices measure how insurance contributes to maintaining households’ and businesses’ financial stability by transferring or absorbing key risks to life, health and property, according to Swiss Re Sigma study.
The protection gap is the uninsured or unprotected portion of the resources needed to fully mitigate a risk.
We believe resilience should be viewed holistically. Measures to strengthen macroeconomic resilience can be complemented by household (micro) resilience, for example by providing adequate and affordable insurance coverage (see How P&C Insurance Companies in the United States Can Increase Inflation Resilience?).
In addition, resilience is also about not needing it in the first place: loss prevention is a key component of resilience. We look at these aspects in the next two chapters.
Global protection gap reached a new high

We see the world economy today as in need of a sustained reload in resilience. The value of unprotected risk exposure globally has risen steadily in the past five years
The global protection gap measured at USD 1.8 trillion in premium equivalent terms for 2022, a cumulative 20% increase on the comparable-terms USD 1.5 trillion estimate for 2018
We have expanded the insurance resilience indices with a new crop protection index, and have added the severe convective storm peril to our natural catastrophe index. We estimate about 43% of risk globally was unprotected by assets or insurance in 2022, improved from 46% a decade ago.
Forecast negligible improvement in macroeconomic resilience index in 2023-2024
Swiss Re do not expect significant improvement in our macroeconomic resilience index in 2023 or 2024, due to three key risks (see How to Increase Resilience of Cyber Market through Insurance).
First, the rapid withdrawal of liquidity from the financial system is exacerbating vulnerabilities in the banking sector. Many medium-sized banks in the US have shown severe signs of stress in the last 12 months, while even a global systemically important bank was forced into an emergency takeover. The US and European banking sectors in general are signalling stress and reducing credit supply to the real economy. There may be more credit casualties to come.
Second, we believe many economies and capital markets now appear overly reliant on public sector liquidity measures to sectors (like the banking industry) or bond markets (as in the UK) to limit damage. Aside from interest rate rises, central banks have made little progress at reducing their balance sheets and offsetting past accommodative policies. This has led to worse financial market functioning and a weaker pass-through of monetary policy to financial conditions, both of which complicate efforts to tame inflation.
Third, inflation and the associated cost-of-living crisis have severely challenged the purchasing power of lower and middle-income households in many countries. Inflation is fundamentally a distributional outcome between firms, workers and taxpayers that must be borne by these groups. Similarly, someone needs to take the risks stemming from the banking sector. In both cases, this falls to the fiscal authorities, typically via deposit guarantees at banks (or other guarantees), or price caps and energy subsidies to shield households from even more significant price pressures. While fiscal authorities to some extent benefit from inflation – as higher inflation raises revenues and erodes the real value of debt – they may also have to support societies more.

Strong economic growth improved our fiscal resilience measure in 2022. However, in its absence in the coming years, further fiscal support is likely to be needed to cushion the cost-of-living crisis.
As a result, fiscal deficits may not narrow soon. In regions such as Europe, fiscal deficits may be structurally larger in the coming years than in the post-GFC era, to fund necessary public investment related to the energy transition. This implies fiscal positions and hence fiscal resilience are unlikely to structurally improve.
Economic resilience rose
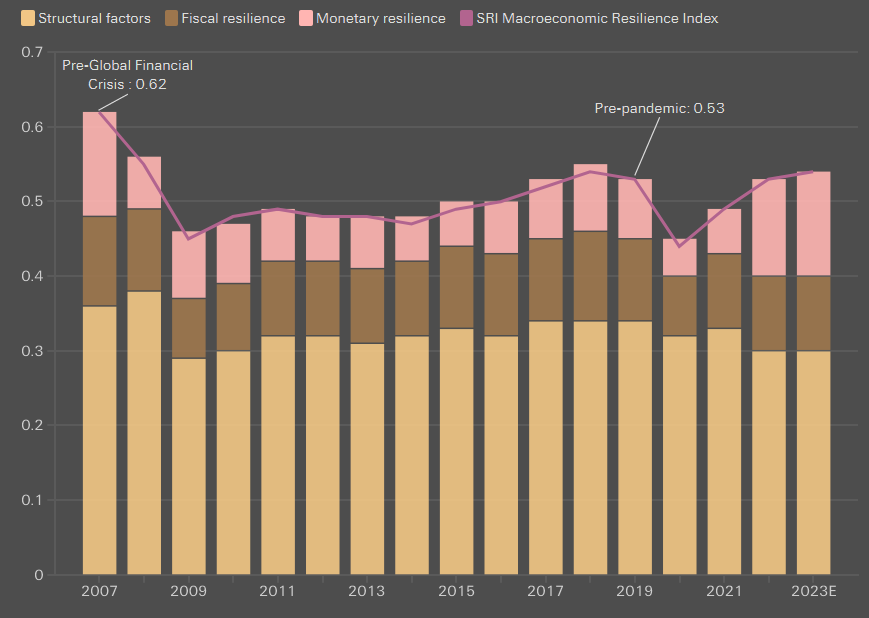
Macroeconomic resilience strengthened globally in 2022 as central banks increased interest rates, and our macroeconomic resilience measure returned to its pre-pandemic level.
It remains 15% weaker than in 2007, prior to the Global Financial Crisis (GFC). Risk is elevated: the inflation-taming monetary tightening process has laid bare financial stability and recession risks, while persistent inflation increases the need for fiscal support to offset the erosion of households’ purchasing power.
We expect little improvement in resilience in 2023 or 2024.
Macroeconomic Resilience Index
Global insurable crop exposure is unprotected
Insurance market research also signals a need for resilience in four key perils. The agrifood system supports almost half of the world’s population and food security has been a key concern since the outbreak of war in Ukraine.
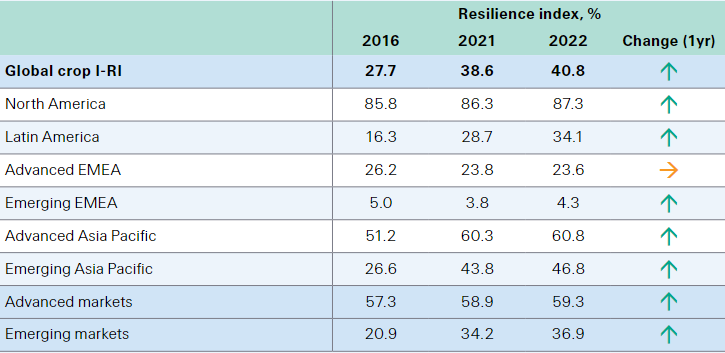
Yet new crop index finds about 60% of global insurable crop production was unprotected against natural disasters and accidents (eg, fire, disease and insect swarms) in 2022.
The global crop protection gap estimates at USD 113 billion (premium equivalent), up by 28% in nominal terms from 2016, emphasising the importance of agricultural insurance to smooth farmers’ income fluctuations. Natural catastrophe resilience index estimates that about 75% of global risk was unprotected in 2022, with protection gaps largest in emerging markets.
Health resilience shows encouraging strength, standing at 78% in 2022, as living and health standards improved alongside economic growth, particularly in emerging Asia.
However, mortality resilience is low at 43%, implying that many households are vulnerable to the loss of a breadwinner.
The global mortality gap widened to USD 406 billion in 2022, a record high, driven by inflation, wage rises and weaker financial markets. Life insurance has helped to improve protection in most countries, particularly those with higher resilience, but more still needs to be done.
SRI insurance resilience index by region
SRI protection gap by region
Reloading resilience through reducing expected losses and expanding insurance coverage
To reload resilience requires two strategies: reducing expected losses and expanding insurance coverage. For example, investment can lower the risk of damage to crops, property and infrastructure from natural catastrophes to structurally narrow protection gaps while supporting economic growth.
Such investment can generate economic dividends that outweigh the cost by multiples from 2:1 to 10:1.
Every USD 1 invested in loss prevention in lower income countries creates a relatively larger resilience dividend than in wealthier economies. By reducing risk, loss prevention also fosters insurability.
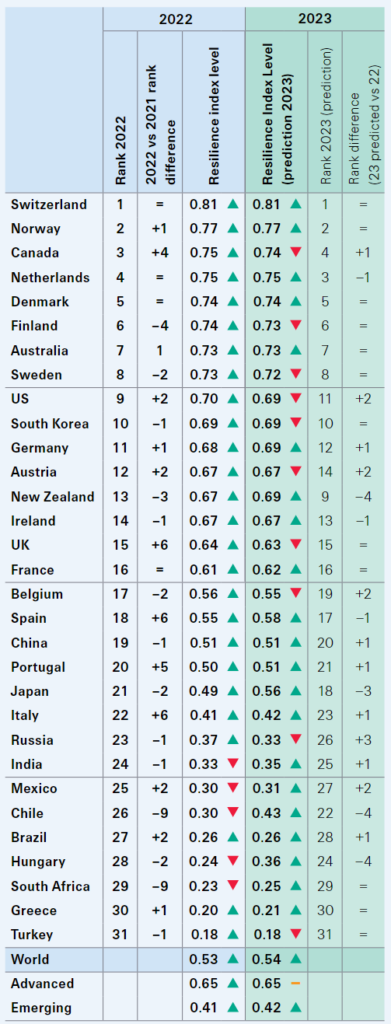
Macroeconomic Resilience Index, scores & rankings
Insurance resilience: more of the world is better protected
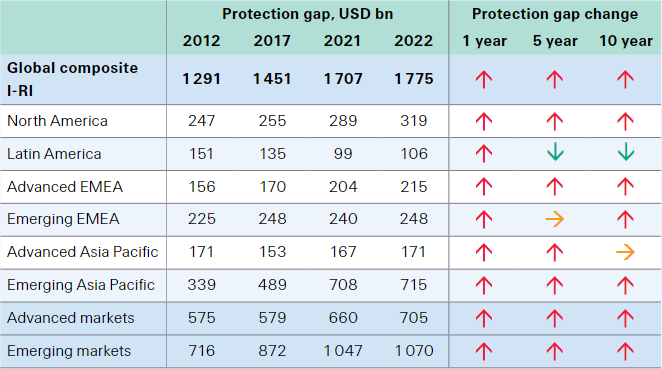
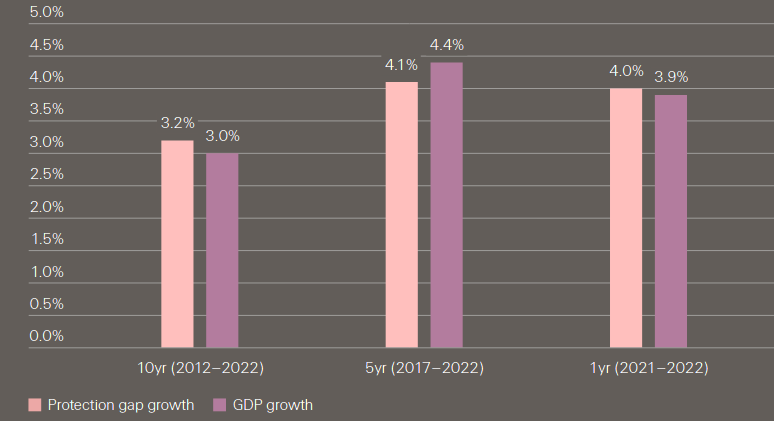
The global protection gap reached a new record high of USD 1.8 trillion in premium equivalent in 2022, 4% higher in nominal terms than in 2021, similar to global nominal GDP growth.
The gap has risen by a cumulative 20% in the past five years, as protection needs have been pushed up by economic growth, and inflation increased insured exposures.
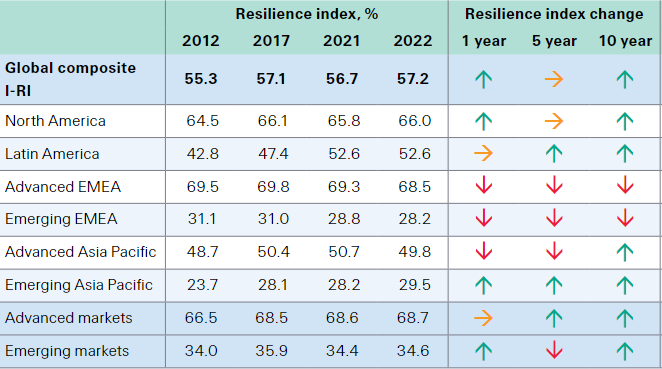
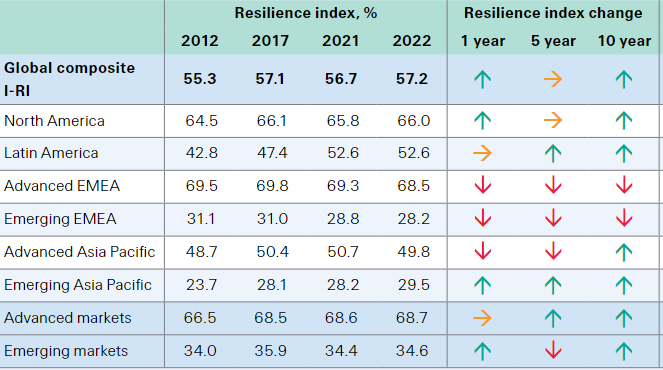
The SRI Insurance Resilience Indices (I-RI) have improved over the past five years as a growing proportion of households’ risk protection for four key perils is protected, mainly by insurance.
Advanced market resilience is stronger, with almost 70% of their protection needs covered as of 2022, up from 68.5% five years ago and 66.5% in 2012. In emerging regions, healthcare resilience has particularly improved as health insurance premiums have grown at rates far higher than GDP.
New crop I-RI recognises the importance of the agrifood system in supporting an estimated 50% of the world’s population.
The progress made in insurance resilience alongside the widening protection gap highlight the value proposition of insurance in supporting financial security for households and businesses. It also signals huge development potential for the industry: USD 1.8 trillion equates to 26% global insurance premiums written in 2022.
Insurance Resilience Index by region
Insurance protection gaps by region
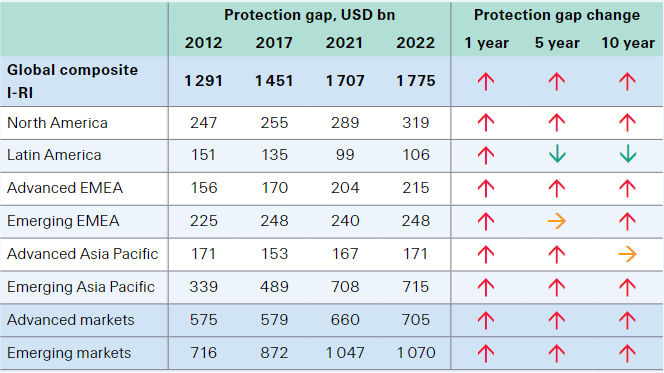
With crop exposures added, we estimate the global protection gap reached a new high of USD 1.8 trillion in 2022.
This is up by 4% in nominal terms year-on-year from revised estimate of USD 1.7 trillion for 2021, and a cumulative 20% increase from five years ago.
Since 2012, the global protection gap has grown at 3–5% annually in nominal terms, roughly matching that of global nominal GDP growth trends. This implies that the protection gap rises and widens alongside economic growth despite gradually improving resilience. Adjusted for USD inflation, the protection gap declined by 3.7% in real terms in 2022.
Growth rates per annum of the global protection gap and global GDP
- The advanced markets protection gap jumped by 6.9% in nominal terms in 2022, with strong growth rates in health and natural catastrophe gaps. The mortality protection gap declined marginally in advanced markets.
- For emerging markets, accounting for 60% of the global protection gap, their unmet protection need grew by 2.2% nominally in 2022, with a significant improvement in health resilience helping to close the gap.
Protection available is increasing at a faster rate than protection needed in the crop, natural catastrophe and health perils, resulting in increasing resilience. The I-RI is highest for health, followed by mortality, crop and natural catastrophe.
Higher inflation tends to negatively impact the (real) value of household financial assets including insurance coverage, particularly for maturity mortality policies in which benefits are defined at the inception of the policy.
Soaring prices also increase household burden to replace or reconstruct the building if disasters occurred, and decrease households’ financial resources, which hinders families from purchasing more insurance or leveraging other tools to improve the protection gap.
Per peril, the natural catastrophe protection gap growth rate is well above that of the composite, especially for 2022, driven up by rising construction costs, mostly in North America and western Europe. The crop protection gap also surged in 2022 as the Ukraine war triggered higher food prices.
Global crop protection gap

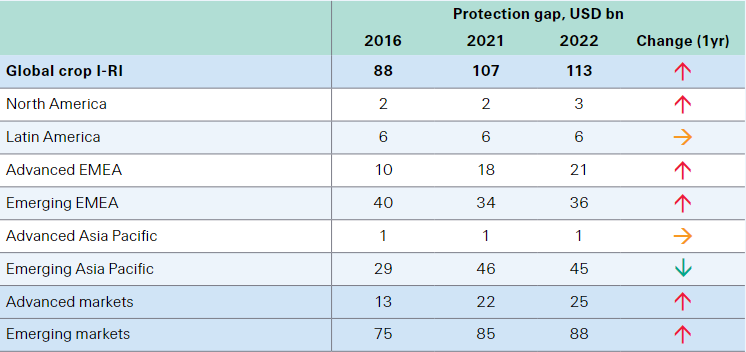
The global crop protection gap stands at an estimated USD 113 billion in USD premium equivalent terms in 2022.
This corresponds to about 59% of the insurable value of crop production left unprotected: in other words, a resilience index value of around 41%. The protection gap last year was up from USD 88 billion in 2016, with the index 13 ppts higher as of 2022.
The global crop protection gap increased by 4.2% on average per year, partly from inflation. Indeed, increasing prices for commodities and other farming inputs mechanically moves protection needed, and therefore the gap, higher.
Crop Insurance Resilience Index
Crop Insurance protection gaps
The second way through which protection needed changes is the fast growth of crop production and increasing market sophistication in some large emerging economies such as China, on the back of supportive policies and advances in agro-related technology.
Improving regulation in areas such as fertilizers and phytosanitary controls is also supporting growth in farming.15 Overall, protection needed and protection available both rose strongly since 2016, with the latter doing so at a faster clip owing to rising insurance penetration. While there is more to protect, an increasing share of that amount is insured.
Natural catastrophe resilience
Floods, earthquakes and severe storms are major threats to societal and economic development, households and businesses. In addition to loss of life and bodily injury, natural catastrophes can inflict damage to property, resulting in potentially significant financial losses on both macro and micro levels.
By providing compensation for those losses, insurance can enable faster reconstruction and recovery. In addition, insurance contributes to the understanding and impact of the natural hazards through disaster risk assessment.
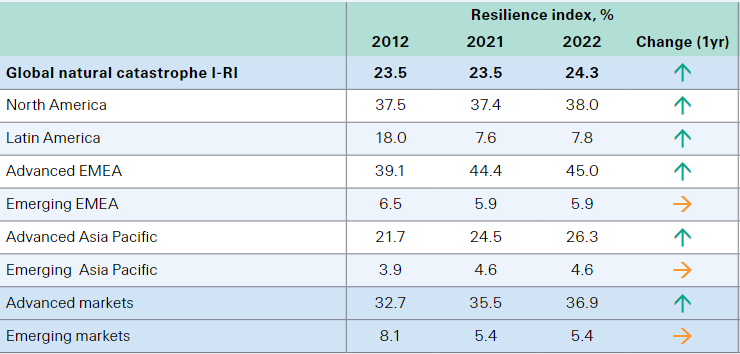
We calculate the natural catastrophe I-RI as the ratio between protection available from the private insurance sector and protection needed, based on modelled annual expected natural catastrophe losses. In other words, it measures the aggregate amount of insurance against major natural hazards in a country or region (see Cyber Security Top Trends & Cyber Attack Threats. 5 Scenarios of Resilience).
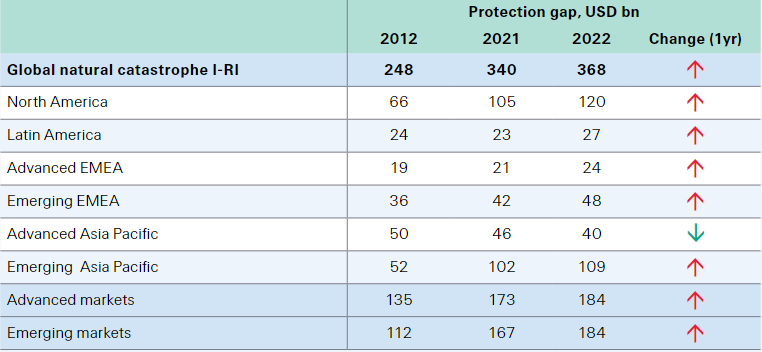
The natural catastrophe protection gap is the difference between protection available and protection needs. We measure protection available as the amount of annual written insurance premiums to cover for natural catastrophe risks, based on the annual expected insured losses.
Protection needs measures as the amount of annual premiums that would be needed to cover for all natural catastrophe risks, based on annual expected economic losses.
Both the expected economic losses and expected insured losses are based on our modelled estimate of the risk of natural catastrophes in each country in a given year.
Natural Catastrophe Insurance Resilience Index
Natural Catastrophe protection gaps
Modelled losses must not be mistaken for the actual economic and insured losses as reported in SRI’s annual sigma study, which are based on actual events, whereas modelled numbers are based on exposures.
The protection gap in premium equivalent terms is higher than that based on loss estimates alone, since premiums also cover insurers’ costs, reserving and other requirements.
This year we also include modelled exposure to severe convective storms (SCS). These represent globally the peril with the biggest loss potential, followed by tropical cyclones.
They occur to different degrees of frequency and severity in many countries, but it is in the US that they typically cause the most damage. In the US and Canada, the wide geographic extent and high number of SCS has created a steadily increasing insurance loss trend. SCS risk is also high in Australia and is rising in Europe.
Swiss Re Insitute research offers several action points for consideration:
- Tackling one area of resilience can have positive spillovers in others. For example, deeper financial markets are associated with higher insurance penetration and more efficient labour markets. Likewise, higher insurance penetration rates reduce the impact of a shock on public finances, and so support fiscal space. Targeted measures to improve one aspect can uplift other dimensions of resilience at the same time, initiating positive feedback loops.
- Evaluation of the full effects of public policies is needed. Less public policy intervention in private markets ensures risk signals can more adequately reflect reality. While strong interventions are valuable in crises, a clear timeframe to exit such policies can support economies to rebuild strength themselves.
- Governments could proactively evaluate their vulnerabilities and invest in resilience, taking a long-term approach. For example, the war in Ukraine was a signal of Europe’s reliance on natural gas. Energy independence, environmental and societal sustainability go hand in hand and should be urgently addressed.
- Resilience bonds could be more widely used. Similar to catastrophe bonds, these connect insurance premiums to resilience-building projects. Hence, they help fund risk reduction projects via resilience rebatesthat translate avoided losses into a revenue stream.
…………………….
AUTHORS: Roopali Aggarwal – Insurance Research & Data Associate, Swiss Re Institute, Dr Thomas Holzheu – Chief Economist Americas, Deputy Head of Group Economic Research and Strategy Swiss Re Institute, Lucia Bevere – Senior Catastrophe Data Analyst, Swiss Re Institute, Dr Li Xing – Head Insurance Market Analysis Swiss Re Institute, Dr Chandan Banerjee, Caroline De Souza Rodrigues Cabral, Hendre Garbers, Patrick Saner, Arnaud Vanolli – Swiss Re Insitute


