Overview
Natural disasters resulted in global economic losses of USD 275 billion, of which USD 125 billion were covered by insurance, the fourth highest one-year total on sigma records. Beyond the natural catastrophes themselves, other factors such as the impacts of economic inflation and financial market losses have also fed into market hardening, according to Swiss Re’s sigma report “Natural Catastrophes and inflation: a perfect storm”.
An additional contributing factor has been the need for more discipline in the modelling and underwriting of secondary perils in particular. This has led to mismatches of risk assessment and actual exposures and, in turn, insufficient market capacity.
With Hurricane Ian in Florida, record breaking losses from hailstorms in France, floods in Australia and South Africa, winter storms in Europe and the US as well as droughts in Europe, China and the Americas, 2022 was the second consecutive year in which insured losses from natural catastrophes exceeded the USD 100 billion mark.
This reaffirms the trend of a 5–7% average annual increase in insured losses over the past three decades (see Top 10 Global Economic & Insured Loss Events).
Property catastrophe re/insurance rates rose to 20-year highs in the January 2023 renewals, continuing a trajectory that began in 2018. Demand for covers has grown as natural disasters continue to wreak property damage across the world.
The magnitude of losses in 2022 is not a story of exceptional natural hazards, but rather a picture of growing property exposure, accentuated by exceptional inflation
Martin Bertogg, Head of Catastrophe Perils at Swiss Re
While inflation may subside, increasing value concentration in areas vulnerable to natural catastrophes remains a key driver for increasing losses (see Impact of Natural Catastrophic Risks for the US P&C Insurance Market). For our industry this is a call both to reflect the latest exposure even more carefully in risk assessments while continuing to support society in being better prepared.
- Natural disasters resulted in global economic losses of USD 275 billion in 2022, of which USD 125 billion were covered by insurance
- Economic growth and accumulation of property assets in exposed areas were main loss drivers, aggravated by exceptional inflation pressure
The re/insurance rate gains of recent years coincide with a trend period of heightened natural catastrophe activity and elevated losses that started in 2017. The 2022 insured loss outcome reaffirms a 5‒7% annual growth trend in place since 1992, this based mostly on rising severity of losses resulting from primary and secondary peril events (see Listing of Global Events & Economic Loss).
Today average annual insured losses of more than USD 100 billion are standard. The biggest loss event in 2022 was Hurricane Ian (estimated insured loss of USD 50‒65 billion). Other large-loss events were floods in Australia and South Africa, hail in France, winter storms in Europe, and heatwaves in Europe, China and the Americas.
Economic factors remain the main driver of rising losses
Rather than the physical destructive force of natural catastrophes themselves, the main driver of resulting high losses are economic growth, accumulation of asset values in exposed areas, urbanisation and rising populations, often in regions susceptible to natural perils (see Natural Catastrophe Losses Will Continue to Be the Largest Risk).
The evolution of a range of present-day risk factors like climate change effects and, of late, inflation, will continue to drive losses higher.
Economic inflation has surged over the last two years, averaging 7% in the advanced markets and 9% in the emerging economies in 2022.
Initially sparked by pandemic-induced supply chain disruptions and large monetary and fiscal stimuli, soaring food and energy prices due to the war in Ukraine have compounded inflation pressures. The effect of high prices has been to increase the nominal value of buildings, vehicles and other insurable assets, in turn pushing up insurance claims for damage caused by mother nature.
According to Climate & Global Natural Catastrophe Insight, the impact has been most immediate in the construction sector. Increases in the costs for materials and labour because of shortages thereof have led to higher claims to cover the costs of building repairs. In the US, for example, the aggregate replacement cost of buildings in 2022 had risen by an estimated 40% since the start of 2020.
Inflation impacts values of insured assets
With natural disasters continuing to wreak property damage across the world, the demand for coverage has grown. At the same time, inflation has surged over the last two years, averaging 7% in advanced economies and 9% in emerging economies in 2022.
The effect of high prices has been to increase the nominal value of buildings, vehicles and other insurable assets, thus pushing up insurance claims for damage caused by natural catastrophes.
The economic storm is not over, and interest rates will likely have to increase further given existing inflation pressure. This means higher financing costs and, as a result, capacity providers are likely to remain more cautious in deploying capital for a number of reasons, including risk assessment and loss experience.
Jérôme Jean Haegeli, Swiss Re’s Group Chief Economist
As higher exposures encounter shrinking risk appetite, momentum for rising prices, higher retentions and tighter terms and conditions will likely continue.
Hurricane Ian main loss driver in 2022
Insured losses were largely driven by Hurricane Ian, by far the year’s costliest event. Making landfall in Florida in September as a category 4 storm, Ian resulted in estimated insured losses of USD 50–65 billion. After Hurricane Katrina in 2005, Ian ranks as the second-costliest natural catastrophe insured loss event on sigma records.
In February, a cluster of storms (Eunice, Dudley, Franklin) in north-western Europe triggered combined insured losses of over USD 4 billion, bringing the total for this category to almost double the previous 10-year average. Meanwhile, France saw the highest ever annual loss (USD 5 billion) from hailstorms.
Global losses from floods were above average, the main event being flooding in eastern Australia in February-March 2022. This resulted in insured losses of USD 4.3 billion, the biggest natural catastrophe claims event ever in Australia.
On the opposite end of the rainfall spectrum, weather variability and anomalous atmospheric circulation conditions contributed to severe droughts and record-breaking heatwaves across the world. In Brazil, crop yields, particularly soybean and corn, suffered most, resulting in insured losses of USD 1 billion.
The global catastrophes were driven by known risk factors
Rising natural catastrophe losses and shortfalls in industry estimates of those losses point to the need for better understanding of all the risk drivers at play.
The re/insurance industry has long monitored primary perils but this has not always been the case for secondary perils, the associated losses of which have been rising for many years.
There is a need for greater discipline in the monitoring of the loss-driving secondary peril exposures and industry sharing of related findings (see Climate Risk & Weather-Related Re/Insurance Industry Losses Review).
Lack of granular exposure data can also hinder understanding of all present-day risks. For instance, the increase in built-up land area and changes to the vulnerability of homes to hazards (eg, more solar panels on roof tops) are difficult to keep track of. The fast rate of change of such variables necessitates shorter update cycles of data sets and models, to mitigate risk accumulation and underestimation of loss trends.
Natural catastrophes and inflation
The loss generating power of nature, alongside the socio-economic and geopolitical crises of recent years helped pushed property reinsurance rates to 20-year highs in the January 2023 renewals season.
Global economic losses from natural disasters mounted to USD 275 billion in 2022. At USD 125 billion, insured losses covered 45% of the damage, the fourth highest total for a single year on sigma records.
Annual global insured losses of more than USD 100 billion from natural catastrophes are standard.
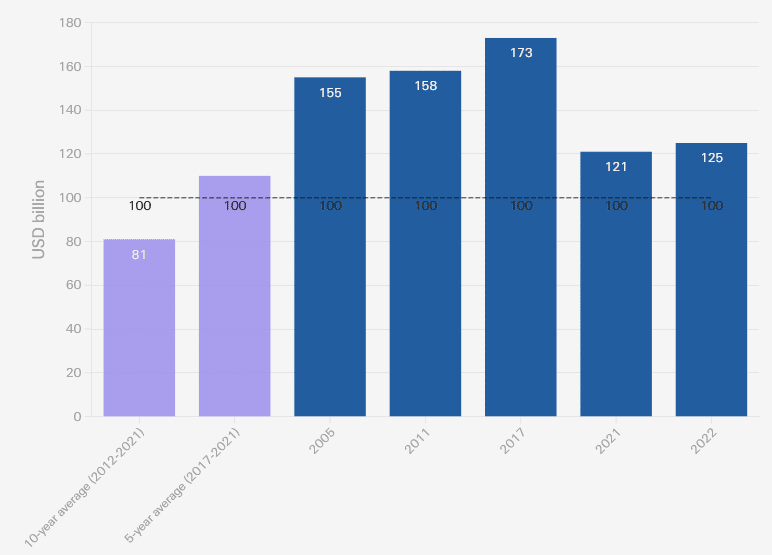
Global catastrophe insured losses, in USD bn at 2022 prices
A prevailing economic storm in 2022 was high inflation, which, by raising the nominal value of buildings, motor vehicles and other fixed assets that insurers cover, pushed up claims to cover the cost of repairs.
Hurricane Ian was the costliest event of 2022, resulting in insured losses estimated at USD 50-65 billion.
The storm made landfall in an area of high economic value, urbanisation and population growth, demonstrating the role these factors play as the main drivers of heavy losses inflicted by natural catastrophes.
Risk profiles of 12 countries
While the sigma report features mainly global data, Swiss Re’s infographic provides the risk profiles of twelve countries: Australia, Canada, China, France, Germany, Italy, Japan, Mexico, South Africa, Switzerland, the United Kingdom and the United States of America.
Total economic and insured losses
| USD billion | Losses | 10Y avg |
| Economic losses (total) | 284 | 220 |
| Natural catastrophes | 275 | 208 |
| Man-made catastrophes | 9 | 12 |
| Insured losses (total) | 132 | 91 |
| Natural catastrophes | 125 | 81 |
| Man-made catastrophes | 7 | 9 |
Rising losses from catastrophes point to the need for full understanding of all risk factors, in particular with respect to secondary perils, which are not always monitored as closely as primary peril risks.
The loss experience offers insights for re/insurers including
- a need for better monitoring and sharing of granular exposure data;
- the importance of observation periods and a debiasing of historical losses;
- the need for models and underwriting decisions to adjust readily to rapidly changing physical and socio-economic conditions.
Swiss Re expect hard markets conditions to persist in 2023, based on rising demand for coverage and inflation-driven higher values of insured assets.
On the supply side, a reduction in risk appetite on the part of capital providers has constrained market capacity. Interest rate hikes to fight inflation have also played a role, by increasing the cost of capital and reducing the value of financial assets.
Uncertainties around risk trends are constraining industry capacity
Swiss Re expect the hard market in re/insurance to continue, based on increased demand for coverage and because of inflation-driven higher values of insured assets. Current supply-side stresses also underpin the hard market. For one, industry capital has fallen in response to rising interest rates.
Adding to capacity shortages, six years of weak results in property underwriting have reduced risk appetite.
In the face of higher financing costs given interest rate rises, some capacity providers have become more cautious with respect to the potential for misalignment of risk assessment and loss experience.
As higher exposures encounter shrinking risk appetite, momentum for rising prices, higher retentions and tighter terms and conditions will likely continue.
Global insured losses from natural catastrophe events
Last year’s natural catastrophe-related losses were, once again, high. Driven mostly by extreme weather events, global insured losses from natural disasters were USD 125 billion in 2022, well above the previous 5- and 10-year averages (USD 110 billion and USD 81 billion, respectively, inflation adjusted).
The losses were the fourth highest in any one year since 1970 and for first time ever, global insured losses exceeded USD 100 billion two years running (ie, in 2022 and 2021).
The insured annual loss totals from natural catastrophes has surpassed the USD 100 billion-mark five times since 1970, and three times in the past six years (2017, 2021 and 2022).
Economic losses of USD 275 billion point to a still large protection gap, with around 54% of the total losses uninsured. Though still large, this is less than the 61% average protection gap of the previous 10 years.
Last year’s main events hit areas of relatively higher insurance penetration, attesting to the fundamental value proposition of the industry to making households, businesses and institutions more resilient.
Starting from 2017, average annual insured losses from natural catastrophes have been above USD 110 billion, more than double the average of USD 52 billion over the previous 5-year period.
This marks a notable step-up in the scale of losses after the 2012‒2016 period of benign losses. Asset value accumulation in an area struck by an extreme weather or other natural catastrophe can spark heavy financial losses. Another factor has been changes in construction costs.
Of late, aging infrastructure vulnerabilities and inflationary pressures have boosted repair costs. And, with demand-supply imbalances of materials and labour still in play in the post COVID-19 era, we expect construction costs to remain elevated into 2023, further inflating repair and reconstruction costs.
This will impact attritional losses and further augment property losses over the next two years at least. Hazard intensification will likely play a bigger contributory role to rising losses in the coming decade also. With the world getting warmer, findings from scientific research infer that climate change effects on loss frequency and severity will intensify.
Natural Catastrophes & Disasters FAQs
What are natural catastrophes examples?
Avalanche.
Coastal Flooding.
Cold Wave.
Drought.
Earthquake.
Hail.
What is the biggest natural catastrophe?
The Great Galveston Storm occurred on September 8, 1900, when a hurricane with an estimated strength of Category 4 hit Galveston, Texas. This hurricane remains the deadliest natural disaster in U.S. history, as well as the worst hurricane in U.S. history.
What are the top 10 worst natural disasters in history?
Hurricane Andrew of 1993.
Tohoku Earthquake and Tsunami.
Tsunami of 2011.
Tangshan Earthquake.
Cyclone Nargis.
2008 China Earthquake.
2003 Iran Earthquake.
2005 Pakistan Earthquake.
What is the number 1 natural disaster?
The following data is taken from Wikipedia, Statista.com, and Weather.com: The hurricane that struck Galveston, Texas, in 1900 remains the deadliest natural disaster in North American history, with some death toll estimates reaching 12,000. Between 1900 and 2016, tropical cyclones killed 16,134 Americans.
What are the top worst natural disasters in 2022-2023?
2023 São Paulo, Brazil Floods. 2023 Turkey-Syria Earthquake.
2023 Turkey-Syria Earthquake. 2023 New Zealand Floods and Cyclone Gabrielle.
2023 New Zealand Floods and Cyclone Gabrielle.
2023 US Tornadoes.
2022 Indonesia Earthquake.
2022 Atlantic Hurricane Season.
2022 Pakistan Floods.
2022 International Wildfires.
What was the greatest catastrophe in history?
The first outbreak of the Black Death in Europe killed millions (claims range between 25 to 50 percent of Europe’s population) and it remains one of the greatest catastrophes in human history.
What natural disaster kills the most humans?
Historically, droughts and floods were the most fatal disaster events. Deaths from these events are now very low – the most deadly events today tend to be earthquakes.
What disasters will happen in 2023?
The top 10 crises the world can’t ignore in 2023
Somalia: A catastrophic hunger crisis tops the Watchlist.
Ethiopia: Drought and conflict torments tens of millions.
Afghanistan: An entire population is pushed into poverty.
Democratic Republic of Congo: Decades-long conflicts escalate.
………………………
AUTHORS: Lucia Bevere – Senior Catastrophe Data Analyst Swiss Re Institute, Thierry Corti – Climate Change Lead Swiss Re Institute, James Finucane – Senior Economist Swiss Re Institute, Roman Lechner – P&C Economic Research Lead Swiss Re Institute