Overview
Reinsurers’ underlying underwriting results were generally strong despite the unusual amount of volatility in the capital markets. Significant unrealized investment losses on bond portfolios weighed heavily on overall earnings and reported capital positions. The losses are viewed as temporary and largely non-economic in nature.
Aon’s Reinsurance Aggregate (ARA) report analyses the financial results of 19 reinsures that together underwrite more than 50% of the world’s life and non-life reinsurance premiums. The outcomes are therefore viewed as a reasonable proxy for the sector as a whole. ARA report is highly relevant, given that financial performance drives investor commitment and ultimately the delivery of capacity.
Looking ahead, renewal outcomes in 2024 and the tailwind of higher interest rates have improved the outlook for reinsurers and we expect new capital inflows to begin relieving current capacity constraints when earnings delivery is confirmed in reported results.
Mike Van Slooten, Aon’s head of business intelligence
According to Global Reinsurance Industry Results, recent renewals have highlighted constraints in reinsurer underwriting appetites, particularly for property catastrophe business. The report reveals that the ARA group posted resilient underwriting results, despite the impact of Hurricane Ian.
However, asset values were eroded by sharply rising interest rates and falling stock markets, resulting in weak overall earnings and reductions in reported equity.
Key highlights include:
- Property & Casualty gross premiums written rose by 9% to $272 billion.
- Underwriting profit of $8 billion represented a net combined ratio of 96.2%.
- The total investment return fell by 61% to $12.3 billion.
- Net income fell by 56% to $9.6 billion, representing a return on equity of 5.2%.
- Total shareholders’ equity fell by 21% to $157 billion at year end.
While capital is a complex issue and businesses are not affected equally, it is more about how you tell your risk/reward story and focusing your access to capital on delivering a stable outlook rather than on an episodic one, which is driven by the circumstances of the current cycle.
Sherif Zakhary, CEO, Aon’s Strategy and Technology Group
Based on Aon Catastrophe Insight data, 203 was the fifth most costly year for global insured losses from natural catastrophe (NatCat) events, behind 2017, 2011, 2021 and 2005. The estimated total of $142 billion in 2022 was dominated by Hurricane Ian, which was included at $52.5 billion (see ILS, Cat Bond & Post Hurricane Ian Reinsurance Market Update).
The year also featured an unusual amount of volatility in the capital markets. Bond values were impacted by sharply rising interest rates, as central banks moved to head-off the threat of inflation. At the same time, geopolitical risk and fears of recession drove poor stock market performance.
Reinsurance Market Outlook
According to IAIS Reinsurance Market Survey, the six-year period from 2017 to 2024 was challenging for earnings. Over this timeframe, the ARA reported an average net combined ratio of 100.3 percent and an average return on equity of 5.9%, which was only around two-thirds of the average cost of equity.
Investors, and in some cases rating agencies, are demanding improved results and this is a major driver of current underwriting discipline. Renewals so far appear to be delivering on the expectation of better future returns, with higher interest rates also offering a potential tailwind.
Aon expects depleted shareholders’ equity to be restored over time, via higher retained earnings and the ‘pull-to-par’ effect of bonds approaching maturity. In the meantime, capital adequacy generally remains strong under risk-based regulatory and rating agency capital models. Recent inflows of new capital have been modest, but may increase as earnings delivery is confirmed.
As always, the main downside risks are extreme loss activity and unexpected macroeconomic volatility. Geopolitical developments are being closely monitored and reserve adequacy may be threatened by any broadening need to revise long-term inflation assumptions.
The introduction of IFRS 17 from 2025 is likely to present considerable challenges in producing global peer studies like the ARA, given that the new regime diverges significantly from U.S. GAAP.
Total Reinsurance Capital
On a like-for like basis, global reinsurance capital declined by 16% to $214 billion over the year . Issued debt was flat at $58 billion, while total equity fell by 21% to $157 billion.
The debt-to-total-capital ratio increased to 26.9%, from 22.8%.
ARA Total Capital ($ bn)
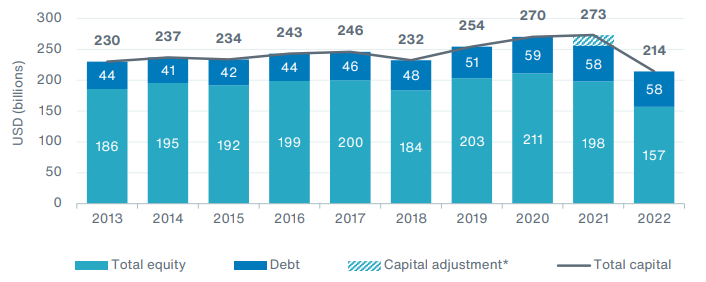
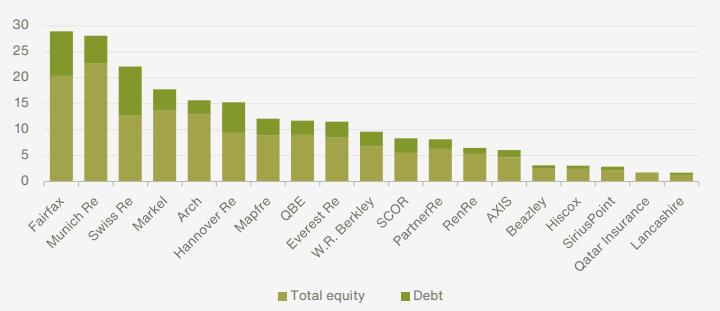
Total capital reported by the 19 ARA constituents. Munich Re had the largest equity base, followed by Fairfax, Markel, Arch and Swiss Re.
Total Capital by Reinsurers ($ bn)
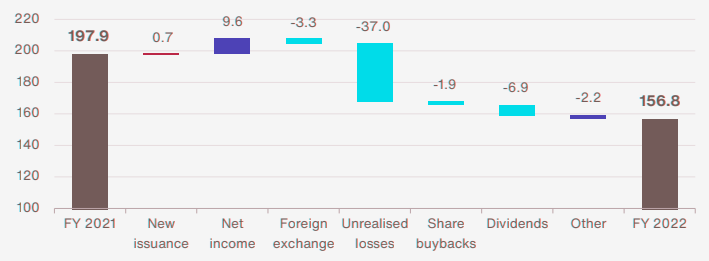
Movements in Equity
The contributing factors to the change in ARA total equity over the course. Reported net income of $9.6 billion was largely offset by dividends and share buybacks of $8.8 billion.
The dominant driver of the 21% overall decline was $37 billion of unrealised losses on bonds, recorded within other comprehensive income. The expectation is that most of these bonds will be held to maturity and that values will recover as that date approaches, typically over 2-3 years.
Evolution of ARA Total Equity ($ bn)
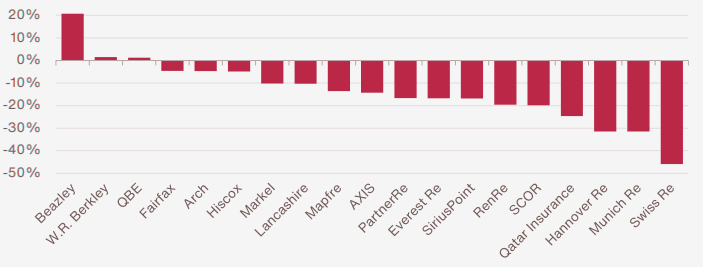
Most ARA constituents reported year-on-year declines in total equity. The biggest reductions were seen at the three largest global reinsurers, Hannover Re (-31%), Munich Re (-31%) and Swiss Re (-46%), reflecting relatively high leverage to long-dated bonds. Swiss Re also paid a sizeable, uncovered dividend.
The 21% increase at Beazley reflected the company’s decision to raise $400 million of new equity in mid-November to support growth.
Changes in Total Equity (Original Reporting Currency)
Reinsurance Capital Repatriation
The return of capital to investors in the form of dividends and share buybacks remained consistent with prior years.
Regulatory solvency ratios remain strong, but rating agency capital adequacy has generally become more constrained, and this may act as a brake on repatriation, despite the pressure to meet investor expectations.
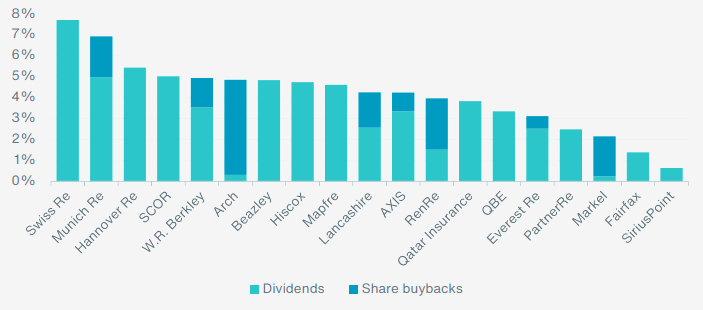
ARA Capital Repatriation as a Percentage of Opening Equity
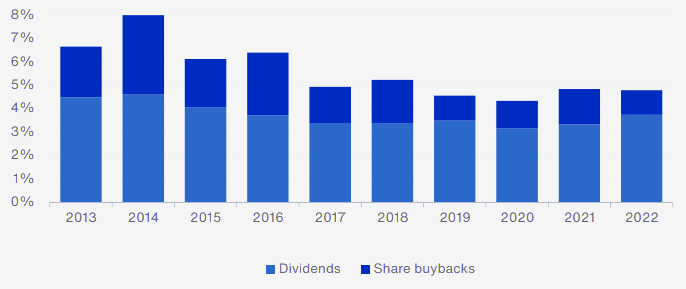
Capital repatriation by each ARA constituent, relative to opening equity. The relatively high level of capital return at Swiss Re, Munich Re and Hannover Re contributed to the sizeable reductions in shareholders’ equity seen.
Capital Repatriation as a Percentage of Opening Equity
Total Gross Reinsurance Premiums Written
Total GPW rose by 6% to $343 billion, but growth would have been significantly higher at constant exchange rates. Property and Casualty (P&C) premiums increased by 9% to $272 billion, split primary insurance $134 billion (+11%) and assumed reinsurance $137 billion (+7%).
Other premiums fell by 3% to $72 billion, including $53 billion of Life and Health (L&H) reinsurance business written by Hannover Re, Mapfre, Munich Re, PartnerRe, SCOR and Swiss Re.
Breakdown of ARA Total GPW ($ bn)
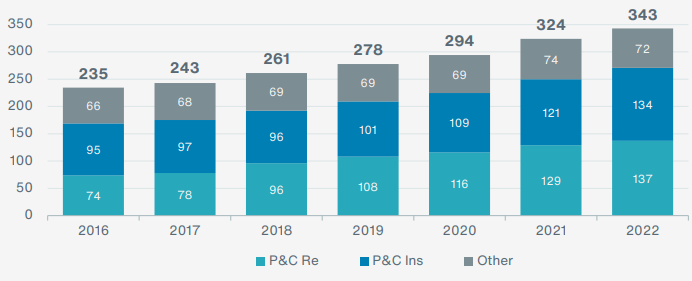
Exhibit shows a breakdown of the total GPW of each ARA constituent, based on our best interpretation of the available data. The combined contribution of the three largest companies – Munich Re, Swiss Re and Hannover Re – was 45%.
Total GPW by ARA Constituent ($ bn)
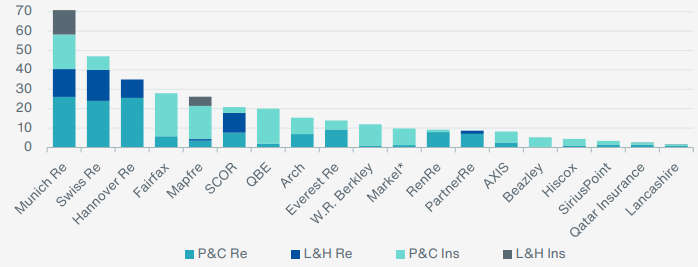
P&C Gross Premiums Written
P&C business written by each ARA constituent, split between primary insurance and assumed reinsurance, based on our best interpretation of the available data. Hannover Re is now the second largest global P&C reinsurer, still slightly behind Munich Re.
Breakdown of 2022 P&C GPW ($ bn)
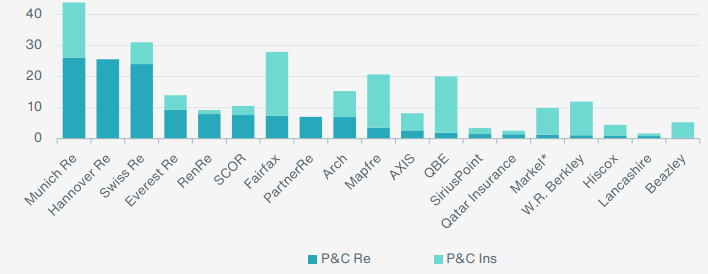
According to US P&C Insurance Market Underwriting Results, the average growth in P&C GPW in 2022 was close to 15%, driven largely by risk-adjusted rate increases and robust demand for risk transfer in a volatile operating environment.
Reinsurers results
| Rank | Company | P&C premium | Change |
| 1 | Munich Re | 34,399 | 19% |
| 2 | Swiss Re | 31,035 | 4% |
| 3 | Fairfax | 27,913 | 17% |
| 4 | Hannover Re | 24,242 | 26% |
| 5 | QBE | 20,001 | 8% |
| 6 | Mapfre | 19,342 | 10% |
| 7 | Arch | 15,326 | 27% |
| 8 | Everest Re | 13,952 | 7% |
| 9 | W.R. Berkley | 11,909 | 11% |
| 10 | SCOR | 10,017 | 22% |
| 11 | Qatar Insurance | 9,848 | -22% |
| 12 | Markel | 9,837 | 16% |
| 13 | RenRe | 9,214 | 18% |
| 14 | AXIS | 8,215 | 7% |
| 15 | PartnerRe | 7,015 | 7% |
| 16 | Beazley | 5,269 | 14% |
| 17 | Hiscox | 4,425 | 4% |
| 18 | SiriusPoint | 3,406 | 21% |
| 19 | Lancashire | 1,652 | 35% |
| ARA (Total) | 264,542 | 9% |
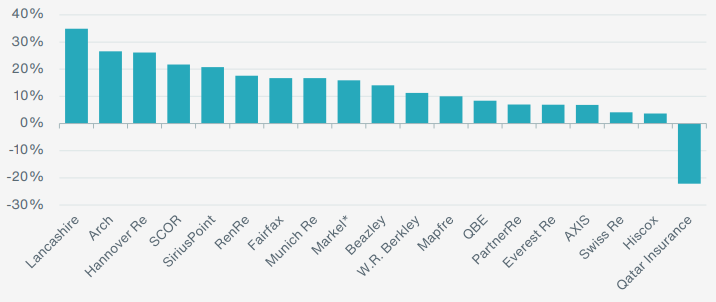
The sharp decline at Qatar Insurance reflected the company’s decision to report its Gibraltar-based UK motor operations as discontinued operations, pending completion of a sales process in 2023.
P&C GPW Growth (Original Reporting Currency)
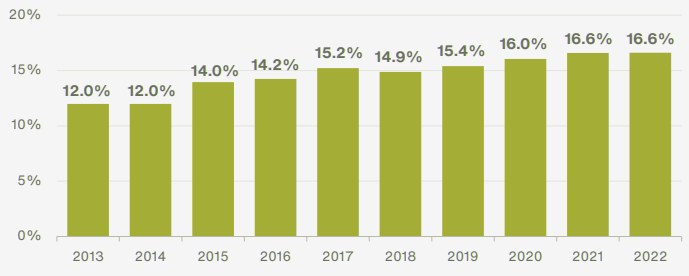
P&C Ceded Premiums
The outwards cession ratio across the ARA’s P&C business as a whole was unchanged at 16.6%. The movements were roughly balanced overall, with no discernible pattern emerging.
ARA Outwards Cession Ratios (P&C Business Only)
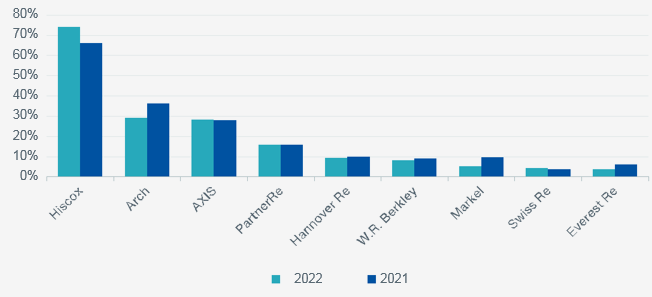
P&C Retrocession Ratios
The ARA reported P&C underwriting profit of $8 billion before tax an increase of 13% relative to the prior year. The combined ratio improved marginally to 96.2%, taking the 6-year average since 2017 to 100.3%.
ARA Net Combined Ratio
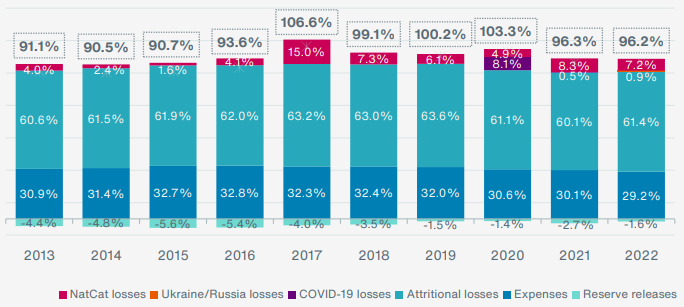
Based on Aon Catastrophe Insight data, these were five of the seven most expensive years for insured losses from natural catastrophe (NatCat) events.
Only five companies reported underwriting losses on their P&C business.
NatCat Impact
2023was the fifth most expensive year for insured NatCat losses. The dominant reinsured event was Hurricane Ian, but record floods in Australia and South Africa, hailstorms in France, winter storms in Europe and the U.S. and droughts in Brazil also contributed.
Net NatCat losses reported by the ARA were marginally lower than the prior year at $15.3 bn, contributing 7.2% to the overall combined ratio.
The NatCat net loss ratios reported by each ARA constituent in the last two years. Disclosures in this area are viewed as inconsistent and incomplete.
Favourable development of prior year P&C reserves fell by 35% to $3.3 billion in 2022, benefiting the ARA combined ratio by 1.6%. Adjustments reported by each ARA constituent in the last two years. Most companies are continuing to show reserve releases, albeit at lower levels. Disclosures in this area are viewed as inconsistent and incomplete.
Reinsurers Constituent Financial Strength Ratings
| Reinsurers | AM Best | S&P |
| Arch | A+ | A+ |
| AXIS | A | A+ |
| Beazley | A | A+ |
| Everest Re | A+ | A+ |
| Hannover Re | A+ | AA- |
| Hiscox | A | A |
| Lancashire | A | A- |
| Mapfre | A | A+ |
| Markel | A | A |
| Munich Re | A+ | AA- |
| Fairfax | A | A |
| PartnerRe | A+ | A+ |
| Qatar Insurance | A- | A- |
| QBE | A | A+ |
| RenRe | A+ | A+ |
| SCOR | A | A+ |
| SiriusPoint | A- | A- |
| Swiss Re | A+ | AA- |
| W.R. Berkley | A+ | A+ |
Capital market conditions were very volatile. Rapidly rising interest rates undermined the market value of fixed-income securities carrying lower coupons, while equity prices were impacted by poor stock market performance.
The ordinary and total pre-tax investment yields reported by the ARA constituents, prior to the impact of hedging strategies and foreign exchange movements.
Direct comparison of total yields is highly misleading, due to significant variances in the accounting treatment of mark-to-market losses on bonds. Some companies capture all of the movement in pre-tax earnings. Others report the bulk of the impact through other comprehensive income.
………………….
AUTHORS: Mike Van Slooten – Head of Business Intelligence Aon, Marie Teissier – Senior Financial Analyst Business Intelligence Aon, Oliver Troop – Senior Financial Analyst Business Intelligence, Ludo Van Wijk – Senior Financial Analyst Business Intelligence Aon Reinsurance Solutions